GOLD 30 Min chart analysis1. Trend : Price was in a downtrend with continuous lower highs and lower lows. Now the chart is showing a falling wedge pattern, which is a bullish reversal pattern. Breakout candle is visible with strength, indicating trend reversal from bearish to bullish on the 30-minute timeframe.
2. Volumes: Volumes remained average during the fall.
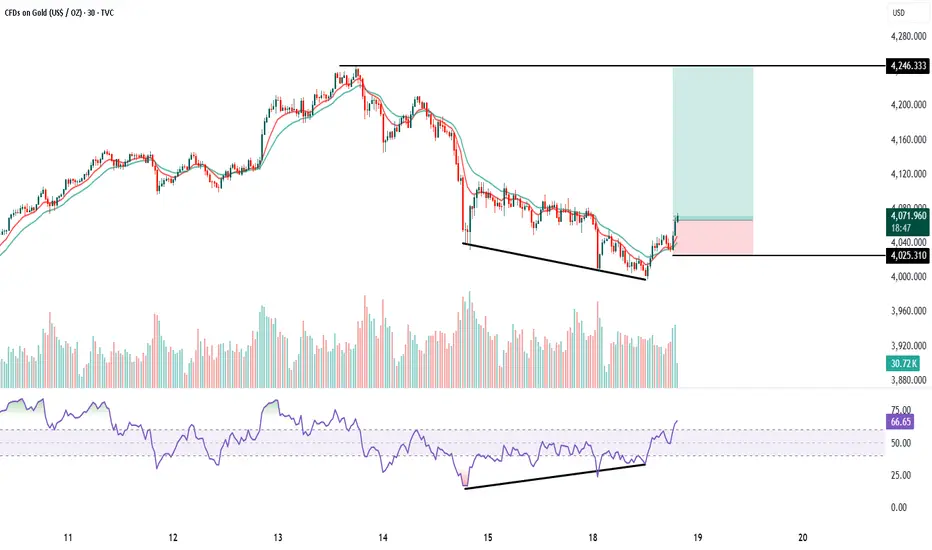
At the breakout zone, you can see volume expansion, which confirms buyers are stepping in.
This supports a valid bullish breakout.
3. Momentum (Price Action + EMAs): Price is crossing above the 10 EMA and 20 EMA, and both EMAs are starting to turn upward. This shows momentum shift from sellers to buyers. Momentum candles at breakout confirm the start of an upward move.
4. RSI Divergence: Price made lower lows, but RSI made higher lows.
This is a classic bullish divergence, indicating selling pressure is weakening. RSI has now moved above 60, confirming momentum is picking up strongly.
Buy above 4075 after the breakout candle closes above falling wedge.
This ensures confirmation and avoids a false breakout.
Keep SL just below wedge support: SL = 4025
Target : The major horizontal resistance shown on the chart is:
Target = 4246 This is also the measured move of the wedge, matching the resistance zone.
Risk–Reward: RR is approximately 1:3 to 1:3.5, which is ideal for breakout trades. This is a high-probability trend-reversal breakout setup with a clear target and safe stop loss.
Goldpriceprediction
XAUUSD – Consolidation Before Drop**Gold (XAUUSD) – Consolidation Before Potential Downside Move**
Gold continues to hover in a consolidation range after the recent breakout and structural shift on the 3H chart. The bullish momentum that previously dominated has now slowed, indicating a possible distribution phase forming near the $4,050–$4,100 zone.
The market structure shows repeated rejections at the upper boundary, suggesting that buyers are losing strength. With BOS (Break of Structure) confirmations in the recent candles and a clear lack of higher highs, a potential downside continuation could unfold once the current range is broken.
If sellers take control below $3,978, the next liquidity targets lie around **$3,886** and possibly **$3,614**. This scenario aligns with the broader retracement expectation after a strong prior uptrend.
However, a confirmed breakout above the consolidation area would shift the short-term bias back to bullish, with upside potential toward **$4,248** and beyond.
**Market Outlook:** Neutral → Bearish
**Bias:** Short-term corrective move expected
**Key Levels:**
* Resistance: $4,050 – $4,100
* Support: $3,886 – $3,614
**Tags:** #Gold #XAUUSD #GoldAnalysis #XAUUSDforecast #GoldPricePrediction #GoldTrading #GoldMarket #Commodities #TradingViewIdeas

Gold Market Outlook – Bullish Trend Building MomentumGold continues to follow a structured bullish cycle, where each consolidation phase has been followed by a breakout and expansion. Market behavior shows liquidity being collected in sideway ranges, then released to fuel upward momentum.
At the current stage, price is trading around $3,870, showing signs of a potential short-term pullback to gather liquidity from the mid-zone. Once this corrective move stabilizes, the chart suggests a renewed bullish impulse with a projected upside target toward the $3,965 level.
This pattern highlights that the market remains in a controlled bullish phase, where temporary retracements are acting as setups for continuation rather than reversal. The underlying flow still favors higher levels as long as buyers maintain activity after corrections.

Gold Forecast: Liquidity Rotation Shaping Price ActionGold Forecast: Liquidity Rotation Shaping Price Action
Gold’s recent movement reflects shifting dynamics between liquidity capture and market rebalancing. The push above 3,800 was less about sustained trend extension and more about triggering stops and gathering liquidity before rotating lower. This type of move often indicates that large participants are managing positioning rather than chasing new highs.
The current correction phase is part of that process. Price is being driven back into zones where imbalances remain, allowing institutional flow to realign. Instead of showing weakness, this return highlights how markets redistribute liquidity to prepare for the next decisive move.
From a flow perspective, gold remains in an accumulation phase. Consolidation pockets reveal ongoing positioning, while the corrective dip reflects controlled market engineering rather than disorder. If this cycle continues, the next stage could see energy released in the form of a renewed expansion leg once sufficient liquidity has been absorbed.
In essence, gold is navigating a liquidity-driven cycle: sweep → redistribute → prepare → expand. The underlying order flow still favors upward continuation once the current rebalancing phase completes.

XAUUSD Forecast – Gold Price Action and Market InsightsXAUUSD Forecast – Gold Price Action and Market Insights
Gold is showing signs of stabilization after recent fluctuations, with price consolidating around the mid-range levels. The chart highlights repeated sequences of structural breaks and shifts, indicating that liquidity has been actively swept on both the buy and sell side.
The latest market move shows a controlled decline, followed by an attempt to absorb selling pressure. Current positioning suggests the possibility of a short-term liquidity grab to the downside, which could fuel a stronger recovery leg in the sessions ahead.
The projected outlook favors a scenario where buyers regain momentum, aiming to retest the upper price zones. If this momentum develops, the market may establish a renewed upward leg in alignment with the broader bullish cycle observed across higher timeframes.
From a macro perspective, gold continues to be supported by demand for safe-haven assets amid ongoing global financial uncertainty and shifting monetary policies. This backdrop enhances the probability of gold sustaining its mid-term bullish trajectory despite temporary corrective phases.

Inflation Cools, Gold Heats Up Inflation Cools, Gold Heats Up
In June, the United States inflation fell to 3%, which is the lowest since March 2021. This was slightly below the market's expectations of 3.1% and a significant decline from May's rate of 4%. Additionally, the core inflation rate unexpectedly dropped to 4.8%, marking its lowest level since October 2021.
The implication of this deceleration is that it could prompt the Federal Reserve to scale back its plans for interest rate hikes. With inflation showing signs of cooling, the central bank may now be inclined to raise rates only once more throughout the remainder of the year.
In the wake of the inflation report gold prices shot up, soaring by more than 1.3%. The metal breached the $1,940 resistance level but fell just short of clearing the $1,960 overhead barrier. If further upward momentum materializes, it could pave the way for a potential retest of $1,975 and $1,980.
At the same time, the US dollar faced a steep decline, sinking to its lowest point in over 14 months. Against the Swiss franc, it tumbled to depths not witnessed since early 2015, settling at 0.8673 francs, down 1.4%. Earlier in the session, it even touched 0.8660, marking its weakest position since the Swiss National Bank abandoned the Swiss currency peg back in January 2015. Against the Japanese yen, the dollar hits a six-week low of 138.47 yen, witnessing a 1.4% decline. Additionally, the US dollar weakens by more than 1.5% against the New Zealand and Australian dollars. Conversely, the euro surges to its highest level since March last year, reaching $1.1125. The Euro trades up 1.2% at $1.113.

Has Gold (XAUUUSD) Topped out? Gold Price May FallOn Friday, 5 May 2023, Gold price got rejected from the All-time high levels of 2050-2070.
The drop resulted in formation of a DAILY BEARISH ENGULFING CANDLESTICK PATTERN as well as an EVENING STAR CANDLESTICK PATTERN at the ATH resistance levels, which shows sellers are active at this level.
Checking out previous price action, the GOLD Price is trading in a rising channel making HIGHER HIGHS & HIGHER LOWS which signifies the uptrend.
However, checking the RSI indicator which shows the momentum in the uptrend, RSI is making LOWER HIGHS. This results in BEARISH DIVERGENCE!
A Bearish Divergence is a sign of loss of strength in uptrend which means bulls are getting weak and may signal profit booking & trend reversal.
But this does not means to get Bearish on GOLD as of now. We need further confirmations for that.
If Daily candle closes below the rising channel as well as 1968, price may drop till 1940.
Area between 1915-1940 is the must hold level for BULLS. If price closes below 1915 we can then expect beginning of downtrend in GOLD
BUT, since price is still in uptrend and we must follow the trend untill it ends. If daily closes above 1970, price may continue to go high.
CONCLUSION
1. Price is still in uptrend.
2. If daily closes below 1968, price may drop till 1940
3. Area between 1915-1940 is a must hold levels for bullis. If price closes below 1915, a new downtrend may begin.
Let me know in the comments section if you want me to analyse any other financial instrument.
WARNING:-
ALWAYS FOLLOW RISK MANAGEMENT AND POSITION SIZING WHILE TAKING ANY TRADE.
