Gold (XAUUSD) Restistance @ 4710 - 4720 | Will it fall?Gold (XAUUSD) has shown a strong rally due to geopolitical situation between US and Europe but it's approaching resistance zone 4710 - 4720 and also overbought. We are looking for sell on rise opportunity as this area is strong supply zone, and fall is likely to happen.
📉 Trade Idea:
Look for sell opportunities in the 4710 – 4720 zone.
Targets and risk levels are clearly outlined on the chart.
⚠️ This is a counter-trend / pullback trade, best suited for intraday or short-term traders. Manage risk accordingly.
📌 Disclaimer:
This analysis is for educational purposes only and is not financial advice. Always manage risk and follow your trading plan.
Your feedback drives our content and keeps everyone trading smarter. Let’s make those pips together! 🚀
Happy Trading,
– The InvestPro Team
Goldsell

Technical Analysis on goldGold has recently experienced a strong upside move, primarily driven by heightened geopolitical tensions, which fueled safe-haven demand. This aggressive move resulted in a gap-up opening, leaving an unfilled gap around the 4508 level, which remains an important technical magnet.
From a technical perspective, price is currently trading within an ascending structure but is showing signs of compression near the upper boundary, suggesting potential exhaustion. A short-term triangle / consolidation structure is forming, indicating that a decisive move may be imminent.
The key level to watch is 4565.
A sustained break and acceptance below 4565 would confirm a shift in momentum and strengthen the bearish case.
If the rising trendline is broken, it would signal bearish continuation, with increased downside momentum likely to follow. In such a scenario, price could retrace further to fill the unfilled gap near 4508, which aligns with prior demand and liquidity.
From a fundamental standpoint, while gold initially rallied on geopolitical stress, recent developments suggest some easing in risk sentiment. Reduced escalation and a softer geopolitical tone have slightly cooled safe-haven flows, supporting a short-term bearish bias unless new risk catalysts emerge.
That said, the bullish scenario remains valid if geopolitical tensions escalate again. In such a case, renewed safe-haven demand could push gold higher, with a potential breakout above the previous ATH and extension toward the 4670 zone.
Summary
Bullish above trendline & resistance break → potential ATH continuation toward 4670
Bearish below 4565 & trendline break → downside continuation toward 4508 gap fill
Market currently at a decision point, awaiting confirmation
⚠️ As always, wait for confirmation and manage risk accordingly.

Triangle Pattern is forming in 5min ChartGold is consolidating within a triangle pattern, suggesting compression in price action. A downside break from this structure could trigger bearish continuation, especially if confirmed by strong volume and a close below key support levels

XAUUSD (15M) – Liquidity Sweep → Distribution SetupPrice is currently trading inside a clearly defined range.
Previous sell-side liquidity has already been swept from the equal lows, triggering a sharp displacement to the upside. This move looks corrective rather than impulsive.
Key observations:
Upside move is targeting equal highs / range high liquidity.
Area near the range high aligns with premium zone + likely supply.
Expecting buy-side liquidity grab above highs to trap late longs.
Plan & Bias:
Allow price to run the highs and complete the liquidity sweep.
Watch for bearish shift in market structure (MSS) on lower timeframe near the range high.
Look for short entries on retest of supply / FVG after MSS.
Target is a range rotation back to sell-side liquidity near the range lows.
Narrative:
Classic range manipulation. Market clears the downside, entices breakout buyers at the highs, then distributes and reverses. Patience until liquidity is taken, then execution.
📌 Bias remains short after buy-side liquidity is swept.

GOLD SELLXauusd wave B Started and gold is falling Toward Previous ATH.
Check Your Strategy and Take good Entry and Check Breakdown or Orderblock for Confirmation

XAU/USD Range Market – Sell from PremiumGold is currently trading in a clear ranging (TR) environment after the recent bullish expansion. On the H1 timeframe, price has reacted from the premium zone near the previous highs, while liquidity remains stacked below the range.
🔻 Sell Scenario:
Price is expected to react from the 4303 – 4306 resistance zone, aligned with prior distribution and rejection. This area favors short-term sell opportunities while the market remains inside the range.
🔺 Buy Scenario:
The 4247 – 4245 zone represents a liquidity pocket below the major value area, offering a favorable risk-to-reward setup. With a tight stop-loss, buy limit orders are valid if price sweeps liquidity and shows reaction.
📌 Key Levels:
Resistance: 4303 – 4306
Support / Liquidity: 4247 – 4245
As long as price stays within the range, sell from premium and buy from discount remains the primary strategy. Always respect stop-loss levels and manage risk accordingly.

if GOLD break DEC 2025 low then gold dump 10-15% below if GOLD break DEC 2025 low then gold dump 10-15% below
if GOLD break DEC 2025 low then gold dump 10-15% below if GOLD break DEC 2025 low then gold dump 10-15% below if GOLD break DEC 2025 low then gold dump 10-15% below v
v

DXY Warning Zone: Commodities & IT on Alert📌 TVC:DXY Warning Zone: Commodities & IT on Alert
DXY has completed a bullish harmonic pattern and is holding strong support near 97.70 a critical medium-term demand zone.
As long as DXY stays above 97.50, the bias remains sideways to mildly bullish with upside potential toward 99.00–100.40.
A decisive breakdown below 97.50 would shift the medium-term trend to bearish, opening room toward 96.20.
🧭 Medium-Term Market Impact
🟡 Gold & Silver
Likely to face resistance and consolidation if DXY rebounds
Strong upside only if DXY slips below 97.5
🛢️Crude Oil
Medium-term pressure remains
Dollar stability keeps crude range-bound to weak
🔩 Metals (Steel, Copper, Aluminium)
Dollar strength = limited upside / corrective phase
🇮🇳 Indian Equities
Positive: Banks, FMCG, OMCs, consumption themes
Cautious: Metals, commodity exporters
IT: Neutral → weak unless DXY breaks down
🔑 Medium-Term Takeaway
📍 Dollar at structural support.
➡️ Hold above 97.5 → risk-off for commodities
➡️ Break below 97.5 → commodity & IT rally
This setup is important for Jan–Feb positioning.

XAUUSD ANALYSISI have market the possible wave count as per my analysis we can see new high in upcoming months before new high we can see 10 percent correction in gold in upcoming days this is simple correction all metals are bullish as per my analysis. i am attaching last analysis of gold also.
Thanks
Ishu Prajapati

XAUUSD ANALYSISI am posting a chart of XAUUSD this is the possible outcomes of the wave as per myview
3rd wave is completed and the current xauusd is in correction we can see abc correction on longterm as per trukit last wave now we can see trendline liquidity is need to be taken and in upcoming days we can see gold around 3820 from we can see 4-5wave as per my view.
Thanks

XAUUSD (H1) – Friday Weekend
Lana prioritizes the adjustment phase towards the POC area, looking to Sell in the liquidity zone 💛
Quick Summary
Context: Friday, the market often tends to take profits and sweep liquidity before the week closes
Monitoring Frame: H1
Main Viewpoint: Prioritize a decrease during the day (adjustment phase)
Key Point to Note: 4308 has reacted multiple times, a sensitive point in the structure
Market Context
The weekend is usually a time when the cash flow is “lighter” and price behavior tends to lean towards profit-taking. Therefore, an adjustment phase to gain more liquidity is the scenario Lana prioritizes today.
From a medium-term perspective, some large institutions still maintain a positive view on gold. However, in intraday trading, Lana still prioritizes following the current price behavior and trading according to the liquidity zone.
Technical View H1
On H1, the price is fluctuating around the accumulation zone, and the POC/VAL area indicates this is a market zone that has been “back and forth” for quite a while. When the price returns to these areas, there is usually a clear reaction.
The 4308 area is noteworthy because the price has reacted multiple times, so this is a point that could determine whether the adjustment phase continues.
Today's Trading Scenario
Main Scenario – Sell at POC/VAL area (large liquidity)
Sell: 4335 – 4340
Lana prioritizes waiting for the price to rebound to this area to sell according to the adjustment phase. This is a large liquidity zone, suitable for finding a downward reaction during the day.
Alternative Scenario – Buy scalping at near support
Buy: 4284 – 4289
This Buy order is only for scalping when the price hits the support area and a bounce reaction appears. If the market continues to be weak, Lana will not hold the Buy for too long.
Session Notes
If the price continues to be rejected around resistance areas and cannot surpass the supply zone, the adjustment scenario will have an advantage.
For Friday, Lana prioritizes light trading, quick closing, avoiding holding positions too long over the weekend.
Lana's Notes 🌿
Each scenario is just a probability. Lana always sets a stop loss first, chooses the appropriate volume, and is ready to skip if the price does not reach the waiting area.

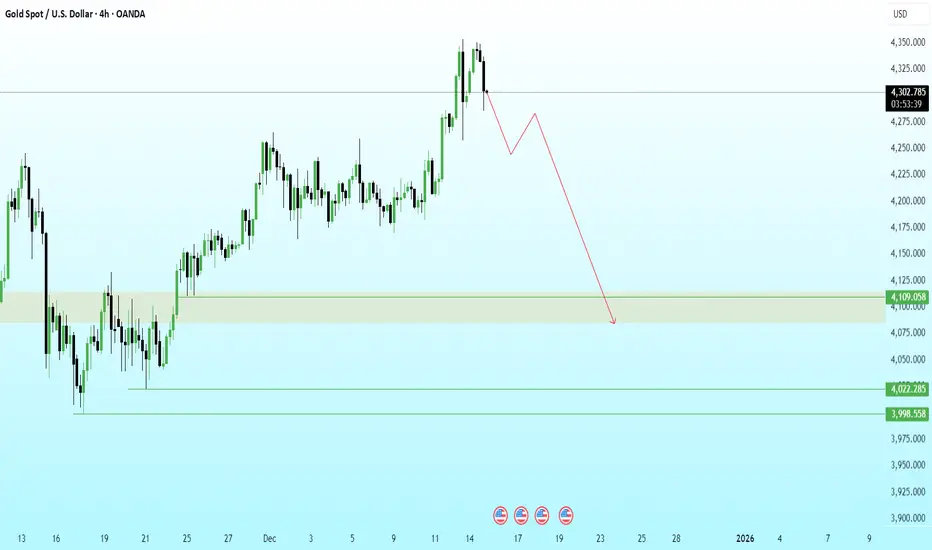
GOLD 4H | Liquidity Harvest Done… Now the Slide BeginsPrice engineered liquidity above the previous swing high and immediately delivered a sharp rejection, confirming a buy-side liquidity grab and the start of distribution.
Structure has now shifted bearish with a clear BOS from the premium zone. I’m expecting a mitigation leg before continuation lower.
The draw on liquidity sits inside the 4100–4080 demand imbalance, which aligns with unmitigated bullish orders from the prior accumulation phase.
If 4100 fails to hold on mitigation, the next liquidity pools rest at:
4022 (clean sell-side pocket)
3998 (final downside liquidity target)
GOLD ShortGold (XAUUSD) Trade Recap 🟡
Entry: 4338.00
Stop Loss: 4348.00
Target: 4275.00
Position: Sell
Risk: Fixed & defined
Outcome: Running / Planned execution
Clean execution. Levels respected. Trade managed as planned.
#XAUUSD #GoldTrade #TradeRecap #ForexTrading #TradingView #RiskManagement

XAUUSD Short | 15m |Gold revisited the upper band of the intraday structure and showed clear signs of weakening momentum. Price failed to sustain above the model’s trailing zone, indicating a shift from short-term accumulation to distribution.
The short entry was executed as price broke back below the cloud, supported by a clean loss of intrabalance strength.
Stop is placed above the most recent structural failure.
Primary target sits near the liquidity cluster around 4175.

Gold sell target as per your return you want so im selling this selling gold right away so can get some targets
becuase its pre LDN sell off so taking a 1.5% risk of capital

Resistance Rejection → Bearish Pullback Toward Support🟡 GOLD (XAU/USD) – Bearish Rejection from Major Resistance 🟥📉
🔍 Key Technical Insights
Price rejected the major resistance zone around 4,245 – 4,255
Rising Support Line has been broken → signals weakening bullish momentum ❌
Current structure favors a pullback toward demand area
Market seeking liquidity below recent swing lows 💰
🎯 Suggested Targets (with stickers)
Target Type Price Area Sticker
TP1 → Support Retest 4,210 – 4,215 🎯
TP2 → Demand Zone 4,195 – 4,205 📉💰
📌 TP1 is your high-probability target
📌 TP2 is for extended move if bearish momentum continues ⬇️
📌 Trade Setup Idea
📍 Sell Entry Zone:
➤ 4,238 – 4,245 (after failed breakout)
🎯 Take Profit:
➤ TP1: 4,215 🎯
➤ TP2: 4,200 📉💸
🧭 Overall Market Outlook
Factor Bias
Short-term Trend Bearish Pullback 🔻
Liquidity Downside targets in focus 💧
Resistance Reaction Strong rejection 🚫

GOLD DAILY TRADING 17/11: BUY TODAY🦁 THE GOLDEN ARENA – 17 NOV, 2025
“Rebound or Trap? Let the Orderflow Decide.”
A visually striking TradingView plan – part narrative, part tactical map. This is not just a bias, it’s a battlefield strategy.
🧭 MARKET CONTEXT SNAPSHOT
Price currently consolidating around 4076 – 4084, after clean breaks of structure (BOS) and a deep retracement.
Significant supply zones confirmed at 4157 – 4180, where POC clusters, FVG imbalances, and volume absorptions align.
Orderflow on M5–M30 shows fading buy pressure and aggressive sells into lower highs.
🎯 CORE STRATEGIES FOR TODAY
🔺 Scenario 1: Breakout Trap SELL (High Conviction)
Target Zone 4178 – 4180 (Main Supply)
Stop Loss (SL) 4185
Take Profit 1 (TP1) 4155 (Low volume node)
Take Profit 2 (TP2) 4100 (Local support)
Take Profit 3 (TP3) 4040 (Structural SSL level)
🔍 Why this setup?
Clear liquidity pool above 4178 being targeted.
Volume tapering off into the move → classic reversal signal.
Footprint shows absorption candles at key supply.
🪙 Scenario 2: FVG Scalping SELL (Secondary)
Entry Zone 4157 – 4158
SL 4163
TP 4100 – 4105
✅ Perfect for short-term scalpers looking to ride the intraday rejection from the imbalance zone.
🟢 Bullish Reversal INVALIDATION (Failsafe Plan)
Trigger Break and hold above 4185
Entry Breakout Buy above 4190
SL 4175
TP 4220
Only flip bullish if aggressive buyers step in + strong delta + profile breakout.
🧱 KEY PRICE ZONES TO MONITOR
Level Description
4185 Stopline – invalidates Sell
4178 – 4180 Main SELL Zone (POC + FVG)
4157 – 4158 Minor FVG Scalping Area
4100 Micro support + Bull trap
4040 SSL – liquidity target
📊 VOLUME & ORDERFLOW INSIGHT
M5–M30 Footprints:
Massive seller imbalances from 4175+
Footprint at 4084 shows buyer exhaustion
Volume Profile:
High-volume node at 4178 acting as strong resistance
Low-volume gap below 4155 → fast price travel zone
Delta:
Negative delta buildup confirming sell bias
💡 EXECUTION CHECKLIST
✅ Wait for entry trigger at marked zones – don’t pre-empt.
🚫 Avoid FOMO buy into supply unless 4185 is cleanly broken.
🔔 Set alerts at 4157 and 4180 for rejection signs.
🧠 TRADING MANTRA OF THE DAY
"The chart speaks in structure,
The volume whispers the truth,
But the orderflow shouts the conviction."
📌 Bias: SELL on retracements toward supply → hold for 4100–4040
📌 Watchlist: Footprint aggression, absorption blocks, spoof traps

LiamTrading – XAUUSD H1 | Two scenarios for the new weekLiamTrading – XAUUSD H1 | Two scenarios for the new week: wait for reactions at 4100 & Fibonacci zone – prioritise bullish trades when the market recovers
Gold is completing a technical rebound after a sharp drop, and H1 is showing two clear scenarios for the new week. The medium-term trend remains a corrective decline, but on H1, the price is in a rebound phase, so bullish trades will be prioritised – as long as the lower liquidity zones are maintained.
The key this week lies at 4100, where FVG, Fibonacci, and liquidity converge – this is the decisive point to see if gold will bounce back or continue to decline deeply.
🔍 Technical Analysis (Fibonacci • Trendline • Liquidity • Volume Zone)
Fibonacci H1: The price may rebound to Fib 0.5 (~4140–4150) – a zone with high liquidity & likely to show a bearish reaction.
Fib 0.382 (~4120–4130) is currently the first short-term resistance.
Price Structure: The medium-term downtrend is still present, but H1 is forming a rebound wave → prioritise buying when the price pulls back at the support zone.
The descending trendline is still controlling the market. If it breaks the trendline + holds above 4130–4150 → the uptrend is confirmed stronger.
Important liquidity zones:
4100: liquidity confluence + previous bullish resistance → strong reaction zone.
4085 and 4060: liquidity bottoms – if breached, it will trigger a deep decline scenario.
4032: FVG + Fibonacci bottom – the "break or hold" zone for buyers.
Key resistance this week: 4161 – 4187 – 4138 – 4111
📈 TRADING SCENARIOS FOR THE NEW WEEK
Scenario 1 – Bullish trade (priority)
Logic: Gold is rebounding; if it holds 4100 and pulls back strongly → target is the upper Fibonacci zone.
Entry: 4100–4111
SL: 4090
TP: 4138 → 4161 → 4187
Suggestion: Wait for strong signals like pin bar or engulfing H1 to confirm the rebound bottom.
Scenario 2 – Bearish trade (when the market fails to hold the bottom)
Logic: If gold breaks the H1 bottom and retests 4100 without holding → the medium-term downtrend continues to activate.
Entry: 4100–4108 (retest after break)
SL: 4120
TP: 4085 → 4060 → 4032
Suggestion: Only enter when H1 closes below 4100.
🌍 Macro Analysis – Fed causes market noise
According to the latest data from CME Watch:
54.1% chance the Fed maintains rates at 375–400 bps
45.9% chance the Fed cuts rates
The ratio is almost balanced → the market is very indecisive, creating unpredictable volatility ahead of the 10/12 meeting.
In this environment, gold often reacts strongly to unexpected news, so prioritise trading at liquidity zones – wait for clear confirmation.
⚠️ Invalidation Conditions
Price closes below 4060 → fully prioritise bearish trades.
Price closes above 4161 → strong bullish trade activated, discard all sell setups.
What scenario are you preparing for the new week?
Please comment & hit Follow on LiamTrading channel to receive the earliest analysis every day!

XAUUSD – H4 SCENARIO FOR THE WEEK 17–21/11 💛 XAUUSD – H4 SCENARIO FOR THE WEEK 17–21/11 🎯
🌤 1. Overview
Hello everyone, it's Lana here again 💬
The new week begins with a narrowing trading range on the H4 chart, signalling that gold is preparing for a more significant move. The current medium-term trend needs to break the descending trendline above to confirm the return of the buyers.
💹 Technical Analysis
📉 The end-of-week downtrend is entering a technical rebound phase and is likely to continue declining towards the 4000 trendline – a confluence with a strong liquidity zone.
🟣 Key price levels to watch include: 4138 – 4200 – 4212 – 4037. These are liquidity concentration points, expected to have a clear reaction according to market sentiment.
🔹 Traders can use Fibonacci retracement to spot selling entry points, combined with confirmation signals on smaller time frames (M15–M30).
🌐 Macro Context
The financial market is facing difficulties as US tax policies change continuously, putting pressure on both Gold and Bitcoin.
The end of the year is also a characteristic phase of the economic slowdown cycle, where the market tends to adjust more strongly.
🎯 Reference Trading Scenario (Reference Trading View)
Priority is given to selling according to the technical rebound, especially when the price enters the confluence Fibo + liquidity zones.
Buying is only considered when the price reacts strongly at the 4000 trendline or the 4037 zone.
🌷 6. Conclusion with LanaM2
Gold is in a zone preparing for a big move 💛
Be patient and wait for reactions at important liquidity zones to have a better and safer entry point.
If you find it useful, please 💛 Like – 💬 Comment – 🔔 Follow LanaM2 to receive daily gold analysis! ✨

BTC is forming a 3R sell scenario.....BTC is in downtrend in daily timeframe and shown sniper delivery, now it is in pullback mode. We may anticipate a good short term trade around 102000 RDRB level
1. Price is continuously crating BOSs..
2. Sniper deliver is already done and price is pulling back slowly.
3. RSI has already shown bearish divergence on hourly TF.
4. Most probably price will take liquidity of FVG/RDRB level and create MSS/CISD/TS/iFVG in LTF.
5. Price should show rejection/reversal in respective LTF (5m/15m) at FVG zone.
6. Take the trade only once clear entry model i.e. turtle soup. iFVG break, CDS or MSS happens on LTF
All these combinations are signalling a high probability and ~8R trade scenario.
Note – if you liked this analysis, please boost the idea so that other can also get benefit of it.
Also follow me for notification for incoming ideas.
Also Feel free to comment if you have any input to share.
Disclaimer: This analysis is for educational purposes only and does not constitute investment advice. Please do your own research (DYOR) and check with your financial advisor before making any trading decisions.

Gold (XAUUSD) – Bears Eye the 4000 Wall! Short Setup AheadGold is currently trading within a tight range of 3990 – 3960, and price action is now approaching the crucial resistance zone at 3990 – 4000.
📈 This area has acted as a strong supply zone in recent sessions — and could once again attract sellers.
💡 Trading Plan:
🔸 Sell Zone: 4000 – 4003
🎯 Targets: 3990, 3980 and 3970
🛑 Invalidation: View remains valid below 4012 — a sustained break above this level would negate the short setup and could open the door for further upside momentum.
📊 Bias: Bearish near resistance until confirmed breakout above 4012
💬 Watch for rejection signals or bearish candles in this zone before entering.
⚠️ Disclaimer
This is for educational purposes only — not financial advice. Always manage your risk and use proper position sizing.
Your feedback drives our content and keeps everyone trading smarter. Let’s make those pips together! 🚀
Happy Trading,
– The InvestPro Team

Gold (XAUUSD) – Bears Eye the 4045 Wall! Short Setup AheadGold is currently trading within a tight range of 3980 – 4045, and price action is now approaching the crucial resistance zone at 4035 – 4045.
📈 This area has acted as a strong supply zone in recent sessions — and could once again attract sellers.
💡 Trading Plan:
🔸 Sell Zone: 4035 – 4045
🎯 Targets: 4021 and 4012
🛑 Invalidation: View remains valid below 4051.5 — a sustained break above this level would negate the short setup and could open the door for further upside momentum.
📊 Bias: Bearish near resistance until confirmed breakout above 4051.5
💬 Watch for rejection signals or bearish candles in this zone before entering.
⚠️ Disclaimer
This is for educational purposes only — not financial advice. Always manage your risk and use proper position sizing.
Your feedback drives our content and keeps everyone trading smarter. Let’s make those pips together! 🚀
Happy Trading,
– The InvestPro Team

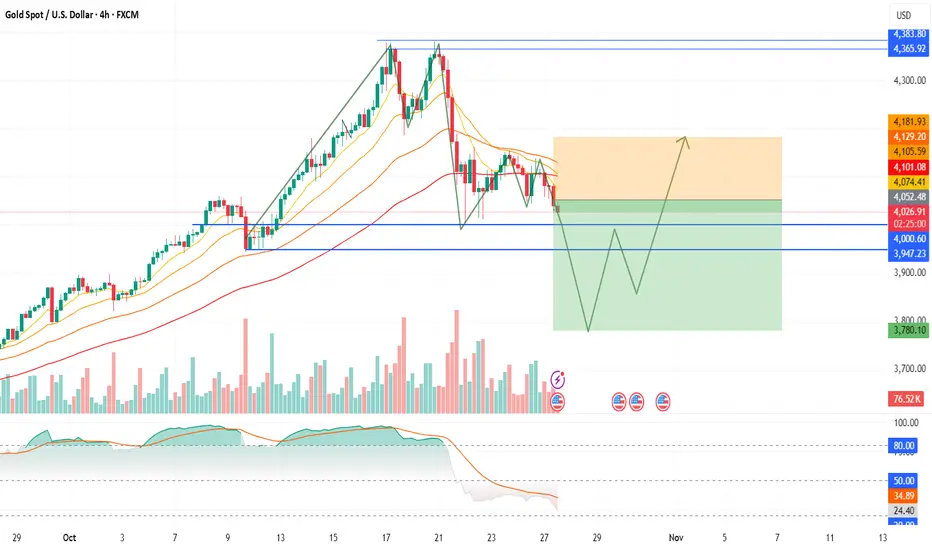
Dual-phase trading — shorting the drop, then switching to long Gold is currently trading near $4,040, and my short-term outlook is bearish, followed by a strong bullish reversal in the coming sessions.
I expect prices to decline first toward the $3,800–$3,750 zone, which aligns with key support and previous demand levels. This correction phase would complete a healthy market reset before a potential major rally begins.
Once price stabilizes around $3,800, I anticipate a sharp reversal and breakout move toward $4,200+, possibly extending higher if momentum builds.
📊 My Plan:
Bias: Bearish first → then Bullish
Short-Term Target: $3,800–$3,750
Reversal Zone: Accumulate longs near $3,800
Upside Target: $4,200+
Invalidation: Below $3,740 (on 4H closing)
This setup favors patience and dual-phase trading — shorting the drop, then switching to long for the rebound.