Inflation Cools, Gold Heats Up Inflation Cools, Gold Heats Up
In June, the United States inflation fell to 3%, which is the lowest since March 2021. This was slightly below the market's expectations of 3.1% and a significant decline from May's rate of 4%. Additionally, the core inflation rate unexpectedly dropped to 4.8%, marking its lowest level since October 2021.
The implication of this deceleration is that it could prompt the Federal Reserve to scale back its plans for interest rate hikes. With inflation showing signs of cooling, the central bank may now be inclined to raise rates only once more throughout the remainder of the year.
In the wake of the inflation report gold prices shot up, soaring by more than 1.3%. The metal breached the $1,940 resistance level but fell just short of clearing the $1,960 overhead barrier. If further upward momentum materializes, it could pave the way for a potential retest of $1,975 and $1,980.
At the same time, the US dollar faced a steep decline, sinking to its lowest point in over 14 months. Against the Swiss franc, it tumbled to depths not witnessed since early 2015, settling at 0.8673 francs, down 1.4%. Earlier in the session, it even touched 0.8660, marking its weakest position since the Swiss National Bank abandoned the Swiss currency peg back in January 2015. Against the Japanese yen, the dollar hits a six-week low of 138.47 yen, witnessing a 1.4% decline. Additionally, the US dollar weakens by more than 1.5% against the New Zealand and Australian dollars. Conversely, the euro surges to its highest level since March last year, reaching $1.1125. The Euro trades up 1.2% at $1.113.
Goldshort

XAU/USD 1:3.5 TradeFundamentally USD is Going to Be Super Strong because of upcoming positive events for USD
which is not good For XAU/Gold

#XAUUSD 🔴 M15. Sell (Gold). Global Imbalance
A Global Level of Imbalance (H1) has formed. (+)
An imbalance of M15 has formed at the upper boundary of the H1 Range. (+)
The price is higher than the market opening. (+)
Resistance is the zone of imbalance of the open interest of stock options. (+)
input: 1927.43 (input on imbalance test)
stop: 1931.02
tp-1: 1923.81
tp-2: 1916.52

GOLD LONG IDEAGOLD ANALYSIS:
GOLD has been one of the most considered safe havens against the fall of the USD.
Most investors turned to consider GOLD as a safe haven due to the following factors:
The CORE PCE fall as expected on Friday where which indicates that FED will not put more effort into tightening since the stubborn inflation is coming close to the target.
FED may pause rate hikes this year (2023) because inflation is on hand and coming closer to the target which is 2%.
Technically and for the longer term GOLD is bearish however the current bullish waves gave room for us to closely look at important zones where we have 1893.
The price has bounced from the area level now 1893 and 1911.722 because traders found the area as 61.8 Retracement of the current high around 1922.689, hence there may be a correction from this level back to 1904.293 which will definitely be our entry zone.
Technically GOLD turns bullish for the short term where an inverted H&S formed and its neckline was broken above, our entry for the broken neckline of inverted H&S will exactly be the same level of 61.8 Retracement level of the current high which is 1904.770.

GOLD 27/6 ? Bulls or bears prevail Investors will be closely watching the upcoming speeches by top central bank officials, including Christine Lagarde, Andrew Bailey, Jerome Powell, and Kazuo Ueda. These speeches will provide valuable insights for investors. Additionally, on Tuesday, important US economic indicators such as Durable Goods Orders, the Consumer Confidence Index, New Home Sales, and the Richmond Manufacturing Index will be released. These indicators will likely impact the price of gold. Despite concerns about a potential recession, the downside for gold prices seems limited due to its status as a safe-haven asset.
Today, Gold price is still around the $1925 mark, showing signs of moving towards the $1935 price zone
Set up SELL zone at :$1933 -$1935 sl 1945
Based on the technical analysis indicator resistance zone at $1935, combining 2 moving averages EMA 34 and EMA 89

Powell hints at 2 more hikes, sends gold lower Powell hints at 2 more hikes, sends gold lower
The US dollar rose on Wednesday after the gathering of central bank leaders worldwide, which included Federal Reserve Chair Jerome Powell. During the meeting, Powell left open the possibility of the Federal Reserve implementing two more rate hikes this year. Furthermore, Powell stated that he does not anticipate inflation reaching the Federal Reserve's target of 2% until the year 2025.
However, investors might be hanging onto the words of Powell a little too tightly considering his central bank counterparts in the ECB and BoE presented more hawkish remarks (natural for the stickiness of inflation that these regions are facing). Christine Lagarde emphasized that the European Central Bank (ECB) remains unconvinced by the available evidence inflation is falling in the Euro Area. A revision by investors might be in order.
With the rise in the USD, we are also seeing selling pressure in the XAU/USD for a third straight day.
Currently, gold is hovering around $1,909 and maintaining a bearish outlook, with the potential to breach the $1,900 level. The daily chart reveals that the precious metal has dropped further below both the 20 and 100 Simple Moving Averages, which are currently converging at $1,943.
Among the current levels, $1,875 perhaps stands out as the most significant support level. Despite previously acting as a resistance point, it has served as a pivot on multiple occasions.

GOLD SHORTShorting Gold on 15 min frame 1:5 ratio in every trade as usual. SL & Targets are on charts. I have found FIB retrace tool for my targets & SL

GOLD 08/06/2023 Bears have the upper handTVC:GOLD price seesaws around the intraday high as it prints slight gains after dropping the most in a week the previous day. Even so, TVC:GOLD remains indecisive on a weekly basis as markets struggle to find clear direction amid a blackout ahead of the Fed and mixed feelings on growth concerns Global.
Organization for Economic Co-operation and Development (OECD) flagged concerns about a weak global economic transition amid higher interest rates and spurred buyers of TVC:GOLD , especially after a rate hike surprise rates from central banks in Australia and Canada. However, the easing of concerns about the Federal Reserve (Fed) rate hike by 0.25% in June contrasts with the possibility of a rate hike in July to underpin the Gold Price rally towards the end. year.
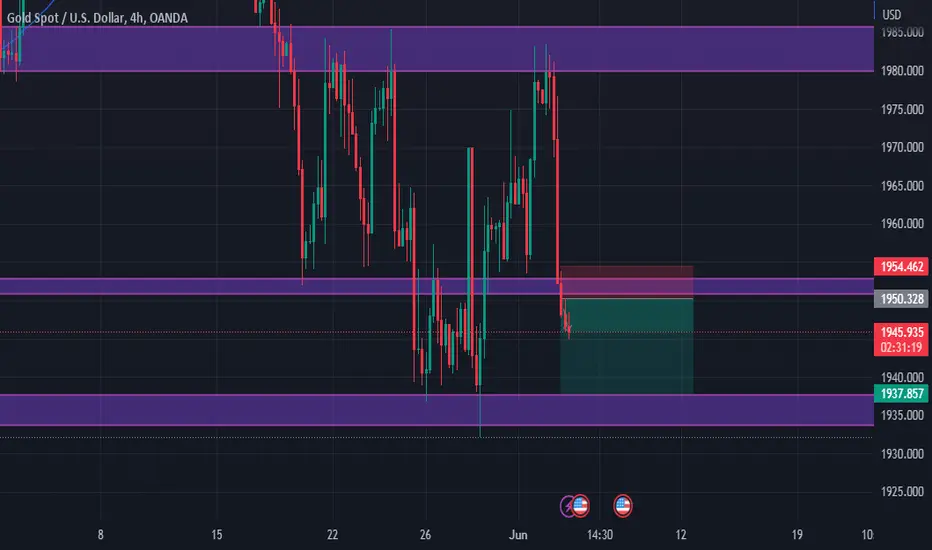
SELL GOLD zone 1953 - 1955
Stop Loss : 1958
Take profit1 : 1948
Take profit 2: 1940
Take profit 3: 1935
Note: Installing TP SL fully wins the market and is safe in trading

GOLD 1:3 TradeGold Powerful 1:3 Trade
= Down Trend
= breaking their Support
= Price below the 200 EMA
= Positibe news For USD Coming soon (Bad for Gold)
= Proper Price action
NFP report: How Will it Shape the Gold Trend?NFP report: How Will it Shape the Gold Trend?
Gold prices experienced a rise on Tuesday and Thursday (sideways on Wednesday), driven by traders' expectations of another interest rate hike by the US Federal Reserve. But is the medium-term downtrend really over?
One fundamental indicator that can help answer this question is the nonfarm payrolls, due to be released this Friday (US time). Any unexpected outcomes could lead to heightened volatility in rate-sensitive assets such as gold.
Market projections indicate that the upcoming nonfarm payrolls report for May will show a slowdown in job additions to the economy, with 190,000 jobs compared to the 253,000 jobs added in April. Interestingly, the forecast for the previous month was also around 190,000 jobs.
The nonfarm payroll data serves as the final key indicator ahead of the release of inflation data on June 14 and the concurrent interest rate decision from the Federal Reserve.
Market sentiment currently suggests a 60% probability of a 25 basis-point interest rate hike during the Federal Reserve's upcoming June meeting, compared to a 26% chance observed a week earlier. If implemented, this would mark the central bank's 11th consecutive rate increase.
Gold was trading around $1,932, reaching its lowest level since March 17 before its incline began on Tuesday. While Thursday was a positive day for the metal, it still retraced about half of its gains on the day and now trades at approximately $1,960. It peaked at $1,974, which is the most immediate resistance level but without much historical precedence. Considering the NFP is still two days away, this level might become irrelevant.
$1,985 is a level with more medium-term precedence but will have to wait until closer to the release of the data to tell if this level is something that needs to be watched. If gold turns to the downside, it might pay to keep an eye on $1,938 as a support level.

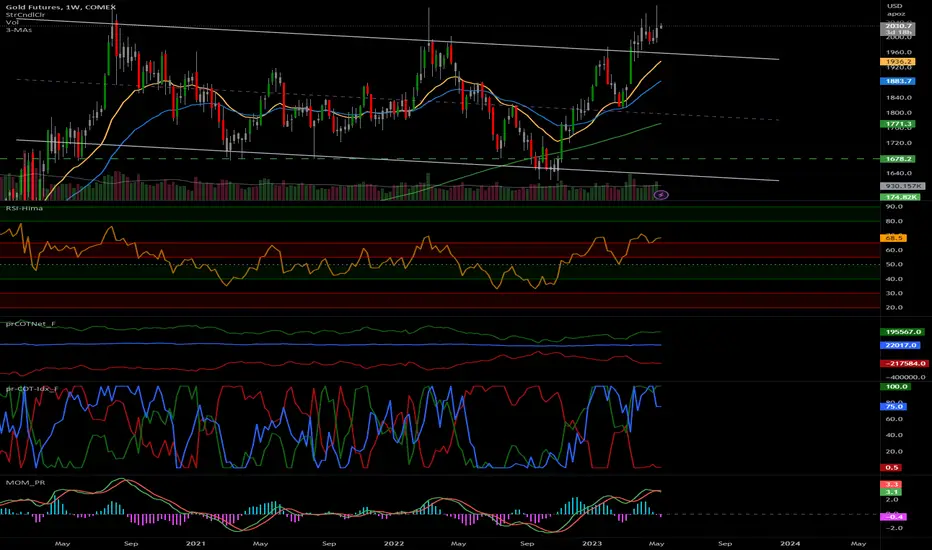
Gold - Probable Short TradeWith Bearish COT Reports AND Weekly momentum down - Gold can be a short between 2030 to 2050 with a stop- of 2091 and a target of 1830-1875. My only concern is positive Daily Momentum. So strictly Stoploss Please
GOLD SELL FROM 2044 to 2019.The price was expected to drop as the 2055 area was retested before. Easy break out sell and now waited for NEWS volume to do the rest.

Preparing for the Worst: Trading Ahead of a US Debt Default"It is impossible to predict with certainty the exact date when Treasury will be unable to pay the government's bills," Treasury Secretary Janet Yellen said in a letter to Congress. Although Yellen noted a tentative date of June 1 as the due date to help spur lawmakers into action.
While it is highly unlikely that the US will default on its debt, this doesn’t mean that the traders won’t make plans to deal with a default or get jittery. Two likely markets that will have to deal with the moves from these investors will be forex and gold.
If uncertainties about an unprecedented potential U.S. debt default persist, the US dollar might lose some of its safe haven status which would possibly shift to gold.
US President Joe Biden plans to meet with House Democratic leader Hakeem Jeffries, Senate Majority Leader Chuck Schumer and Republican leader Mitch McConnell on May 9. This will be a key date to watch the US dollar and gold in case the group come to some kind of agreement to increase the debt ceiling.
With the US being the bedrock of the whole world’s financial system, we might also expect to see investors' jitters manifest in offshore-based assets too. Other safe havens such as the Japanese yen, the Swiss franc, and particularly the euro might be prime candidates for inflows.

GOLD short to 2020 with news coming. GOLD should drop to 2020 with news coming and also the 4hr candle can flip bearish but only if it respects the high of 2046.

EXPECTED GOLD TO REACH 2030. area to further go up.The FOMC move happened pretty absurdly. I believe Asian and london sessions should push GOLD down to grab liquidity then it can go up in the NY session.

Gold or XAUUSD analysis Gold or XAUUSD analysis
Symbol: Gold or XAUUSD
Time frame: 4 hours
Analysis: Presently we can observe divergence, SO, we can expect downtrend movement up to 1870 but in case if the price crosses above the parallel channel with high volume and in MACD, if the price crosses above zero, then, we can expect target up to 1230.
HOPE our analysis is adding value to your Trading Journey.
NOTE: Published Ideas are for ‘’EDUCATIONAL PURPOSE ONLY’’ trade at your own risk.
NOTE: RESPECT The risk. SL should not be more than 2% of the capital.
Happy Trading

XAUUSD GoldOANDA:XAUUSD
As you can see that gold has created channel and if it breaks the drawn level tomorrow (Monday- 17-04-23) and gives pullback then we can take entry at sell side. plan your trade accordingly...

XAUUSD GoldOANDA:XAUUSD
GOLD has formed Double top pattern and if Monday it retest neck line and goes down then we can plan for sell side. plan your trade accordingly...

Sell Gold Target 1910After Fed data along with Euro, Gold has also turned bearish. as per wave theory Gold is expected at 1910 before friday eod !

XAUUSD GoldOANDA:XAUUSD
XAUUSD Gold we can plan for selling side because major support breakout happened and take pull back entry. plan your trade accordingly.

Job Loss Claims Even Incresed Compare to Lost WeekGold is consolidating..! I am sell with Tight SL. Its a fakeout when US session open. Lets see. Setiment or Fundamentals.

Short - Gold weekly basis + ichimoku stretagey
looking for target 54000 in gold
a confirm 1000-1500 fall from current level
stay short
disclaimer - trade @ own risk

Gold downward movement . Target expected is 1820/1816Time Frame 30 Minutes.
Gold price is below the Moving Average 20 and 40 with RSI below 80. So we can expect a Target of gold 1820/1816
NOTE: Published Ideas are for ‘’EDUCATIONAL PURPOSE ONLY’’ trade at your own risk.
NOTE: RESPECT The risk. SL should not be more than 2% of the capital.
Happy Trading
