Pullback Into Resistance, Sell-the-Rally Setup
Market Structure
Overall structure is bearish-to-range after a strong selloff.
Price made a rounded bottom from the Feb lows, then transitioned into a corrective rally.
The rally is retracing into a prior supply / resistance zone, not breaking structure yet.
Key Zones
Major Resistance / Supply: ~5,100 – 5,213
Marked clearly on your chart.
Previous breakdown zone → now acting as resistance.
Minor Resistance (Entry Zone): ~5,050 – 5,105
Price is currently reacting here.
Prior support turned resistance (classic S/R flip).
Support: ~4,650 – 4,700
Strong demand zone.
Previous reaction + liquidity pool.
Intermediate Support: ~4,905
Likely first pause or bounce area if rejection starts.
Price Action Story
The white path shows a corrective ABC-style move into resistance.
Momentum on the way up is weaker compared to the selloff (bearish sign).
No clean bullish break-and-hold above the resistance zone yet.
This favors a rejection rather than continuation.
Trade Idea (As Illustrated)
Bias: Short
Entry: Into 5,050 – 5,100 resistance
Invalidation: Clean 1H close and acceptance above ~5,213
Targets:
~4,905 (partial / scale-out)
~4,650 (main target / demand zone)
What Would Flip This Bullish?
Strong impulsive break above 5,213
Followed by a successful retest and hold
Until then → rallies are suspect.
Summary
This is a sell-the-rally setup into a well-defined resistance zone, aiming for a move back into demand. The chart is structured, levels are respected, and the risk is clearly defined — exactly how you want it.
Goldtechnicalanalysis

XAUUSD | 21/08/2025 Technical AnalysisHello,
Gold is create Same HH and moving HL pattern on daily timeframe. Soon we can see it moving towards ATH. One retracement is pending then we can see start of new uptrend move.
Disclaimer: This is only for educational purpose.
Thanks

XAUUSD | Technical Analysis for 08/05/2025Hi,
I am seeing a bounce up side in gold till 3365 to 3372. Corrective wave can start from here.
Disclaimer: This is only for educational purpose.
Thanks

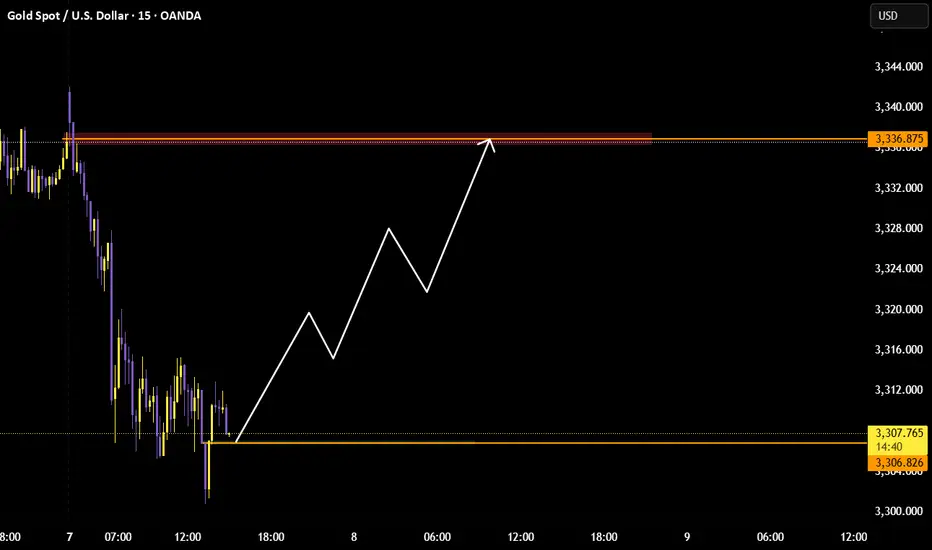
XAUUSD | Expected Swing Movement 07/07/2025Hi,
I am sharing my view on XAUUSD swing movement. After series of consolidation at current level. If gold breaks 3315 and retest the 3306 to 3308 with pullback, it can show sharp upside move upto 3336 to 3338 level where major we can see major supply.
Disclaimer: This is only for educational purpose.
Thanks
XAUUSD | Technical Analysis 9 June 2025Hi,
I have shared my view on how gold can follow the levels which I have shown in video. In long term view gold is in downtrend, but for short term in 1hr and 15mini it can retrace back upside.
Disclaimer: This is only for educational purpose.
Thanks

MCX Gold Price Limited Downside, Big UpsideMCX gold has started falling since 1st June, and it's moving under a parallel channel. But this time, it can break out this channel. Why? I will explain it through Elliott wave projection in the next update.
In the last trading session, it made a Doji candlestick. And that's a sign of trend change. If gold does not break the crucial level, then it can drop up to 0.382 to 0.236 .
In simple words, short-term targets: 46200 - 45960 - 45765
And for long-term traders: 45600 - 45060
But, the uptrend isn't far away. If gold does breakout of 46860 level, then we may see 47276 - 47600 - 47960+ .
Don't get confused! You have to watch out the level 46860 for an uptrend, and the closing price below the Doji candle indicated a bearish trend signal.
This week we may see higher fluctuations due to upcoming economic events. Watch the following significant releases or events that may affect the movement of gold, silver, crude oil, & natural gas:
Monday, Oct 04, 2021
15:30 OPEC Meeting - Medium Impact
Tuesday, Oct 05, 2021
19:30 ISM Non-Manufacturing PMI (Sep) - High Impact
Wednesday, Oct 06, 2021
02:00 API Weekly Crude Oil Stock - Medium Impact
17:45 ADP Nonfarm Employment Change (Sep) - High Impact
18:30 FOMC Member Bostic Speaks - Medium Impact
20:00 Crude Oil Inventories - High Impact
21:00 FOMC Member Bostic Speaks - Medium Impact
Thursday, Oct 07, 2021
18:00 Initial Jobless Claims - High Impact
20:00 Natural Gas Storage - Low Impact
Friday, Oct 08, 2021
18:00 Nonfarm Payrolls & Unemployment Rate - High Impact

Gold is going to retest 1840 and then 2100-2200Gold is showing some reversal pattern for retesting 1840. As per the chart, we can see that gold was following a perfect uptrend and now its reversal shows that it will retest 1840 and go for the long target (day time frame).
It took reversal by two very powerful chart reversal patterns named shooting star with confirmation & Bearish Engulfing pattern for retesting 1840.
trade is not recommended
show your love
comment your views
thanks

GOLD MCXOn the 4 Hourly Charts Gold MCX has Strong Support Zone around 49900-50000, As it was previous Channel Resistance now acting as support. We may see the uptrend resuming, On should follow strategy to buy on correction and Hold for investment with Stoploss below 49000 on closing basis.
