GOLD 26/6 $$ The bears are still dominant ?Friday’s rebound in gold prices came on the back of diminishing open interest and suggests that the continuation of the rebound appears unlikely for the time being. In the meantime, the yellow metal remains bolstered by the $1910 per troy ounce for the time being.
Today, Gold price still stays at $1920 - $1930
Can SELL zone at
SELL GOLD $1931- $1934, Sl 1944
According to technical analysis, the support zone $1910 support is quite strong, combine 2 moving averages EMA 34, EMA 89 so that the downtrend project still prevails.
Goldtrade

GOLD 27/6 ? Bulls or bears prevail Investors will be closely watching the upcoming speeches by top central bank officials, including Christine Lagarde, Andrew Bailey, Jerome Powell, and Kazuo Ueda. These speeches will provide valuable insights for investors. Additionally, on Tuesday, important US economic indicators such as Durable Goods Orders, the Consumer Confidence Index, New Home Sales, and the Richmond Manufacturing Index will be released. These indicators will likely impact the price of gold. Despite concerns about a potential recession, the downside for gold prices seems limited due to its status as a safe-haven asset.
Today, Gold price is still around the $1925 mark, showing signs of moving towards the $1935 price zone
Set up SELL zone at :$1933 -$1935 sl 1945
Based on the technical analysis indicator resistance zone at $1935, combining 2 moving averages EMA 34 and EMA 89

Powell hints at 2 more hikes, sends gold lower Powell hints at 2 more hikes, sends gold lower
The US dollar rose on Wednesday after the gathering of central bank leaders worldwide, which included Federal Reserve Chair Jerome Powell. During the meeting, Powell left open the possibility of the Federal Reserve implementing two more rate hikes this year. Furthermore, Powell stated that he does not anticipate inflation reaching the Federal Reserve's target of 2% until the year 2025.
However, investors might be hanging onto the words of Powell a little too tightly considering his central bank counterparts in the ECB and BoE presented more hawkish remarks (natural for the stickiness of inflation that these regions are facing). Christine Lagarde emphasized that the European Central Bank (ECB) remains unconvinced by the available evidence inflation is falling in the Euro Area. A revision by investors might be in order.
With the rise in the USD, we are also seeing selling pressure in the XAU/USD for a third straight day.
Currently, gold is hovering around $1,909 and maintaining a bearish outlook, with the potential to breach the $1,900 level. The daily chart reveals that the precious metal has dropped further below both the 20 and 100 Simple Moving Averages, which are currently converging at $1,943.
Among the current levels, $1,875 perhaps stands out as the most significant support level. Despite previously acting as a resistance point, it has served as a pivot on multiple occasions.


GOLD 27/6 $$$ Will the bears prevail now?Investors will be closely watching speeches by top central bank officials this week, including ECB President Christine Lagarde, BoE Governor Andrew Bailey, Fed Chair Jerome Powell, and Bank of Japan Governor Kazuo Ueda. These speeches will be given at a panel discussion in Sintra on Wednesday. Additionally, Tuesday's US economic releases, such as Durable Goods Orders, the Conference Board's Consumer Confidence Index, New Home Sales, and Richmond Manufacturing Index, will also be important in influencing the price of Gold. Despite concerns of a potential recession, the downside for Gold is expected to be limited due to its status as a safe-haven asset.
Gold price is currently trading around the $1927 mark, the momentary downtrend is taking up the majority
Can buy zone at:
BUY ZONE : $1910 - $1913
AND BIG BUY zone : $1903 - $1900 sl 1890
Analysis of moving averages EMA 34, EMA 89 with stiff support at $1900 to BUY

Gold looking bearish and has broken down from a consolidation Gold has broken down from the consolidation from the flag pattern. Bearish overhang on the commodity is likely to continue in the near future and we can see some more correction coming in. There were a lot of gold positional longs and they will perhaps have the trailing stop loss triggered, that can lead to some fast moves on the downside.

xauusd trade analysis by advanced high frequency trading bucksxauusd trade analysis with high reward , lets run the setup and watch it

#XAUUSDThis can be a good buy entry. This is #smc based & multi confirm entry based, but You take your entry only after multiple confirmation And do take care of your risk management.

a short explanation on the commodities and setupsA short video on the gold and silver after the fall yesterday and looking at the longer term time frame to understand the key levels. Gold has been the worst performer while the rest are actually looking bullish. Silver has been outperforming gold and that is something that we need to be aware of as it is also used in the industry. Overall the base metals and silver seem to be doing better than gold. The news from bank of canada increasing the rates did not sit well with the market with both gold and silver falling immediately after that. Anytime we have the yields go up the metals and other investment instruments which are assets without any yields underperform and become unattractive comparatively.

GOLD Hourly Breakout ready for 2% upmoveGOLD Hourly breakout is confirmed from down trend ... Targets will be 2-3% upside in coming 5-8 days
LTP - 60000
SL - 59600
Targets - 60800 to 61500
Time frame 2 weeks.

XAUUSD GOLD TECHNICAL ANALYSIS FOR UPCOMING MARKET EVENTS XAUUSD Technical Analysis
Strong support: 1939 / 1914.
Strong resistance: 1954 / 1965
Gold is testing sideways range support and several scenarios could develop from here. You have to be prepared for each one.
It is forming a triangle pattern. A decline in the dollar will strengthen our gold.
The moving averages indicate that consolidation is forming. If there is not a strong pullback upwards, in the medium term we should expect a fall in price along the trend
If the dollar goes down and forms a correction, gold will strengthen to 1965 and possibly to 1984, but if the dollar continues to rise after exiting the triangle, gold will start another decline to 1914.

GOLD 08/06/2023 Bears have the upper handTVC:GOLD price seesaws around the intraday high as it prints slight gains after dropping the most in a week the previous day. Even so, TVC:GOLD remains indecisive on a weekly basis as markets struggle to find clear direction amid a blackout ahead of the Fed and mixed feelings on growth concerns Global.
Organization for Economic Co-operation and Development (OECD) flagged concerns about a weak global economic transition amid higher interest rates and spurred buyers of TVC:GOLD , especially after a rate hike surprise rates from central banks in Australia and Canada. However, the easing of concerns about the Federal Reserve (Fed) rate hike by 0.25% in June contrasts with the possibility of a rate hike in July to underpin the Gold Price rally towards the end. year.
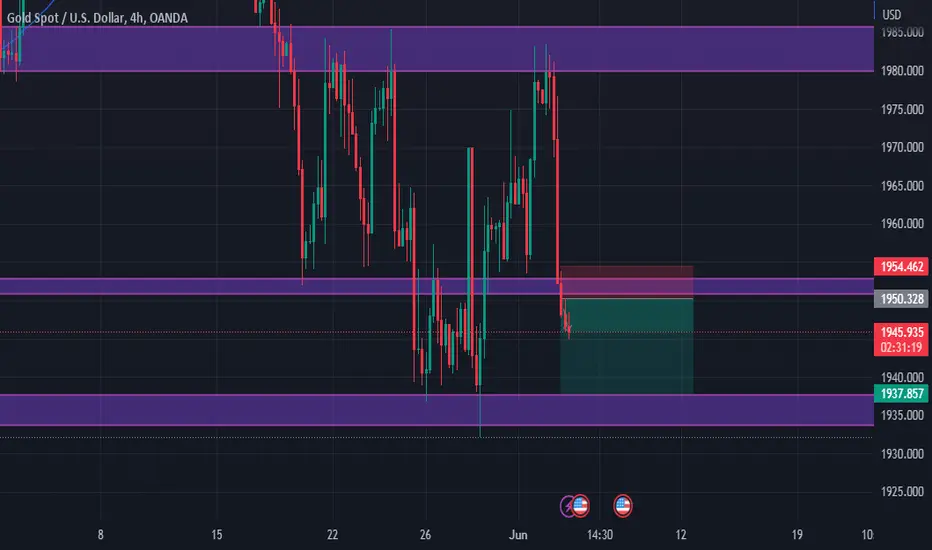
SELL GOLD zone 1953 - 1955
Stop Loss : 1958
Take profit1 : 1948
Take profit 2: 1940
Take profit 3: 1935
Note: Installing TP SL fully wins the market and is safe in trading

Do you think gold will rise today?The price of gold rebounded after hitting a low point not seen in over two months.
This was due to the recent data showing that the US services sector had experienced minimal growth in May, which halted several months of strong market growth.
The weakened dollar was also beneficial to metal markets, with gold being a safe-haven asset.
However, it is expected that US interest rates will remain high this year, limiting the potential for significant gains in metal prices.
Despite this, it is possible that the value of gold will increase later in the year as the US economy weakens.
In general, in the short term, Gold can still maintain its upward momentum, if the 1950-1940 price zone can still hold the bears. Then it's not a difficult thing to crawl back to 1975 or even 1985

GOLD 1:3 TradeGold Powerful 1:3 Trade
= Down Trend
= breaking their Support
= Price below the 200 EMA
= Positibe news For USD Coming soon (Bad for Gold)
= Proper Price action
Gold Long Term OutLook By DP Sir , BearishGold Is Looking Bearish Till 56000
Gold Is Looking Bearish Till 56000
Gold Is Looking Bearish Till 56000
Gold Is Looking Bearish Till 56000
Gold Is Looking Bearish Till 56000
Gold Is Looking Bearish Till 56000
Gold Is Looking Bearish Till 56000
Gold Is Looking Bearish Till 56000
Gold Is Looking Bearish Till 56000

NFP report: How Will it Shape the Gold Trend?NFP report: How Will it Shape the Gold Trend?
Gold prices experienced a rise on Tuesday and Thursday (sideways on Wednesday), driven by traders' expectations of another interest rate hike by the US Federal Reserve. But is the medium-term downtrend really over?
One fundamental indicator that can help answer this question is the nonfarm payrolls, due to be released this Friday (US time). Any unexpected outcomes could lead to heightened volatility in rate-sensitive assets such as gold.
Market projections indicate that the upcoming nonfarm payrolls report for May will show a slowdown in job additions to the economy, with 190,000 jobs compared to the 253,000 jobs added in April. Interestingly, the forecast for the previous month was also around 190,000 jobs.
The nonfarm payroll data serves as the final key indicator ahead of the release of inflation data on June 14 and the concurrent interest rate decision from the Federal Reserve.
Market sentiment currently suggests a 60% probability of a 25 basis-point interest rate hike during the Federal Reserve's upcoming June meeting, compared to a 26% chance observed a week earlier. If implemented, this would mark the central bank's 11th consecutive rate increase.
Gold was trading around $1,932, reaching its lowest level since March 17 before its incline began on Tuesday. While Thursday was a positive day for the metal, it still retraced about half of its gains on the day and now trades at approximately $1,960. It peaked at $1,974, which is the most immediate resistance level but without much historical precedence. Considering the NFP is still two days away, this level might become irrelevant.
$1,985 is a level with more medium-term precedence but will have to wait until closer to the release of the data to tell if this level is something that needs to be watched. If gold turns to the downside, it might pay to keep an eye on $1,938 as a support level.

GBPUSD trading setup for next weeks and monthsGBPUSD is right now testing at weekly resistance and also been rising for last 6 weeks . It may seem for correction here at this moment with target at fib. retracement at 61.8 .
Stop loss just above the weekly resistance . You can trade accordingly with proper risk management . Also , this week we have BoE interest rate decision in view and also the GDP report on friday.
Be cautious on these days
Happy trading

Gold Latest Analysis before Fed decision ,PMI and ISM (Short) ?Be cautious of trade today as it could be highly volatile environment due to different news today .
Gold is forming bullish penant , if broken could lead gold to 2028 -30 levels before a correction.
Happy trading , look for stop loss hunts due to great volume today.

XAUUSD (Gold) Latest Analysis LONG or Short . Find out Gold latest move in 1 hr time frame may breakout from symmetrical triangle and reach to 2005- 2012 📈 range before falling down . But if broken previous week high at 2015 may lead to test resistance at 2020. If not broken symmetrical triangle can lead to 1950-1960 📉 support range and will also broke the daily bear flag which will give the confirmation for further down levels .
Enjoy trading
Be cautious of sudden moves and stop loss hunt.🥇

GOLD with current S/R levels predictionMCX:GOLD1! gold is in parallel channel at the top level support area which was previously a resistance zone, this support zone+ parallel channel breakout can send gold on new all time high or retest the new high level once again.

told sell gold 59700 hit 59330 now if close blw 59500 told sell gold 59700 hit 59330 now if close blw 59500 thna more bear form can be seen or 59101 blw gold game over soon melt dwn will start after lvl will update

sell gold 59800-900 sl 60096 tgt 59610--59400--59120++++++sell gold 59800-900 sl 60096 tgt 59610--59400--59120++++++ yes trade with marzin extreme overbought here

mcx gold if sustain abv 56786 thna will see 57000 near expecttt-mcx gold if sustain abv 56786 thna will see 57000 near expecttt- after buy on dipsss with sl 56577 as per chart pattern
