Trump speaks tonight — Gold at decision point.Market Context (H1–H4)
Gold remains in a broader bullish structure, but short-term price action has shifted into a decision phase after rejecting ATH. The sharp drop created a displacement leg, followed by a corrective bounce — typical post-event behavior.
Structurally:
HTF trend is still upward (ascending channel intact)
No confirmed HTF bearish reversal yet
Current move looks like rebalancing, not trend failure
Fundamental Context
Trump’s speech tonight is the key volatility trigger
Any geopolitical / USD-impacting rhetoric can cause:
A liquidity sweep before direction
Or a direct continuation if risk-off sentiment returns
Market is likely positioning → expect fake moves before clarity
Technical Breakdown
ATH: recent distribution, not yet reclaimed
FVG (upper): potential reaction zone for sellers if price rallies
Mid Zone (~5090–5120): short-term decision / balance area
Strong Demand (~4980–5000): HTF buy zone, aligns with trendline & prior BOS base
Trading Scenarios (If–Then)
If price holds above 5090–5120 → look for continuation into FVG, then ATH test
If price sweeps below 5090 but reclaims → classic liquidity grab → BUY continuation
If price breaks and holds below 5000 (H1 close) → deeper pullback, bullish bias pauses (not flips yet)
Key Takeaway
This is not the place to chase.
Trade reactions, not headlines.
Let Trump speak → let liquidity show → then follow structure.
Bias: Bullish continuation unless strong demand fails.
Goldtradingidea

Gold retraces after surge – trend remains intact.Quick Context
Recent geopolitical uncertainty continues to support safe-haven flows. Gold has already delivered a strong bullish impulse, and the current move looks like a healthy correction, not a reversal.
Technical Snapshot (H1–H4)
Strong bullish impulse already completed
Current price action = controlled retracement
No bearish CHoCH, no structural breakdown
Market is resetting momentum after expansion
This is typical impulse → retrace → continuation behavior.
Key Levels to Watch
Buy Zone: 5,180 – 5,160
Invalidation: H1 close below 5,120
Upside continuation targets:
5,300
5,360
Extension toward 5,440+
If – Then Logic
If price holds above 5,160 → expect continuation higher
If price sweeps into 5,180–5,160 and reacts → buy-the-dip opportunity
Only if H1 closes below 5,120 → bullish bias weakens
Bottom Line
Gold is not reversing — it is reloading.
Pullbacks are part of trend strength.
Wait for reaction, not confirmation at the highs.

HTF Bullish Context: Buy the Pullback, Not the Market Context
Gold remains in a strong higher-timeframe bullish structure.
Momentum is driven by sustained risk-off flows and persistent demand for safe-haven assets.
In this environment, pullbacks are opportunities, not signs of reversal.
Technical Structure (HTF → LTF Alignment)
Price previously confirmed a BOS (Break of Structure) to the upside.
The latest impulsive leg created a clear bullish FVG.
Current price is consolidating below 4,953, signaling a corrective pullback, not distribution.
Structure remains intact as long as price holds above the key demand zone.
Key Levels (Decision Zones)
Current high: 4,953
Discount pullback zone (FVG): 4,906 – 4,887
Deep support / structure low: 4,810
Upside projection (1.618): 5,061
Scenarios (If – Then)
Primary Scenario – Bullish Continuation
If price reacts and holds above 4,900
FVG is respected → continuation toward 4,953, extension to 5,061
Alternative Scenario – Deeper Pullback
If price loses 4,900
Expect a deeper retracement toward 4,810
Structure remains bullish unless HTF closes below 4,810
Summary
This is a trend continuation environment.
Chasing highs carries poor risk-reward.
Buy the pullback.
Respect the FVG.
Let structure do the work.

Trump Davos Warning Keeps Gold in Strong Uptrend Market Context (News → Flow)
Comments from Trump at Davos, including renewed threats and pressure around Greenland, have escalated geopolitical uncertainty during the Asian session.
Markets reacted in classic risk-off mode:
USD weakens amid political uncertainty
Equities hesitate, risk appetite fades
Safe-haven flows rotate into Gold, driving momentum higher
Gold is not moving on speculation — it is reacting to capital seeking protection.
Technical Structure (H1 – SMC)
Overall structure remains bullish, confirmed by multiple BOS
Price is trending inside a well-defined ascending channel
Recent pullback respected the bullish FVG, showing strong demand
No bearish acceptance below structure at this stage
➡️ FVG respected → continuation remains in play
Key Decision Zones
Upper FVG: 4,765.425
Mid support: 4,727.188
Current impulse high: 4,883.900
These are reaction zones, not chase levels.
Scenarios (If – Then)
Primary Scenario – Trend Continuation
If price holds above 4,765.425
Bullish structure remains intact
Gold can continue advancing toward higher channel resistance
Alternative Scenario – Technical Pullback
If price loses 4,765.425
A pullback toward 4,727.188 is possible for rebalancing
Only a clear H1 close below 4,727.188 would weaken the bullish bias
Summary
Geopolitical rhetoric is accelerating volatility, but structure still leads the narrative.
Gold is not reacting emotionally —
it is pricing risk.

Trump Davos Warning Keeps Gold in Strong UptrendMarket Context (News → Flow)
Comments from Trump at Davos, including renewed threats and pressure around Greenland, have escalated geopolitical uncertainty during the Asian session.
Markets reacted in classic risk-off mode:
USD weakens amid political uncertainty
Equities hesitate, risk appetite fades
Safe-haven flows rotate into Gold, driving momentum higher
Gold is not moving on speculation — it is reacting to capital seeking protection.
Technical Structure (H1 – SMC)
Overall structure remains bullish, confirmed by multiple BOS
Price is trending inside a well-defined ascending channel
Recent pullback respected the bullish FVG, showing strong demand
No bearish acceptance below structure at this stage
➡️ FVG respected → continuation remains in play
Key Decision Zones
Upper FVG: 4,765.425
Mid support: 4,727.188
Current impulse high: 4,883.900
These are reaction zones, not chase levels.
Scenarios (If – Then)
Primary Scenario – Trend Continuation
If price holds above 4,765.425
Bullish structure remains intact
Gold can continue advancing toward higher channel resistance
Alternative Scenario – Technical Pullback
If price loses 4,765.425
A pullback toward 4,727.188 is possible for rebalancing
Only a clear H1 close below 4,727.188 would weaken the bullish bias
Summary
Geopolitical rhetoric is accelerating volatility, but structure still leads the narrative.
Gold is not reacting emotionally —
it is pricing risk.

Greenland Tension Escalates – Gold Finds Its N Market Context (News → Capital Flow)
Escalating tensions around the “Greenland purchase” narrative are increasing geopolitical risk.
Markets are responding in a familiar pattern:
USD weakens as political uncertainty rises
Equities face corrective pressure amid risk-off sentiment
Safe-haven flows return to Gold, supporting further upside
In this environment, Gold is not rising on technicals alone,
but because defensive capital is rotating back into the market.
Technical Structure (H1 – SMC)
Price previously executed a downside Liquidity Sweep
A bullish Market Structure Shift (MSS) followed
The impulsive leg created a clear bullish FVG, signaling supply–demand imbalance
Price is currently holding above the FVG, keeping the bullish structure intact
➡️ A familiar model in play:
Liquidity Sweep → FVG → Continuation
Key Zones (Decision Levels)
Upper FVG: 4,642.447
Lower FVG: 4,622.238
Deeper support (OB): around 4,596.733
These are reaction zones, not FOMO areas.
Scenarios (If – Then)
Primary Scenario – Continuation (~70%)
If price holds above 4,622.238
The FVG is considered defended
Bullish continuation toward higher levels remains favored
Aligned with USD weakness + risk-off environment
Alternative Scenario – Pullback (~30%)
If price loses 4,622.238
A corrective move toward the OB near 4,596.733 becomes likely
Only an H1 close below the OB would materially weaken the bullish outlook
Summary
Geopolitical headlines are amplifying volatility,
but the final decision lies in price reaction at the FVG.
Gold is not chasing headlines —
it is following capital seeking safety.

XAUUSD M30 – Technical retracement, wait to BUY at Demand🔎 Market Structure (SMC)
• The overall structure is still a bullish range, no clear bearish breakout
• Price is reacting at the Resistance zone 4,476 → a short-term correction appears
• The current decline is a pullback, not a trend reversal
• Liquidity above remains, but no strong distribution signal yet
🔴 Upper Resistance Zone (Reaction Zone)
• Resistance: 4,476 – 4,480
→ Zone rejected multiple times, likely to see short-term correction / profit-taking
🟢 Preferred BUY Zone (Main Demand)
• FVG + Fibo: 4,440 – 4,423
• Bullish OB: 4,423 – 4,407
Confluence:
FVG not fully filled
Fibo 0.5–0.618 of the most recent uptrend
Clear bullish Demand / OB
👉 Prioritize BUY when price retraces to this zone and shows price holding reaction
🟡 Deep Scenario (Liquidity – GAP)
• GAP + Liquidity: 4,349 – 4,333
→ Only consider BUY if there is a liquidity sweep + strong reaction, do not BUY blindly
🎯 Expected Targets
• TP1: 4,476
• TP2: 4,516
• TP3: 4,542 (if breaking above range)
❌ Invalidation
• Price closes M30 below 4,333
→ Demand fails, prioritize staying out waiting for new structure
📌 Quick Summary
• Bias: Bullish pullback
• Strategy: BUY at Demand – avoid FOMO at high zones
• Only trade when price hits the zone, do not enter mid-range

XAUUSD M30: Buy at lows in downtrend channel pullback🔍 Market Structure (SMC)
• The previous major trend was bullish, but currently, the price is adjusting within a downtrend channel
• The nearest peak is a Weak High → short-term selling pressure still exists
• Within the downtrend channel, the price has created a small BOS, indicating sellers are controlling the short-term pace
• The bullish structure has not been completely broken, so the current decline is considered a pullback / liquidity redistribution
🔴 Reaction zone above (short-term SELL)
• OB + Fibo retracement: 4,454 – 4,466
• Confluence:
Order Block bearish
Fibo 0.5–0.618 of the decline
Upper trendline of the downtrend channel
👉 Only SELL for short-term reactions, not SELL according to the major trend.
🟢 Key BUY zone (Main Demand)
• Bullish OB: 4,405 – 4,395
• This is a zone:
Clearly defined previous Demand
Bottom of the downtrend channel
Area prone to liquidity sweep + strong reaction
👉 Prioritize BUY when the price sweeps down to this zone and holds the bottom.
🎯 Expectations & Targets
• TP1: 4,440
• TP2: 4,466
• TP3 (if breaking the channel): return to the above Weak High zone
❌ Invalidation
• Price closes M30 below 4,395
→ Demand fails, bullish structure breaks → stop BUY scenario
📌 Quick Summary
• Short-term: Sideway – decline within the channel
• Main strategy: BUY low – SELL reaction
• Do not FOMO in the middle, wait for the price to hit the zone

XAUUSD M30 – Pullback BUY according to OB + GAP + Fibo🔎 Market Structure (SMC)
• Price has clearly BOS increased, confirming the short-term trend is still bullish
• Currently, the price is moving on an upward trendline, the decline is just a technical pullback
• No CHoCH decrease has appeared → no reversal signal yet
🟢 Key BUY Zone (Confluence Zone)
• Bullish OB + Fibo 0.5–0.618: 4,416 – 4,397
• This is a valid demand zone because:
OB is below the price
Coincides with the Fibo retracement of the BOS move
Located above the HL structure
👉 Prioritize BUY when the price retraces to this zone and a clear price reaction appears (reject / engulf / hold bottom).
🟡 Deep BUY Zone – GAP / FVG
• FVG – GAP not yet filled: 4,348 – 4,332
• This is a deep liquidity zone, only activated when:
The OB above is breached
The price has not yet broken the large frame upward structure
👉 Used for patient BUY, no FOMO.
🎯 Targets (Liquidity above)
• TP1: 4,490
• TP2: 4,514
• TP3: 4,533 – 4,553 (Liquidity Sell $$$)
❌ Invalidation
• Price closes M30 below the entire GAP zone (4,332)
→ Upward structure is broken, canceling the entire BUY scenario
📌 Quick Summary
• Bias: Bullish – Buy the dip
• Main BUY zone: OB + Fibo 0.5–0.618
• Deep BUY: FVG / GAP
• Do not SELL against the trend when there is no CHoCH decrease

XAUUSD – M30 Trading Plan | Buy Demand + GAP–FiboAUUSD – M30 Trading Plan | Buy Demand + GAP–Fibo
🔍 Market Context (SMC)
The price has formed an upward BOS, confirming the short-term trend still belongs to the BUY side. The current decline is just a technical pullback to rebalance the cash flow, there is no bearish CHoCH → no reason to reverse the bias.
OB is below the current price, so this area is Demand (Buy Zone),
🟢 Primary Scenario – BUY according to Demand + GAP + Fibo
• Confluence Buy Zone:
Demand / Bullish OB + GAP (iFVG) + Fibo 0.5 – 0.618
→ price range: 4.40x – 4.39x
• Entry Logic:
The price retraces to the GAP not fully filled, coinciding with the Fibo retracement of the upward BOS → high probability of a BUY reaction.
• Target:
TP1: nearest previous peak
TP2: expand according to structure if there is a continued BOS
• Invalidation:
M30 candle closes below the entire Demand / GAP area → cancel the BUY scenario
⚠️ Secondary Scenario – Not prioritized
If the price does not retrace to GAP – Fibo but continues sideways or breaks the peak → stay out, do not chase BUY without a proper pullback.
📌 Summary
• Trend: Bullish after BOS
• Optimal BUY point: Demand + GAP + Fibo (0.5–0.618)
• Only SELL when there is a clear bearish CHoCH (currently none)

XAU/USD: Retrace to Supply, Await Next Move Reaction◆ Market Context (M30)
After the previous sharp decline, gold has formed an upward CHoCH and upward BOS, confirming a short-term recovery. The price is currently approaching the upper Supply zone, where strong selling pressure was previously observed.
◆ Structure & Flow (SMC)
• The nearest bottom is held firm at Demand / OB, indicating that buying flow is still effective.
• The current upward move is characterized by recovery + rebalancing, not a breakout of a major trend.
• The upper Supply zone is the area to watch for price reaction to confirm the next direction.
◆ Key Levels
• Supply Zone: ~4,390 – 4,401
• Buy Fibo (scalp / pullback): ~4,345 – 4,350 (Fibo 0.5)
• Demand / OB: ~4,305 – 4,315
• Upper Liquidity: ~4,430+
◆ Trading Scenarios
➤ Scenario 1 – BUY pullback (priority when structure holds)
• Price retraces to 4,345 – 4,350
• Price holding reaction / candle rejecting decline appears
• Target: 4,390 → 4,430
• Invalid: M30 closes below 4,315
➤ Scenario 2 – SELL reaction at Supply (short-term)
• Price hits 4,390 – 4,401 but does not break
• Rejection / breakdown appears on M5–M15
• Target: 4,350 → 4,320
• This is a counter-trend scalp, not the main trend.
◆ Summary
• Short-term bias: Sideway → Slightly Bullish, prioritize BUY on retrace.
• Upper Supply is the decisive zone: strong break → continued rise, rejection → technical correction.
• Avoid FOMO in the middle range, wait for price to reach confluence zone.

XAU/USD: Buy now as it accumulates below resistance!◆ Market Context (M30)
Gold prices are maintaining a short-term uptrend. After the previous BOS increase, the market is currently accumulating just below the Resistance area, indicating that buyers are still in control but need more liquidity before expanding the range.
◆ SMC & Price Action
• The current structure is still Higher High – Higher Low, with no bearish CHoCH.
• Prices are compressing just below the Resistance Zone ~4,518, indicating the possibility of sweeping liquidity in both directions before a breakout.
• Below exists Buy-side Liquidity + FVG, which is a good support area for the trend continuation scenario.
◆ Key Levels on the chart
• Resistance Zone: ~4,518
• Buy Liquidity: 4,501 – 4,492
• FVG Buy: ~4,465
• Invalid bullish structure: M30 closes below 4,465
◆ Trading Scenarios
➤ Scenario 1 – BUY pullback (priority)
• Wait for the price to retrace to 4,501 – 4,492 (Buy Liquidity)
• If there is a price holding reaction → continue to BUY according to the trend
• Targets: 4,518 → 4,540+
• SL: below 4,465
➤ Scenario 2 – BUY deep at FVG
• In case the price sweeps more strongly to ~4,465 (FVG Buy)
• This is the last defense area for buyers in the current structure
• Expect a rebound to the old peak area
➤ Scenario 3 – Break & Continue
• If the price breaks decisively above 4,518 and holds
• Watch for a retest to BUY according to the expanding wave
◆ Summary
• Main bias: Bullish.
• Strategy: Buy the dip, do not SELL without a bearish CHoCH.
• Important observation areas: 4,501 – 4,492 – 4,465.
• Break above 4,518 will open a new upward phase.

XAU/USD: Buy at FVG + Fibo, sell at Upper Liquidity◆ Market Context (M30)
Gold maintains an upward trend with previous BOS movements. After the push to the nearest peak, the price is undergoing a technical correction to rebalance liquidity before choosing the next direction.
◆ SMC & Price Action
• The current decline is a pullback, with no bearish CHoCH confirming a reversal.
• The retracement area coincides with FVG + Fibo (0.5–0.618) → potential BUY reaction zone.
• Above exists Liquidity $$$ (Sell) – a target to attract liquidity if the price surges.
◆ Key Levels
• FVG – Fibo BUY: 4,466 – 4,461
• Liquidity SELL: ~4,584
• Intermediate resistance: 4,524
• Invalid bullish: H1/M30 closes below 4,455
◆ Trading Scenarios
➤ Scenario A – BUY Pullback (priority)
• Wait for price to retrace to 4,466–4,461
• Condition: candle holds price, does not break structural low
• Targets: 4,524 → 4,584
• SL: below 4,455
➤ Scenario B – Break & Continue
• If price holds above the current area and continues to close bullish candles
• Follow the trend, take partial profits at 4,524
➤ Scenario C – SELL Reaction (short-term)
• When price hits Liquidity ~4,584
• Only SELL if a clear rejection appears (wick/engulfing)
◆ Summary
• Main bias: Bullish.
• Strategy: Buy the dip, avoid counter-trend SELL without CHoCH.
• Decision zone: 4,466–4,461 | Target: 4,524 → 4,584.

Bullish Trend Intact, Focus on Buy-the-Dip Market ContextGold continues to trade firmly within an ascending channel, maintaining its bullish momentum after the latest impulsive move. The market is currently in a technical pullback phase, which is considered healthy within an uptrend rather than a sign of reversal.
On the fundamental side, dovish Fed expectations and the outlook for lower interest rates keep pressure on the USD, providing ongoing support for gold. As long as this macro backdrop remains unchanged, downside moves are expected to stay corrective.
Technical Structure (H1)
Bullish market structure remains valid (Higher Highs & Higher Lows)
Price is holding above the ascending trendline
No confirmed bearish break of structure
Overall bias remains bullish continuation
Key Price Zones
Primary BUY Zone: 4,480 – 4,470
(Trendline support + demand zone + structure support)
Deeper Support: 4,444
Upside Targets / Resistance:
4,512 → 4,563
Trading Plan – MMF Style
Primary Scenario – Trend-Following BUY
If price pulls back into 4,480 – 4,470 and holds on H1
→ Look for BUY setups aligned with the main trend
This zone represents a high-probability area for smart money re-entry
Targets
TP1: 4,512
TP2: 4,563
Scale out near major resistance areas
Alternative Scenario
If price does not retrace deeply and holds above 4,500
→ Wait for a break & retest before considering continuation BUYs
Avoid chasing price near the upper resistance zone
Invalidation
A H1 close below 4,444 would weaken the short-term bullish structure and require reassessment.

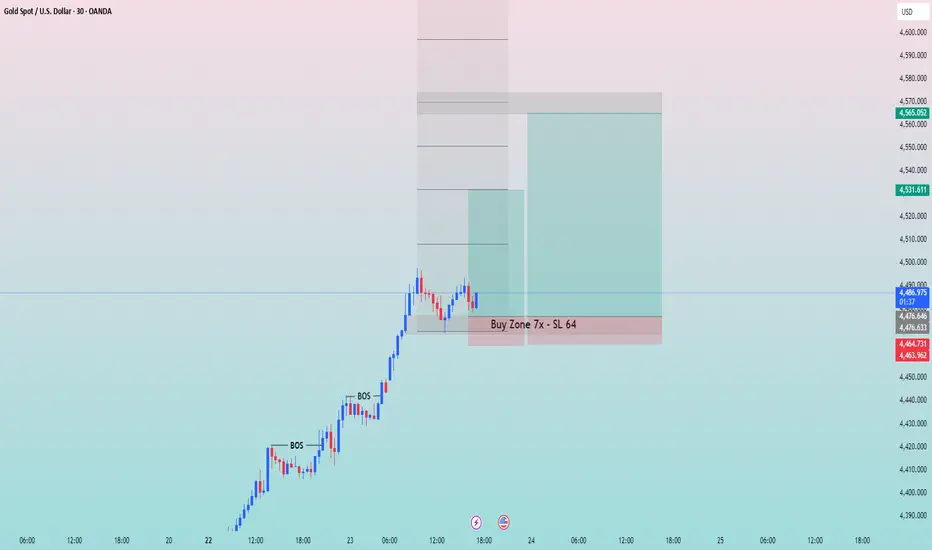
XAU/USD: Buy on pullback in strong upward trend!◆ Market Context (M30)
Gold is in a clear upward trend, demonstrated by a series of consecutive BOS and gradually higher lows/highs. After a strong push, the price is currently consolidating sideways in the premium area, indicating the market is pausing before choosing the next direction.
◆ SMC & Price Action
• The upward structure remains intact, with no bearish CHoCH appearing.
• The current adjustment area is the Buy Zone – where the price previously created a BOS.
• This sideways movement is rebalancing, often a precursor to the next upward move if support is not broken.
◆ Key Levels
• Buy Zone: 4,476 – 4,464
• Invalid upward: clear break below 4,464
• Upper targets:
▪ 4,531
▪ 4,565
◆ Trading Scenarios
➤ Scenario A – Pullback BUY (priority)
• Wait for a pullback or hold within Buy Zone 4,476 – 4,464
• Condition: candle holds price, does not break structural low
• Targets:
▪ 4,531
▪ 4,565
• SL: below 4,464
➤ Scenario B – Break & Continue
• If price holds above the current area and continues to close bullish candles
• Follow the trend, manage orders partially at target levels
➤ Scenario C – Defensive
• If 4,464 is clearly broken
• Short-term upward structure invalidated → stay out and wait for a new setup
◆ Summary
• Main trend: Strong bullish.
• Priority strategy: BUY with the trend, do not SELL against it.
• Decision area: 4,476 – 4,464.
• Next targets: 4,531 → 4,565.
XAU/USD – Strong Bullish Expansion, Focus on Pullback BuysMarket Context
Gold has delivered a strong bullish expansion after breaking out of the previous consolidation range. The impulsive move confirms aggressive buy-side participation, suggesting that the market is now in a trend-continuation phase rather than distribution.
From a macro perspective, expectations around a dovish Fed outlook and future rate cuts continue to weaken the USD, providing a supportive environment for gold. This keeps the broader bias tilted to the upside, with pullbacks viewed as opportunities to reload long positions.
Technical Structure (H1 – Short-Term)
Clear Bullish BOS confirmed after range breakout
Price is holding above prior resistance → flipped to support
Current price action shows rebalancing after impulse
No bearish structure break so far
Key Price Zones
Primary BUY Zone:
4,420 – 4,410
(previous resistance + demand + structure base)
Intermediate Support:
4,433 – 4,432
Upside Liquidity / Resistance:
4,466
4,500
4,540 – 4,550 (sell-side reaction zone)
Trading Plan – MMF Framework
Primary Scenario – Buy the Pullback
If price pulls back into 4,420 – 4,410, look for acceptance and bullish reaction
This zone is ideal for trend-following BUY setups
Expect continuation toward higher liquidity levels
Upside objectives:
TP1: 4,466
TP2: 4,500
TP3: 4,540 – 4,550 (possible reaction / partial profit area)
Alternative Scenario
If price does not retrace deeply and holds above 4,432, wait for a break & hold above 4,466, then look for continuation buys on shallow pullbacks
Avoid chasing price directly into the 4,540+ area
Invalidation
A confirmed H1 close below 4,405 would weaken the short-term bullish structure and suggest a deeper corrective phase.
Summary
Gold is in a strong bullish trend after a clean breakout.
Current moves are rebalancing, not reversal.
Bias remains BUY on pullbacks, targeting higher liquidity while respecting reaction zones above.

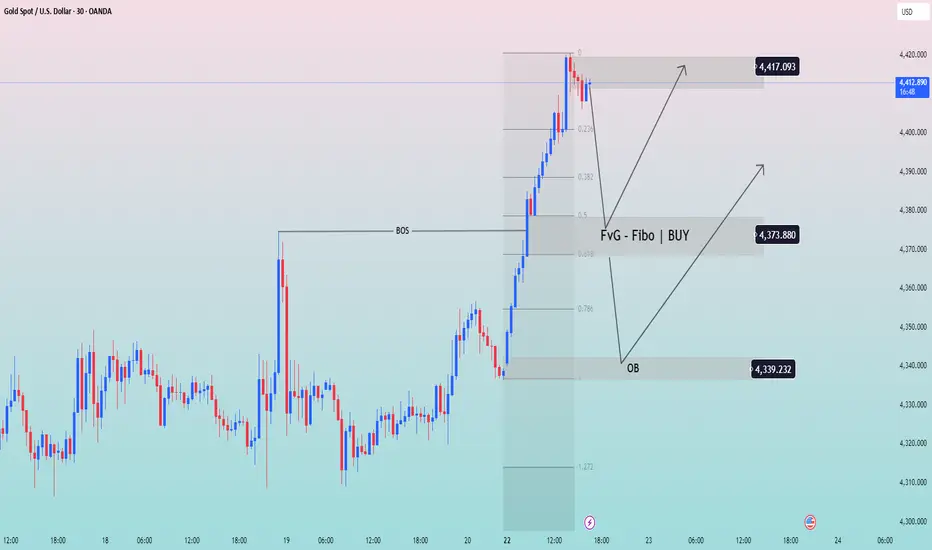
XAU/USD: Buy on BOS, FVG + Fibo retracement!◆ Market Context (M30)
Gold has just broken the rising BOS and created a strong push to the short-term peak area of 4,417. After the impulse, the market enters a pullback to rebalance—a common behavior before continuing the main trend.
◆ SMC & Price Action
• The rising structure remains valid (HH–HL).
• The FVG + Fibo zone (0.5–0.618) around 4,374 is the preferred area to look for buying pressure.
• The OB below ~4,339 is a deeper support area if the pullback extends.
• No bearish CHoCH yet → prioritize the bullish continuation scenario.
◆ Key Levels
• Nearest peak/resistance: 4,417
• FVG + Fibo (BUY zone): ~4,374
• Deep OB: ~4,339
• Invalid rise: clear break of 4,339
◆ Trading Scenarios
➤ Scenario A – Pullback BUY (priority)
• Wait for price to retrace to 4,374 (FVG + Fibo)
• Condition: rejection candle / maintain HL
• Targets:
▪ 4,397
▪ 4,417 (peak)
▪ extend if peak is broken
➤ Scenario B – Deeper Pullback
• If 4,374 is breached
• Monitor OB ~4,339 for buying reaction
• Only BUY with structural confirmation
➤ Scenario C – Break & Continue
• If price does not retrace deeply and holds above 4,397
• Follow the trend towards 4,417+
• Avoid FOMO at premium
◆ Summary
• Context: pullback in an uptrend.
• Decision zone: 4,374 → 4,339.
• Upper target: 4,417.
• Prioritize BUY according to structure, manage risk when price is at premium.
XAUUSD | Awaiting Reaction at OB + Fibo to Confirm Next Move◆ Market Context (M30)
The price is maintaining an uptrend with a supporting trendline. After a strong push creating a short-term peak, the market enters a pullback to rebalance. The current decline has not broken the upward structure.
◆ SMC & Price Action
• The rapid decline creates an OB + Fibo Sell zone ~4,335 (retesting the premium area).
• The price has reacted at the trendline ~4,315, indicating that buying pressure still protects the structure.
• Liquidity above 4,367 – 4,372 remains → potential for liquidity draw if the trend continues.
◆ Key Levels
• OB + Fibo Sell: ~4,335
• Trendline / Support: ~4,315
• Liquidity (upper target): 4,367 → 4,372
• Invalid uptrend: clear break below trendline ~4,315
◆ Trading Scenarios
➤ Scenario A – Pullback BUY (priority)
• Await price reaction around the trendline ~4,315
• Condition: candles rejecting decline / maintaining higher lows
• Targets:
▪ 4,335
▪ 4,367 → 4,372 (Liquidity)
➤ Scenario B – Short-term Sell
• If the price retraces to OB + Fibo ~4,335 but does not break
• Observe rejection signals to SELL back to 4,315
• Only a scalp against the main trend
➤ Scenario C – Breakdown (defensive)
• If the trendline ~4,315 is decisively broken
• Stay out / wait for a new CHoCH before BUYing again
◆ Summary
• Context: pullback within an uptrend.
• Decision zones: 4,315 (trendline) and 4,335 (OB + Fibo).
• Upper target: 4,367 → 4,372.
• Avoid FOMO; prioritize BUYing pullbacks according to the structure.

Liquidity Grab Completed, Waiting for Pullback to ContinueMarket Context
Gold has just completed a strong impulsive rally, sweeping buy-side liquidity above the previous highs. After this expansion, price is now entering a short-term consolidation / pullback phase, which is expected behavior following a liquidity grab rather than a full trend reversal.
From a fundamental perspective, expectations of a more accommodative Fed stance continue to limit downside pressure on Gold, keeping the broader bias supported despite intraday corrections.
Technical Structure (Short-Term)
The larger structure remains bullish
Recent move shows a liquidity grab at the highs, followed by rejection
Current price action suggests rebalancing into demand zones
No confirmed bearish market structure shift so far
Key Technical Zones
Upper Resistance / Sell Reaction: 4,360 – 4,365
Intraday Resistance: 4,333 – 4,336
Buy Zone (Pullback Area): 4,300 – 4,305
Deeper Demand / Liquidity Support: 4,275 – 4,280
Trading Plan – MMF Style
Primary Scenario – Buy the Pullback
Expect price to retrace into 4,300 – 4,305 or deeper toward 4,280
Look for bullish reaction / stabilization to rejoin the trend
Upside targets:
TP1: 4,323
TP2: 4,335
TP3: 4,360+ (liquidity)
Alternative Scenario
If price holds above 4,323 and breaks higher directly, wait for a clean retest before considering continuation setups.
Avoid chasing price at premium levels.
Invalidation
A sustained break and H1 close below 4,275 would weaken the bullish continuation scenario and shift focus to deeper consolidation.
Summary
Gold remains in a bullish environment, with current weakness viewed as a technical pullback after liquidity grab.
Bias remains buy-the-dip, prioritizing patience and confirmation at key demand zones.

Waiting for OB Reaction to Confirm the Next Move◆ Market Context (M30)
Price swept sell-side liquidity around 4,349–4,350 but failed to hold, indicating weakening buying pressure in premium. With a prior liquidity sweep at the lows and a bullish BOS, the current move is likely a rebalancing phase after liquidity absorption.
◆ SMC & Price Action
• Rejection after the upper sweep signals premium denial.
• The lower support zone marks the base of the prior bullish displacement (BOS base).
• OB + Fibo below act as an attraction zone for re-accumulation before direction is chosen.
◆ Key Levels
• Liquidity Sell: 4,349–4,350
• OB + Fibo (retest): 4,302–4,289
• Deeper support: 4,274
• Upper supply (if broken): 4,406
◆ Trading Scenarios
➤ Scenario A – Pullback BUY (Primary)
• Wait for a pullback into OB + Fibo 4,302–4,289
• Conditions: structure holds (no break of recent lows), bullish reaction
• Targets:
▪ 4,349
▪ Extension: 4,406
• Invalid if a clear break below 4,274
➤ Scenario B – Deeper Pullback
• If OB 4,302–4,289 is pierced
• Watch for reversal signals around 4,274
➤ Scenario C – Break & Continue (No FOMO)
• Only follow buys if price closes and holds above 4,350
• Monitor reactions at 4,406 for risk management/partials
◆ Summary
• Context: upper liquidity swept → favor pullbacks.
• Decision zone: OB + Fibo 4,302–4,289.
• Upside targets: 4,349 → 4,406.
• Avoid chasing price in premium.

Bullish BOS Breakout, Watching Reaction at OB & Sell-Side Liquid◆ Market Context (H2)
Price has just broken a bullish BOS and closed above the previous equilibrium zone, confirming buyers are in control. After the strong impulse, the market has entered a rebalancing phase, where a short-term pullback often appears before continuation or a liquidity sweep to the upside.
◆ SMC & Price Action
• Bullish structure confirmed by consecutive BOS following the prior CHoCH.
• The 4,274 OB is the nearest demand zone where buyers previously reacted.
• Above lies sell-side liquidity at 4,355, with a further extension toward 4,408 — a potential distribution or short-term reversal zone.
• Price is currently in premium, so patience is preferred over FOMO entries.
◆ Key Levels
• Resistance / Liquidity: 4,355 → 4,408
• Support OB: 4,274
• Deeper OB: 4,217
◆ Trading Scenarios
➤ Scenario A – Pullback BUY (Primary)
• Wait for a pullback into OB 4,274
• Conditions: structure holds (no break of recent lows), bullish reaction appears
• Targets:
▪ 4,319
▪ 4,355 (Liquidity Sell)
▪ Extension: 4,408
➤ Scenario B – Break & Continue
• If price holds above 4,319 with bullish closes
• Monitor reactions at 4,355 for partial profit-taking
• Avoid chasing price in premium zones
➤ Scenario C – Deeper Pullback
• If OB 4,274 is clearly broken
• Price may retrace to OB 4,217 for re-accumulation
• Only consider BUY after a fresh bullish CHoCH
◆ Summary
• Primary trend: Bullish (BOS confirmed)
• Priority: Buy pullbacks, avoid FOMO
• Key decision zone: OB 4,274
• Upside liquidity targets: 4,355 → 4,408

Market Accumulating Liquidity, Two Clear Scenarios for TodayGold continues to move within a bullish structure, but short-term order flow shows distribution inside the OBS Sell Zone 4,236. Price is currently trapped in the middle of the range, suggesting the market may need a liquidity sweep before choosing its next direction.
Fundamentally, expectations of a dovish Fed still support gold on deeper pullbacks — but intraday, the two MMF flow setups are extremely clear.
📊 Technical Outlook (MMF Flow – H1)
🔸 OBS SELL ZONE: 4,236
• Strong reaction on first touch → supply confirmed
• Downtrend line converges here → high probability of liquidity traps
🔸 OBS BUY ZONE: 4,197
• First key demand zone below
• Aligned with channel support → likely bullish reaction
🔸 Sell-side Liquidity: 4,181
• If price sweeps this area → ideal reversal point
🔸 Premium SELL Reaction Zone: 4,284
• If gold expands upward → priority area for distribution / short-term correction
🎯 Two Main MMF Scenarios
Scenario 1 – SELL reaction → BUY trend continuation
• Price retests 4,236
• Bearish reaction → pushes price toward 4,197 – 4,181
• Reversal signal appears
• Targets: 4,236 → 4,284
➡️ This is the cleanest play following today’s liquidity flow.
Scenario 2 – Direct bullish expansion
• Price breaks and closes above 4,236
• Retests this zone
• Expands toward 4,284
➡️ Requires strong bullish momentum — no confirmation, no trade.
🧭 MMF Intraday Bias
• Bullish as long as price holds above 4,197
• Neutral → Bearish only if price closes below 4,181 (failed liquidity sweep)
The market is preparing for a breakout — let liquidity do its job before choosing direction.

XAU/USD – Recovery structure testing 4,239 – 4,2611. Market Context
On the M30 timeframe, the previous downtrend has started to weaken. The price has formed a series of Equal Lows patterns, indicating that the short-term bottom is protected, followed by a Change of Character (ChoCH) and a slight Break of Structure (BOS). This reflects that the selling pressure has decreased in intensity and the market is transitioning into an accumulation phase, preparing for a recovery.
The downtrend line is still valid, but the price is approaching the breakout area. Closing candles above this line will confirm a phase transition.
2. Key Price Areas
Upper Supply Zone
4,239 – 4,240: the nearest strong reaction area, acting as the main resistance.
4,261: coincides with the 1.272 Fibonacci of the correction wave, a notable liquidity area.
4,282 – 4,283: expansion target, corresponding to Fibonacci 1.618.
These areas will be points where the market may show counter-reactions during the uptrend.
Lower Demand Zone
4,168 – 4,154: the Demand Zone formed from the previous strong reversal. This is the area where the market effectively absorbed selling pressure and may continue to act as support during corrections.
3. Fibo and Price Action
The current uptrend is following a standard pullback structure: from the 4,168 bottom, the price recovers to Fibonacci levels like 0.236 – 0.382, then forms a small correction before approaching the downtrend line again.
If the price surpasses the trendline, the next targets will be:
4,213 (Fibo 0.618),
then the main supply zone 4,239 – 4,240.
Closing candles above this area will pave the way for the next targets at 4,261 and 4,282.
4. Trading Plan
Buy Scenario – prioritize during correction
Early buy position: 4,188 – 4,195
(retest small structure and trendline)
Optimal buy zone: 4,168 – 4,154
(Demand Zone + deep Fibo correction)
Stop loss: below 4,150
Targets:
4,213
4,239 – 4,240
4,261
expanding to 4,282
Short-term Sell Scalp Scenario
Reaction zone: 4,227 – 4,230
(near resistance + 0.786 Fibo)
Stop loss: 4,236
Target: 4,205 – 4,195
Note: This is only a short-term strategy, not the main trend.
5. Summary
• The market structure is transitioning from a downtrend to an accumulation – recovery phase.
• If the price surpasses and holds above the trendline, the nearest target will be 4,239 – 4,240.
• The supply zones 4,239 – 4,261 – 4,282 will play a decisive role in the next uptrend.
• The most effective trading strategy remains to wait for a buy during corrections to the strong support zone 4,168 – 4,154.
