Bearish Rejection From Supply, Targets Below
Market Structure
Price previously made a blow-off top (sharp impulsive high, marked by the red arrow), followed by a strong bearish reversal, breaking short-term structure.
The subsequent bounce formed a lower high, confirming a bearish market structure shift on the intraday timeframe.
Key Zones
Gray zone (≈ 4,880–4,950): Former demand → now supply / resistance.
Price retested this area and rejected, which is classic bearish continuation behavior.
Blue zone (≈ 4,520–4,600): Major support / demand zone from the prior swing low.
Trade Idea Logic (as drawn)
Entry: Short on rejection from the gray supply zone after weak bullish retracement.
1st Target: Around 4,714 — interim support / liquidity pool.
2nd Target: The blue support zone — completion of the bearish leg and likely reaction area.
Price Action Clues
Retracement into resistance was corrective (overlapping candles), not impulsive → favors sellers.
Failure to reclaim the gray zone = sellers still in control.
Momentum points downward, aligning with the projected path.
Invalidation
A clean 45-min close and hold above the gray supply zone would weaken the bearish bias and suggest deeper consolidation or reversal.
Goldtradingview

XAUUSD – Brian | H1 Weekend AnalysisXAUUSD – Brian | H1 Weekend Outlook: Volatility Reset & Range Opportunities
Gold delivered a sharp volatility spike in early Asia on Feb 6, flushing down toward the 4,680 area before quickly reclaiming ground as risk sentiment stabilized and the USD softened. The earlier drop looks driven by position reduction and portfolio rebalancing (traders covering equity losses), rather than a clean trend continuation. The recovery back above 4,830 confirms that buyers are still active when price returns to value.
Market Structure (H1)
On the H1 chart, price has transitioned into a two-way environment:
We’ve moved from an impulsive drop into a descending channel / corrective structure.
The rebound is strong, but still behaves like a corrective bounce inside the larger pullback.
This sets up a high-probability range/rotation into the weekend, where liquidity runs and mean-reversion moves can appear.
Key Zones To Watch
1) Upper Supply / Sell Pressure
5,100 – 5,200 zone (overhead supply)
This is the main area where rallies may face profit-taking and sell pressure. If price tags this zone and stalls, the market may rotate back down.
2) Mid-Range Reaction Area
~4,820 – 4,900 (current balance / pivot area)
This is the “decision zone.” Holding above it supports another push higher; losing it increases the probability of a deeper pullback.
3) Lower Demand / Liquidity Floor
4,650 – 4,700 (demand + volatility base)
The prior flush low area. If the market revisits this zone, watch for absorption and a potential rebound—especially if volatility spikes again.
Weekend Game Plan (Brian Mindset)
Primary expectation: sideways rotation with spikes (weekend-style volatility)
Best approach: trade reactions at the zones, not in the middle of the range
Bias handling:
Above the pivot → favor pullback-buys toward resistance
Into supply → be alert for rejection and rotation sells
Into demand → watch for absorption before considering longs
In a volatility-reset phase, levels and reactions matter more than prediction.
✅ Follow the TradingView channel to catch the next structure update early and exchange ideas with Brian.

XAUUSD (H2) – Liam ViewXAUUSD (H2) – Liam View
USD strength continues to limit gold | Sell-side structure still active
Quick summary
Gold remains under pressure on the H2 timeframe as a firm US Dollar keeps weighing on precious metals. The recent rebound looks corrective and lacks solid acceptance above supply. With markets positioning ahead of the delayed US Non-Farm Payrolls on Feb 11, volatility may increase, but structure still favours selling rallies.
Macro context
A stronger USD generally acts as resistance for gold and silver.
If the current USD rebound sustains, downside pressure on gold can continue.
Positioning ahead of US labour data increases the risk of liquidity-driven moves.
Technical view (H2)
After a sharp sell-off, price bounced from demand but stalled below previous distribution.
Key zones
Major sell zone: 5115 – 5130, extending toward 5535
Current reaction area: around 5000
Key demand / liquidity base: 4550 – 4580
Lower highs below resistance keep sell-side control intact unless price reclaims 5115 decisively.
Trading scenarios
Primary: Sell rallies into 5000 → 5115, targeting 4550
Continuation: Clean break below 4550 opens further downside
Invalidation: Only strong H2 acceptance above 5115 shifts bias bullish
Execution notes
Expect stop runs near data releases.
Wait for level reaction, not candle chasing.
Bias: sell rallies until structure changes.
— Liam

XAUUSD - Brian | H1 AnalysisXAUUSD – Brian | H1 Technical Outlook – SELL Bias Aligned With the Main Trend
Gold is entering a strong corrective phase after forming a short-term top, with the H1 structure clearly shifting to the downside. The latest bearish leg is impulsive in nature, reflecting active position unwinding and short-term distribution following the prior extended rally.
In this environment, the preferred approach is to prioritize sell setups in line with the dominant intraday trend, focusing on reactions around key psychological and value-based levels.
Market Structure & Price Behaviour
The previous bullish structure has been invalidated by a sharp downside break, confirming a structure shift on H1.
Price is now trading below prior value areas, suggesting a transition from expansion into pullback and continuation to the downside.
Upward moves at this stage are likely to be corrective rallies rather than trend reversals, offering potential sell opportunities.
Key Psychological & Technical Zones
1) Trend-Following SELL Zone
Sell VAL: 5,048 – 5,051
This zone represents the lower value area of the most recent distribution range and is acting as a psychological resistance within the current bearish context. Reactions here are critical for assessing sell-side continuation.
2) Near-Term Balance Level
The 5,000 psychological level remains a focal point for intraday volatility. How price behaves around this round number will help determine momentum continuation.
3) Deeper BUY Zone (Not a Day-Trade Focus)
Buy Zone VAL: 4,450 – 4,455
This is a broader structural support area and should be treated as an observation zone rather than an active buying entry during the current session.
Intraday Trading Bias
Primary bias: SELL, aligned with the current H1 trend
Strategy: Look to sell corrective pullbacks into key psychological and value zones
Risk note: Avoid counter-trend buying positions while the bearish structure remains intact
In volatile conditions, following the dominant structure and waiting for price reactions at key levels is more effective than attempting to pick bottoms.
Refer to the chart for a detailed view of structure and highlighted zones.
Follow the TradingView channel for early market structure updates and ongoing analysis.
If you want:
a shorter intraday note,
a more neutral tone, or
an alternative version in UK / Indian English,
just say the word and I’ll adjust it for you 👌

XAUUSD (H1) – Inverse Head & Shoulders confirmed, caution POC.Market overview
Spot gold has pushed above $4,470/oz, extending its strong performance after setting multiple record highs throughout 2025. The broader bullish backdrop remains intact, supported by trade-war concerns, ongoing geopolitical instability, and accommodative monetary policy across major economies. Strong and persistent buying from central banks continues to underpin gold’s long-term outlook into 2026.
Technical view – Inverse Head & Shoulders
On the H1 chart, gold has clearly formed an Inverse Head & Shoulders structure:
Left shoulder: Formed after the initial sharp sell-off
Head: A deeper liquidity sweep with strong rejection
Right shoulder: Higher low, showing sellers losing momentum
Neckline / POC zone: Around the 4460–4470 area, where price is currently reacting
The breakout above the neckline confirms bullish intent. However, price is now trading around a POC (Point of Control), which is often prone to psychological reactions and choppy price action.
Key levels to watch
Bullish continuation zone
Holding above the neckline keeps the bullish structure valid.
A clean acceptance above the POC opens the door for continuation toward higher liquidity and Fibonacci extension targets.
Pullback & risk zone
Liquidity risk: 4333 – 4349
If the market fails to hold above the neckline, a deeper pullback into this liquidity zone is possible before buyers step back in.
Fundamental context
Gold’s recovery is driven by trade-war fears, geopolitical tensions, and expectations of looser monetary policy globally.
Central bank demand remains a key pillar supporting prices.
In 2026, gold performance will continue to be influenced by USD valuation, overall risk sentiment, and central bank policy decisions.
Lana’s trading approach
No chasing near the POC. Expect reactions and fake moves.
Prefer buying pullbacks rather than entering at highs.
If price holds above the neckline with strong structure, bullish continuation remains the main scenario.
If the neckline fails, wait patiently for liquidity to be taken lower before looking for new buy setups.
This analysis reflects Lana’s personal market view and is for study purposes only. Always manage risk carefully. 💛

XAUUSD – 3H Technical AnalysisXAUUSD – 3H Technical Analysis
✅ Lana is waiting for a pullback to enter safer BUY positions 💛
Trend: Strong bullish trend, continuously printing new highs
Timeframe: 3H
Current status: Price is moving vertically with no meaningful correction so far
Strategy: Do not chase price. Wait for a pullback into liquidity zones to look for BUY setups.
Market Context
During today’s Asian session, gold surged aggressively and moved close to the 4,500 level — a price area never seen before. The rally has been extremely steep, with almost no pauses or minor pullbacks, clearly showing that buying pressure is dominating the market.
From a fundamental perspective, expectations of a continued dovish stance from the Fed are weakening the USD. At the same time, escalating geopolitical tensions are strengthening gold’s role as a safe-haven asset. The clean breakout above 4,375–4,380, followed by 4,400, has attracted additional momentum-driven and speculative flows into the bullish trend.
3H Technical Outlook
On the 3H timeframe, the bullish market structure remains very clear, and price continues to respect the rising channel. However, after such an extended and sharp move, entering trades at elevated levels becomes increasingly risky.
From Lana’s perspective, during phases like this, patience is far more important than chasing the market. Waiting for a proper pullback offers better risk-to-reward opportunities.
If buying pressure remains strong after a consolidation or corrective phase, higher upside targets around 4,580 are entirely possible.
Key Price Zones Lana Is Watching
🔹 Near-term BUY zone – Liquidity area
Buy around: 4,415
This is the nearest liquidity zone where price may return to “reload” before continuing higher. Lana will closely monitor price reaction and structure at this level.
🔹 Longer-term BUY zone – Deeper correction
Long-term Buy: 4,38x
If the market delivers a clearer and deeper pullback, this zone becomes a higher-probability area for safer medium-term BUY opportunities.
Trading Notes
Avoid chasing price during periods of excessive volatility
Only enter trades when lower timeframes form a clear structure in line with Dow Theory
Reduce position size and prioritise risk management during highly euphoric market conditions
📌 Follow Lana as we analyse XAUUSD together on a daily basis.

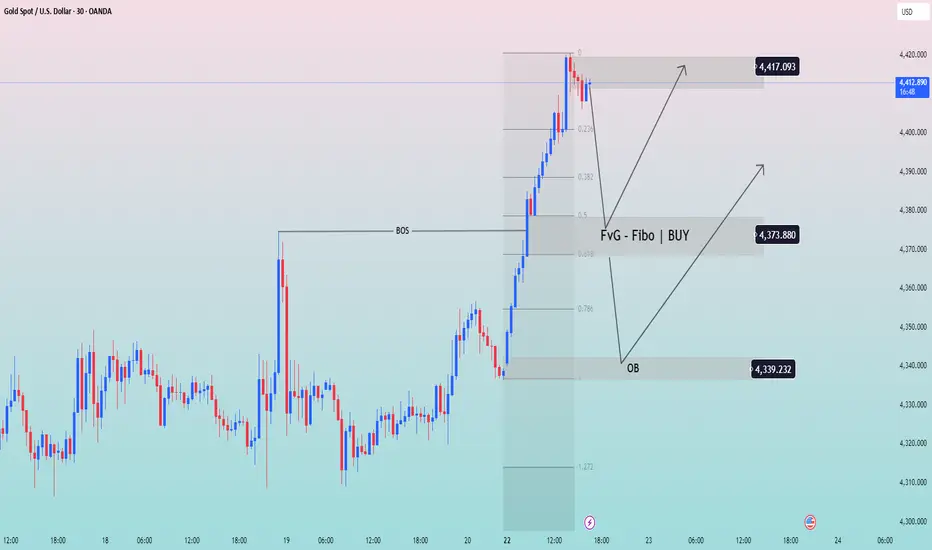
XAU/USD: Buy on BOS, FVG + Fibo retracement!◆ Market Context (M30)
Gold has just broken the rising BOS and created a strong push to the short-term peak area of 4,417. After the impulse, the market enters a pullback to rebalance—a common behavior before continuing the main trend.
◆ SMC & Price Action
• The rising structure remains valid (HH–HL).
• The FVG + Fibo zone (0.5–0.618) around 4,374 is the preferred area to look for buying pressure.
• The OB below ~4,339 is a deeper support area if the pullback extends.
• No bearish CHoCH yet → prioritize the bullish continuation scenario.
◆ Key Levels
• Nearest peak/resistance: 4,417
• FVG + Fibo (BUY zone): ~4,374
• Deep OB: ~4,339
• Invalid rise: clear break of 4,339
◆ Trading Scenarios
➤ Scenario A – Pullback BUY (priority)
• Wait for price to retrace to 4,374 (FVG + Fibo)
• Condition: rejection candle / maintain HL
• Targets:
▪ 4,397
▪ 4,417 (peak)
▪ extend if peak is broken
➤ Scenario B – Deeper Pullback
• If 4,374 is breached
• Monitor OB ~4,339 for buying reaction
• Only BUY with structural confirmation
➤ Scenario C – Break & Continue
• If price does not retrace deeply and holds above 4,397
• Follow the trend towards 4,417+
• Avoid FOMO at premium
◆ Summary
• Context: pullback in an uptrend.
• Decision zone: 4,374 → 4,339.
• Upper target: 4,417.
• Prioritize BUY according to structure, manage risk when price is at premium.
XAUUSD (H1) – Liquidity-Based Trading XAUUSD (H1) – Liquidity-Based Trading
Price has broken the channel, but buying momentum is weakening – waiting for a pullback to the trendline for entries
Today’s Strategy Summary
Gold has broken out of its price channel, but the key point is that buying pressure is fading after the strong acceleration. With the market approaching the holiday period and liquidity thinning, the focus is on trading at the right liquidity zones rather than chasing price or FOMO.
Plan:
Look for Buy opportunities on pullbacks into the trendline / old channel
Look for Sell reactions at the Fibonacci liquidity zone 4474–4478
1) Key Levels Today (from the chart)
✅ BUY zones (liquidity pullback)
Buy Zone 1: 4379 – 4382
SL: 4373
Buy Zone 2: 4361 – 4358
SL: 4353
These are clean liquidity areas to wait for price to retrace into – true liquidity-based trading: let price come back to reaction zones, do not chase highs.
✅ SELL zone (Fibonacci liquidity)
Sell zone: 4474 – 4478
SL: 4482
This is a premium + liquidity area. If price reaches this zone and fails to hold, the probability of profit-taking or a short-term reversal is high.
2) Main Scenario: Wait for a Pullback to the Channel/Trendline to Buy
After a breakout, the market often retests the old trendline or channel to confirm genuine buying strength.
As buying momentum is weakening, the likelihood of choppy moves and liquidity sweeps is high. Patience is key – wait for 4379–4382, or a deeper pullback into 4361–4358.
Expected targets (scalp / short swing):
Capture 8–15 USD moves depending on volatility, taking partial profits as price reacts according to plan.
3) Alternative Scenario: Sell Reaction at 4474–4478
If price continues to push higher into the Fibonacci zone, priority is to Sell on reaction rather than chasing Buy entries.
Only sell if there are signs of loss of momentum (long wicks, rejection, failure to close strongly above the zone).
4) News & Market Context: Thin Liquidity = Easy Sweeps
With the market nearing the holiday period, liquidity is weak, increasing the chances of spikes and stop-hunts.
Political and economic developments related to policy and tax matters are influencing corporate positioning, but at this stage, price is more likely to react to short-term capital flows rather than a sustainable trend.
Conclusion:
Today’s focus is “right zone – strict discipline”, avoiding mid-range entries and emotional trades.
5) Risk Management
Risk per trade: maximum 1–2%
Avoid trading when spreads widen or candles spike abnormally
Which scenario do you lean towards today?
A pullback to 4379 / 4361 for Buy, or a push to 4474–4478 for a Sell reaction?

XAUUSD – Lana prioritises Buy on pullbacksXAUUSD – Lana prioritises Buy on pullbacks 💛
Uptrend confirmed: Lana prioritises Buy on pullbacks 💛
Quick Summary
Trend: Strong bullish, no clear signs of correction
Status: New ATH has been established
Timeframe: H1
Strategy: Focus on Buy setups, waiting for pullbacks into liquidity zones
Market Outlook
Gold is maintaining a very strong bullish momentum and continues to print new highs. When drawing the price channel, price is currently testing the upper boundary, suggesting a potential minor reaction or a short-term pullback before the uptrend resumes.
The next Fibonacci target is around 4414, which may act as a short-term technical reaction zone. However, the primary trend remains bullish.
Technical Perspective
After a strong breakout, the market often revisits liquidity or value areas before continuing higher. Lana does not chase price at elevated levels; instead, she prefers waiting for technical pullbacks to enter trades in line with the dominant trend.
Preferred Buy Trading Plan
Buy Scenario 1 – Near-term liquidity zone
Buy: 4371 – 4374
SL: 4165
This zone contains strong liquidity and is suitable for looking for bullish continuation if price pulls back slightly.
Buy Scenario 2 – Deeper pullback zone
Buy zone: 4342 – 4339
SL: 4330
If the market corrects more deeply under year-end liquidity conditions, this is Lana’s preferred zone to look for a safer entry.
Fundamental View
Spot gold has surpassed the 4,400 USD/oz level for the first time, recording a gain of nearly 68% for the year.
The bullish momentum is not limited to gold but has also spread to silver and platinum, supported by:
Expectations of further Fed rate cuts
Strong inflows into ETF funds
Net buying by central banks
Escalating geopolitical tensions
The year 2025 is closing with a very impressive picture for the precious metals sector.
Lana’s Notes 🌿
Strong uptrend → prioritise Buy on pullbacks, avoid FOMO
Always set clear stop-loss levels and reduce position size during high volatility
If price does not return to the planned zones, Lana is comfortable staying on the sidelines

XAU/USD – Bullish Structure Intact, Buy Pullbacks Into DemandMarket Context
Gold continues to trade firmly within a rising trend channel, confirming that bullish momentum remains in control. The latest impulse leg successfully broke above the previous consolidation range, signaling strong participation from smart money.
From a macro perspective, expectations that the Federal Reserve will maintain a dovish stance and move toward rate cuts next year continue to support gold. As a result, current pullbacks are viewed as technical rebalancing, not trend reversal.
Technical Structure (H1 – Short-Term)
Market structure remains Higher Highs – Higher Lows
Price is holding above the ascending trendline
Current price action shows a pullback / rebalancing phase after expansion
No confirmed bearish BOS at this stage
Key Technical Zones
Upper liquidity / resistance:
4,410 – 4,420
Intermediate resistance:
4,374 – 4,384
Primary BUY pullback zone:
4,350 – 4,355
Deeper demand / trend defense:
4,330 – 4,335
Trading Plan – MMF Logic
Primary Scenario – Trend-Following BUY
Prefer waiting for price to pull back into 4,350 – 4,355
Look for price acceptance / selling pressure absorption
Expect continuation toward the upside with trend momentum
Target references:
TP1: 4,374
TP2: 4,384
TP3: 4,410+
Alternative Scenario
If price fails to pull back deeply and holds above 4,362, wait for a break & retest to rejoin the trend
Avoid chasing price in premium zones
Invalidation Level
A confirmed H1 close below 4,330 would weaken the short-term bullish structure and suggest broader consolidation.
Summary
Gold remains structurally bullish.
The current correction is a healthy pullback after expansion, not a reversal.
Bias stays BUY on dips, focusing on discounted zones aligned with the dominant flow.

XAUUSD – Lana Prefers BUY on Pullbacks to Fibonacci XAUUSD – Lana Prefers BUY on Pullbacks to Fibonacci 💛
Quick Summary
Short-term trend: Ongoing bullish continuation
Timeframe: H1
Market context: Thin liquidity ahead of the holiday period; price has not yet broken resistance decisively
Strategy: Prioritise BUY setups, waiting for a pullback to the 50% Fibonacci level
Market Context
Gold continues to hold its bullish momentum and is trading close to the all-time high area around 4350 USD/ounce. Although price has not yet fully broken the upper resistance, the overall bullish structure remains intact.
Gold’s upside is supported by weaker US labour data, expectations that the Fed may cut rates sooner, and rising geopolitical tensions, particularly concerns related to Venezuela ahead of President Trump’s upcoming speech.
With liquidity likely to remain thin due to the holiday period, price action may slow down. However, the primary bias still favours the upside.
H1 Technical Outlook
On the H1 chart, the bullish structure is well preserved. Price is consolidating just below a strong resistance zone, suggesting the market needs more time to absorb selling pressure.
The 50% Fibonacci retracement aligns with a support area that showed a strong reaction yesterday, making it a favourable zone to wait for a pullback and continue trading in line with the trend.
Intraday Trading Scenario
Main Scenario – Trend-following BUY
Entry: 4309 – 4312
SL: 4300
TP: 4330 → 4352 → 4390
Lana prefers to wait for a healthy pullback into this zone before entering, rather than chasing price near resistance.
Trading Notes
Thin liquidity → avoid large position sizes; focus on risk management
If price does not pull back into the planned zone, Lana is comfortable staying flat
Watch price reaction at resistance before expecting a breakout to new highs
Lana’s Note 🌿
Every setup is just one of many possible market scenarios. Lana always defines a clear stop loss and only trades when price reaches the pre-planned zone.

XAUUSD (H1) – Gold Trading Plan | 12/18 Waiting for CPI to ...XAUUSD (H1) – Gold Trading Plan | 12/18
Waiting for CPI to “set the direction” | Buy on a break above 4355, Sell if the trendline breaks
Strategy Summary (10-second read)
Ahead of the US CPI data, gold is likely to stay range-bound and only make a decisive move once there is clear structural confirmation. Price is still holding within an ascending channel, but volume is declining noticeably → priority is confirmed break trades, no FOMO.
Buy only if price breaks and holds above the strong resistance at 4355
Short-term Sell if the rising trendline breaks
Mid-term Sell if the key low at 4306 is broken
Key Levels (Important chart levels)
Major resistance: 4355 (the “gateway” for bullish confirmation)
Sell scalping zone: 4354–4355 (short-term reaction area)
Sell liquidity zone: 4392 (overhead sell-side liquidity)
Structural level / key low: 4306 (a break opens mid-term sell potential)
FVG / deep liquidity draw: 4248 (target if strong distribution occurs)
Scenario 1: Bullish Move
(Activated only if 4355 is broken)
Confirmation: Price breaks and holds above 4355 (preferably with a clear H1 candle close).
Buy entry: 4348
SL: 4340
TP1: 4355–4360
TP2: 4392 (sell-side liquidity zone)
Logic:
With declining volume, fake breakouts are common. Therefore, buys are only valid once price decisively clears the directional resistance at 4355.
Scenario 2: Short-term Bearish Move
(Preferred if the rising trendline breaks)
Confirmation: A clear break of the lower trendline of the ascending channel → sell the breakdown.
After the break, prioritise selling on a retest of the trendline / nearby resistance
Avoid chasing price at the lows
First target typically lies near the below-liquidity area around 4306
Logic:
The trendline acts as the “backbone” of the uptrend. Losing it during CPI conditions + weakening volume increases the probability of a fast sell-off to sweep liquidity.
Scenario 3: Mid-term Bearish Move
(If 4306 is broken)
Confirmation: A clear and decisive break below 4306.
At that point, mid-term sell positions can be prioritised based on structure
Expected targets:
Extension towards deeper support zones, with the 4248 FVG being a notable liquidity draw.
News Context (Why confirmation matters today)
The market is waiting for US CPI, a key inflation release that can shift expectations around the Fed’s rate-cut path. This directly impacts the USD and the next directional move in XAUUSD.
➡️ Today’s focus: wait for range breaks + strict risk control.
Risk Management
Maximum risk per trade: 1–2%
If stopped out: pause and wait for fresh confirmation (no revenge trading)
This analysis is shared for perspective and trading planning purposes only

XAUUSD – H1 TechXAUUSD – H1 Technical Analysisnical AnalysisXAUUSD – H1 Technical Analysis
Lana trades based on liquidity, with priority on price reaction 💛
Quick Summary
Market context: Midweek, gold liquidity is relatively weak as holiday sentiment starts to build
Timeframe: H1
Strategy: Buy at well-defined liquidity zones, sell psychological reactions at resistance
Expectation: No major USD news today, so strong volatility is unlikely
Market Context
The market is entering a “resting phase” as many traders begin to step back ahead of the holiday period, leading to a noticeable drop in liquidity. Today, there are no key US economic releases, so gold is likely to trade within a narrow range, with movements driven mainly by technical factors.
From a macro perspective, recent comments emphasising a clear separation between the White House and the Federal Reserve show that markets remain sensitive to inflation control. However, the short-term impact is limited, which fits a light, quick trading approach rather than holding positions for large moves.
H1 Technical View
On the H1 chart, price is moving around an equilibrium zone after previous fluctuations. Lower liquidity zones continue to provide solid support, while the upper side consists of psychological resistance levels that may trigger short-term reactions.
With weak liquidity conditions, Lana is not looking for strong breakouts. The focus remains on price reaction at clear and well-defined zones.
Intraday Trading Scenarios
Main Scenario – Buy with liquidity
Buy: 4302 – 4306
SL: 4298
This area shows a clear concentration of liquidity. If price revisits this zone and structure holds, a technical rebound is highly possible.
Secondary Scenario – Sell scalping at resistance
Sell: 4351 – 4355
SL: 4360
This sell setup is purely for scalping, taking advantage of psychological reactions near resistance. It is not preferred to hold sell positions for long under current market conditions.
Trading Notes
Weak liquidity → reduce position size, prioritise quick profits
Avoid expecting large moves in the absence of major USD news
Observe price reaction at key zones; avoid entering trades in the middle of the range
Lana’s Note 🌿
Each scenario represents just one of many possible outcomes in the market. Lana always prioritises account protection, uses clear stop losses, and is ready to stay out if price does not return to the planned zones.

XAUUSD (H1) – Gold Analysis for TodayXAUUSD (H1) – Gold Analysis for Today
Price has touched the resistance trendline, but the plan still prioritises BUY (VAL 4303–4306)
Strategy Overview
Gold is currently reacting at the resistance trendline, but there is not enough confirmation yet to call a bearish reversal. For now, the main plan remains to look for buys from the liquidity zone (Volume Profile – VAL). A strong trend shift will only be confirmed if price clearly breaks and closes above the trendline.
1) Technical View
Price is being pressed by the upper resistance trendline, so short-term volatility and wicks are likely.
However, the lower area is supported by Volume Profile (VAL), which favours a reaction-based buy strategy rather than FOMO entries in the middle of the move.
On the upside, there is strong liquidity around 4370, a zone where profit-taking or distribution can easily appear.
2) Trading Plan for Today (Clear Entry – SL)
Scenario A (Preferred): BUY using Volume Profile (VAL)
✅ Buy: 4303 – 4306 (VAL)
SL: 4295
Near TP: 4320 – 4330
Extended TP: Towards the 4370 liquidity zone if the trendline is broken successfully
Logic: VAL represents a “low value area” on the Volume Profile, which often attracts buying interest. As long as price holds this zone, the bias remains buy on pullbacks.
Scenario B: SELL at the upper strong liquidity zone
✅ Sell: Around 4370
SL: 4380
TP: 4330 → 4306 (return to the value area)
Logic: The 4370 level is a strong liquidity zone. If price reaches this area and fails to hold, it provides a textbook reaction-based sell setup.
3) Trend Confirmation Conditions
Strong bullish confirmation: When price breaks and closes an H1 candle clearly above the trendline. At that point, buy setups become safer, with targets towards higher liquidity zones.
If price continues to be rejected multiple times at the trendline, the priority is to wait for price to return to VAL 4303–4306 before buying. Avoid chasing price.
4) Fundamental Context
CIBC: Weaker US employment data may push the Fed to cut interest rates earlier next year, which is typically supportive for gold in the medium term.
Silver prices breaking higher due to tight supply and rising demand suggest that precious metals flows remain strong, meaning gold can experience sharp liquidity-driven moves.
💬 Which scenario are you leaning towards today?
Buying at VAL 4303–4306, or waiting for price to reach 4370 to sell the reaction?

XAUUSD – Overall Market View (12/16) XAUUSD – Overall Market View (12/16)
Strategy Summary
Gold is holding its ground, but the main direction is still unclear because today comes with a series of high-impact news. My approach today is “wait for confirmation before entering”, with two clearly defined scenarios:
Bullish confirmation: Break and hold above 4320
Bearish confirmation: Break and hold below 4271
1) Key Price Levels on the Chart
4320: Bullish confirmation level + resistance / upper FVG zone
4370 – 4373: Strong liquidity zone → preferred area to look for SELL reactions
4271: Bearish confirmation level (support break)
Lower zone (based on structure / trendline): Deeper support area where price may react and bounce, as marked by the arrow on the chart
2) Today’s Trading Scenarios (Trade the Level Style)
Scenario A – Bullish (Only valid if price breaks above 4320)
If an H1 candle closes clearly above 4320, gold is likely to move up and test the upper liquidity zone.
Preferred approach: wait for a pullback and BUY short-term, following the move (as shown by the arrow).
Avoid FOMO buys in the middle of the move.
Reasonable target: 4370 – 4373 (Strong Liquidity).
Note: The 4370 – 4373 zone is highly likely to see selling pressure, as large liquidity is resting there.
Scenario B – Bearish (Confirmed if price breaks below 4271)
If price breaks below 4271 and fails on the retest, the bearish scenario becomes dominant (classic sell retest setup).
✅ Sell: 4271
❌ SL: 4280
🎯 Expectation: Price may extend lower toward deeper structural support zones.
3) Main SELL Setup at the Major Liquidity Zone
✅ Sell Entry: 4370
❌ SL: 4380
Logic: This is a Strong Liquidity zone where profit-taking and distribution are likely to appear.
➡️ Only SELL on confirmation and reaction — no chasing trades.
4) Today’s News (High Volatility Expected)
Today’s US data can cause sharp moves and stop hunts on both sides:
Average Hourly Earnings m/m
Core Retail Sales m/m
Non-Farm Employment Change
Retail Sales m/m
Unemployment Rate
Flash Manufacturing PMI
Flash Services PMI
My rule: Reduce position size before news. After the news, wait for the market to show direction, then trade around 4320 / 4271.
5) Risk Management
Do not enter trades in the middle of a noisy range.
Only trade at key levels with confirmation.
💬 Question for everyone:
Which scenario are you leaning towards today — break above 4320 or break below 4271?

XAUUSD – Lana Prefers SELL, BUY Only for Short-Term ScalpingXAUUSD – Lana Prefers SELL, BUY Only for Short-Term Scalping 💛
Quick Summary
Short-term trend: Downward pressure dominates
Timeframe: H1
Strategy: Focus on SELL; BUY only for quick scalping at liquidity zones
Note: Today features multiple US data releases and events, so volatility may be higher than usual
Market Context
The market enters the session with a dense news flow: US Presidential speech, unemployment rate, seasonally adjusted Non-Farm Payrolls, and Retail Sales.
In such conditions, gold often experiences strong swings and liquidity sweeps before moving in the main direction. Therefore, Lana prioritizes selling at higher zones and only takes short-term BUY positions when price reaches clear support zones.
Technical Outlook
After the previous upward move, the H1 structure shows weakening price action, indicating the possibility of a continued downward move.
Upper zones where short-term resistance converges are suitable for following the intraday SELL trend. Below, liquidity zones may trigger temporary rebounds, but Lana considers these only for scalping and does not hold positions for long.
Intraday Trading Scenarios
Main Scenario – Trend-Following SELL
Sell: 4308 – 4312
SL: 4320
This is Lana’s preferred zone today. If price retraces into this area and shows rejection, the downtrend is likely to continue.
Buy Scenario 1 – Short-Term Scalping at Nearby Support
Buy: 4253
SL: 4240
This BUY is only for short swings, with quick profit-taking when price reacts.
Buy Scenario 2 – Scalping at Deep Liquidity Zone
Buy: 4213
SL: 4200
This is a stronger liquidity zone. If price drops quickly here during news, a technical rebound is possible, but Lana maintains the view not to hold BUY positions for long.
Session Notes
Asian & European sessions: Price may fluctuate and create technical retracements
US session: Strong news-driven volatility can sweep both sides before a clear direction emerges
Each scenario represents a probability, not certainty.
On high-news days, Lana always reduces position size, sets clear SLs, and is willing to skip trades if price does not reach the expected zones.

Waiting for OB Reaction to Confirm the Next Move◆ Market Context (M30)
Price swept sell-side liquidity around 4,349–4,350 but failed to hold, indicating weakening buying pressure in premium. With a prior liquidity sweep at the lows and a bullish BOS, the current move is likely a rebalancing phase after liquidity absorption.
◆ SMC & Price Action
• Rejection after the upper sweep signals premium denial.
• The lower support zone marks the base of the prior bullish displacement (BOS base).
• OB + Fibo below act as an attraction zone for re-accumulation before direction is chosen.
◆ Key Levels
• Liquidity Sell: 4,349–4,350
• OB + Fibo (retest): 4,302–4,289
• Deeper support: 4,274
• Upper supply (if broken): 4,406
◆ Trading Scenarios
➤ Scenario A – Pullback BUY (Primary)
• Wait for a pullback into OB + Fibo 4,302–4,289
• Conditions: structure holds (no break of recent lows), bullish reaction
• Targets:
▪ 4,349
▪ Extension: 4,406
• Invalid if a clear break below 4,274
➤ Scenario B – Deeper Pullback
• If OB 4,302–4,289 is pierced
• Watch for reversal signals around 4,274
➤ Scenario C – Break & Continue (No FOMO)
• Only follow buys if price closes and holds above 4,350
• Monitor reactions at 4,406 for risk management/partials
◆ Summary
• Context: upper liquidity swept → favor pullbacks.
• Decision zone: OB + Fibo 4,302–4,289.
• Upside targets: 4,349 → 4,406.
• Avoid chasing price in premium.

XAUUSD H1 – POC 4295 & Fibonacci Sell 4373 XAUUSD H1 – POC 4295 & Fibonacci Sell 4373
Strategy Summary
Today, I am not chasing price. The XAUUSD trading plan focuses on two key “high-quality” zones on the chart:
POC (Volume Profile) around 4295 to look for BUYs in line with money flow.
Fibonacci level at 4373 to look for SELLs when price reaches the premium zone.
Key Levels
BUY zone (POC – Volume Profile): 4295 (major liquidity area)
SELL zone (Fibonacci reaction): 4373
Deeper buffer if POC breaks: 4238 – 4241
Invalidation level: 4191
Scenario 1 – Primary Plan: BUY at the Liquidity Zone (POC)
✅ Buy limit around 4295 (preferably wait for H1 candle confirmation)
SL: 4287 (below POC to avoid noise)
TP1: 4330 – 4338
TP2: 4370 – 4373 (near the Fibonacci sell zone)
Logic:
POC represents the “fair value” or balance point of the Volume Profile. Price often gets attracted back to this level to collect liquidity before deciding the next direction.
Scenario 2 – SELL on Reaction at Fibonacci (Premium Zone)
✅ Sell around 4373 (wait for reaction or loss of momentum, do not chase sells)
SL: 4382
TP1: 4338 – 4330
TP2: 4295 (back to POC)
Logic:
The Fibonacci premium zone is where profit-taking pressure often appears. If price spikes into 4373 but fails to hold, it usually offers a clean reaction sell setup.
Alternative Scenario – If POC Is Broken
If price breaks below 4295 and clearly closes an H1 candle under this level, I will not force buys. In that case, priority shifts to waiting for price to react at:
4238 – 4241, or
deeper towards the lower balance / POC zone.
Always keep in mind: 4191 is the invalidation level.
News Context (to Avoid Getting Stopped Out)
Trump’s concerns about economic impact “not fully priced in yet” may increase political risk and market sensitivity.
Comments from Williams (FOMC, New York Fed) on economic outlook could trigger short-term volatility in USD and yields, causing gold to fluctuate.
Tip: Avoid late entries during news spikes. Only execute trades when price reaches the planned zones.
Risk Management
Maximum risk per trade: 1–2%
Do not trade in the middle of the range. Trade only at key levels.
If you are also watching 4295 and 4373, share your view:
👉 Are you leaning towards a BUY on pullback or a SELL on reaction today?

XAUUSD – Lana waits for reaction at resistance, focuses on ...XAUUSD – Lana waits for reaction at resistance, focuses on zone-based trading
Quick Summary
Context: Early in the week with many high-impact news events. Gold opened strong and is now approaching a major resistance area.
Timeframe: H1
Strategy: No chasing price. Prefer waiting to buy at liquidity void (VL) zones and selling short-term pullbacks at higher resistance.
Expectation: Asian–European sessions may move sideways; stronger volatility is more likely during the US session.
Market Context
The year-end period is usually packed with economic data. This week, Nonfarm Payrolls, CPI, and Retail Sales are released close together, along with interest rate decisions from the UK, Europe, and Japan.
For gold, this environment often leads to sharp moves during the US session, while earlier sessions tend to consolidate or make shallow pullbacks as the market waits for news.
Technical View
After a strong rally at the start of the week, price is now trading around a key resistance zone. On H1, the price action at the Asian open has left a liquidity void (VL), which is Lana’s preferred area to wait for buy opportunities in line with the main trend.
On the upside, a descending trendline combined with Fibonacci extension levels is forming a strong resistance zone, suitable for a short-term corrective sell.
Trading Scenarios for Early Week
Main Scenario – Buy at the liquidity void (VL)
Buy: 4298 – 4302
SL: 4294
This is Lana’s preferred zone. If price returns to fill the liquidity void and the structure holds, there is a high probability of a bullish reaction in continuation of the broader trend.
Alternative Scenario – Short-term sell at higher resistance
Sell: 4367 – 4370
SL: 4376
This is considered a short-term corrective move when price reaches strong resistance. The sell is counter-trend, so strict risk management is required and positions should not be held for too long.

XAUUSD Trend holds wait to re buy on pullbackXAUUSD (H1) — Trend intact, waiting for pullback to re-buy at the right zones
Strategy Summary
Price continues to move in line with the bullish plan. Two buy entries were already captured, with price advancing around ~5 points. At this stage, the priority is not to chase price, but to wait for pullbacks into reaction zones to re-enter in the direction of the trend.
1) Trading Plan (H1)
✅ Buy Zone 1: 4262 – 4258
SL: 4250
Meaning: A shallow pullback zone. If price holds the bullish structure and reacts higher here, trend-following buys are preferred.
✅ Buy Zone 2: 4240 – 4235
SL: 4238
Meaning: A deeper pullback (better discount). If price sweeps this area and shows strong confirmation, this becomes a higher-quality buy zone.
Projected Targets (based on chart):
Near resistance: 4285
Extended target: 4304 – 4307
2) Fundamental / News to Watch
The Fed releases US household financial conditions data (Capital Flow Report Q3/2025).
Voting FOMC members & Philadelphia Fed President Paulson speak on the 2026 economic outlook.
The US threatens expanded seizures of Venezuelan oil tankers → geopolitical and energy supply risks may increase volatility, with gold prone to sharp spikes.
3) Technical & Behavioural View
Market structure remains bullish. After a strong impulse, a pullback is healthy before continuation.
Plan remains clear: buy only at predefined zones, no FOMO.
If price breaks below zones and closes H1 candles under SL levels, staying flat and waiting for a new structure is preferred.

XAUUSD H4 Lana Weekly AnalysisXAUUSD (H4) – Lana’s Weekly Outlook: Waiting for pullbacks to Fib 0.618 & 0.50 within major liquidity zones 💛
Higher-Timeframe Trend (D1)
Gold is revisiting the previous all-time high (ATH), but volume strength has not yet been convincing enough to confirm a strong breakout.
Primary Tracking Timeframe
Timeframe: H4
Method: Fibonacci + trendline + liquidity zones + support/resistance
Plan: Lana avoids chasing price and prefers to BUY at discounted areas around Fib 0.618 and 0.50.
Market Context for the Coming Week
US Treasury yields, especially on the long end, remain elevated, increasing short-term volatility in gold.
Fed commentary continues to signal a cautious stance, while political uncertainty in the US may make gold flows more unpredictable.
As a result, Lana prioritises trading clearly defined price zones rather than trying to predict every short-term swing.
H4 Technical View (Medium Term)
Gold’s current trading range is relatively wide. After a strong impulsive move, the market often needs a “cooling-off” phase to rebalance liquidity.
On H4, the two most important zones align between Fibonacci retracement levels and major liquidity areas, making them ideal zones to wait for pullbacks before continuing with the trend.
Key Price Zones Lana Is Watching
1) Buy Zone 1 – Fib 0.618 (Preferred)
Entry: 4216 – 4220
SL: 4210
This is a high-quality Fibonacci discount zone and an area where strong price reactions are likely if larger flows step in to support the trend.
2) Buy Zone 2 – Fib 0.50 + Strong Support (Deeper Buy)
Entry: 4171 – 4175
SL: 4165
This scenario plays out if price sweeps deeper liquidity before rebounding. Lana considers this a safer entry in terms of location, but it requires patience.
Trading Scenarios for the New Week
Primary Scenario – Trend-Following BUY on Pullbacks
Lana prefers to wait for price to retrace into 4216–4220, or deeper into 4171–4175, before entering trades.
If price reacts positively, upside targets will focus on rebounds towards higher resistance zones and the nearest recent highs.
Secondary Scenario – If Price Remains Elevated
If price stays in premium territory with strong volatility, Lana does not recommend late entries.
Instead, the focus is on observing price reactions and waiting for pullbacks into the predefined zones for cleaner, lower-risk execution.
Lana’s Notes 🌿
Every setup represents a probability, not a certainty.
Stop loss is always predefined, and position sizing should be moderate to withstand gold’s wide volatility.

XAUUSD Bullish Confirmation Buy the PullbackGold has delivered a clear bullish structure break and is currently holding firmly inside an ascending trend channel. The recent impulsive move confirms strong participation from smart money, while the current price action reflects a healthy pullback–continuation phase, not a reversal.
From a fundamental perspective, dovish Fed expectations and a lower-rate outlook continue to support Gold. This keeps downside moves corrective in nature and favors trend-following BUY setups.
📊 Market Structure & MMF Flow (H1)
• Bullish structure is confirmed with Higher Highs and Higher Lows.
• Price is retracing toward demand zones to rebalance liquidity before the next expansion.
• No bearish structure break has appeared so far.
💎 Key Levels – MMF Style
• Primary Buy Zone: 4,268
• Deep Buy Zone: 4,238 – 4,219
• Upside Targets: TP1 4,305 → TP2 4,324
🎯 Trading Scenarios
Primary Scenario – Trend BUY
Alternative Scenario – Continuation above 4,305
🧭 MMF Intraday Bias
Bullish above 4,238
Invalidation below 4,219

XAUUSD Lana is waiting for price to pull back into the FibonacciXAUUSD Lana is waiting for price to pull back into the Fibonacci discount zone, with 4285 as the key decision level
Idea Summary
Main trend: Bullish continuation, but a pullback into Fibonacci levels is possible before the next leg up
Timeframe: M30
Strategy: No chasing price; Lana waits for price to reach clear buy zones
Key level: 4285 is a strong resistance and a decisive level for next direction
Market Context
The Fed is placing strong expectations on rising labour productivity to ease the tension between growth, inflation, and the labour market. As a result, rate cut expectations for next year remain cautious. For gold, this environment often creates large price swings, making a zone-based trading plan essential.
Key Levels Lana Is Watching
4285: Strong resistance, major reaction zone
4265: Short-term target
4245–4248: Fibonacci-based buy zone combined with price imbalance
4210–4213: Liquidity buy zone if a deeper correction occurs
Trading Scenarios
Primary scenario – Buy on pullback into discount zone
Buy: 4245–4248 | SL: 4240 | TP: 4265 → 4285 → 4300
Secondary scenario – Buy at liquidity zone
Buy: 4210–4213 | SL: 4205 | TP: 4230 → 4255 → 4285
Each scenario is only one of many possible market outcomes. Lana prioritises capital protection, uses clear stop losses, and is comfortable skipping trades if price does not reach the planned zones.
Conclusion
4285 is the level to watch closely. Strong reactions are likely near this zone. A clean break and hold above 4285 could open the path toward 4300.
This is Lana’s personal view.
