IM LONG IN XAUUSD: HTF 0.5 Fibonacci Magnet in Play (4950–5000)*Gold is holding trendline support and targeting the 0.5 Fibonacci level of the higher timeframe.
What I Have Mentioned is the Clear HTF bias, defined by zone, defined reaction zone, which shows both bullish & corrective scenarios
****Strongly it educates, not hypes***
XAUUSD Price ( 4950 – 5000 ) remains the key upside zone if support continues to hold.
Market Context:
XAUUSD is currently trading around 4810, holding above a rising yellow trendline support.
Technical Confluence:
• Higher timeframe 0.5 Fibonacci retracement lies between 4950 – 5000
• This zone is marked as a major reaction area (highlighted rectangle)
• Trendline support + structure holding adds bullish probability
Price Expectation:
As long as the price respects the trendline support, gold can continue its move higher towards the 0.5 HTF Fibonacci zone.
The green and red projected paths indicate possible market reactions based on support and resistance behavior — not prediction, but preparation.
Trading Insight:
This is a buy-on-support, sell-into-resistance setup.
Strength near 4950–5000 must be watched closely for either continuation or rejection.
Let price confirm at HTF levels — patience pays more than prediction.
Golong

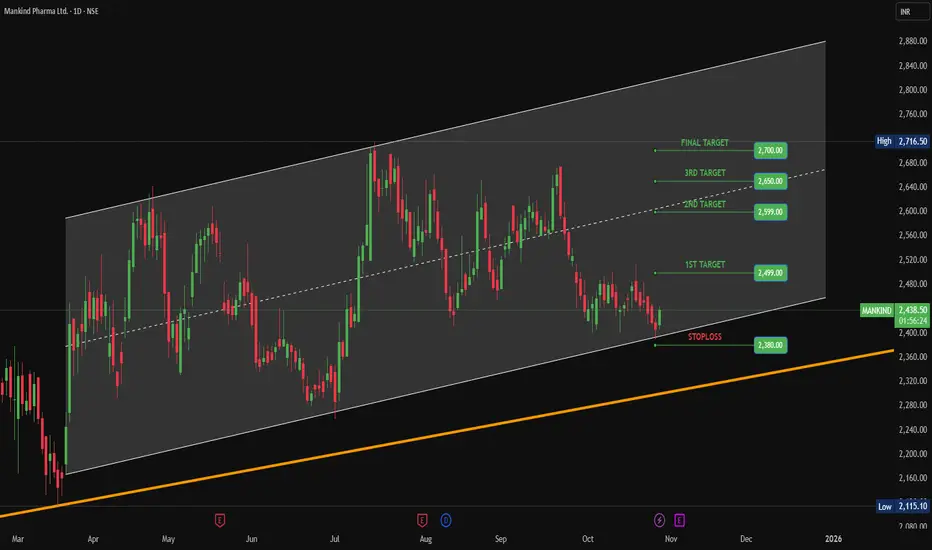
BUY MANKIND PHARMAMankind pharma at trend support level and already gives a strong breakout on candle stick pattern. Taking small Risk for big reward.
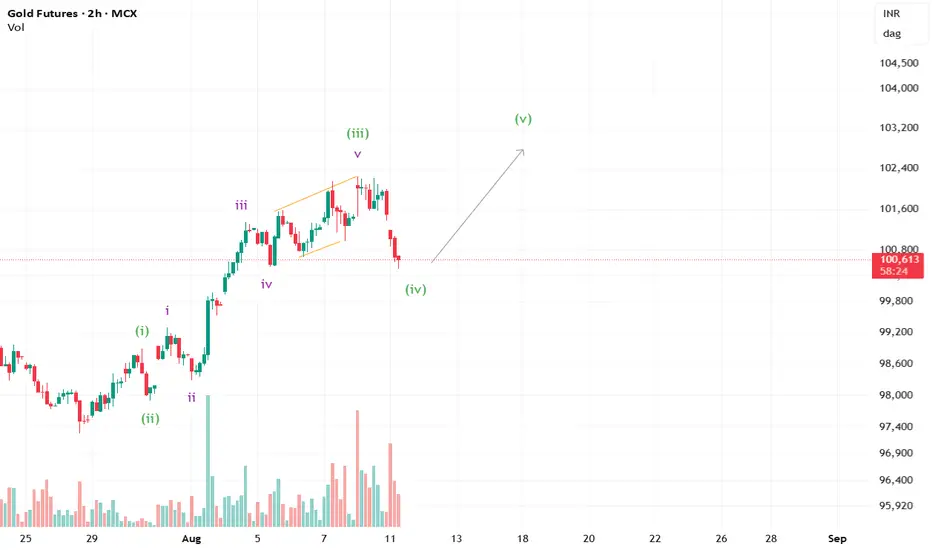
Bullish signs for Gold?Gold seems to have made a good corrective move for wave iv. We may see a new high in the coming sessions.
Emerging aerospace and defense manufacturer NSE:CYIENTDLM
Overview: NSE:CYIENTDLM is a leading electronics system design and manufacturing player in the aerospace and defense sectors and other high-tech engineering segments. It is attractively priced to enter into a short term trade.
Fundamentals: As it is a high growth company, it has high PE ratio of 88, however its financials supports its expensive valuation. Sales have grown by 44% and Profits have risen by 90% YoY. With a PEG ratio of 0.64, it is expected to grow at a fast pace.
Technicals: NSE:CYIENTDLM has been trading in the range of 600 - 700 for the past 9 months. It faces resistance at 700 level. If it crosses 700 and closes above it, it can target its next resistance which is at 800. The Relative Strength Index gives a bullish indication as the RSI line (green color) has crossed above the Signal line (yellow color) and the RSI is not in the overbought zone.
Strategy: When NSE:CYIENTDLM forms a green candle and closes above 700, you may enter into a long position with a stop loss at 650. When the stock reaches 800 - 810 range, you may exit your position. However those with higher risk appetite may exit position when it makes a fresh 52 week high.

Easy 20% return with Piccadily Agro IndustriesBSE:PICCADIL looks perfectly poised to give a solid 20% return to investors with a short term horizon.
Technicals: When we see the candlestick chart on a daily basis, it is trading at 750 which lies in between its nearest support at 700 and nearest resistance of 780. The MACD indicator points in the direction of an uprise with a healthy positive value.
Fundamentals: BSE:PICCADIL is a very fundamentally strong stock. It has high ROCE and ROE of 29.6% and 30.6% respectively. BSE:PICCADIL QoQ sales have increased by 62% and QoQ profits have increased by 121%. This shows it has got healthy growth going forward. Also its revenue mix is starting to be dominated by the distillery segment over its sugar segment. This showcases BSE:PICCADIL has diversified in the right direction, in turn unlocking more value for its shareholders.
Trade Setup: Buy BSE:PICCADIL when it hits 780, place a stop loss at 720 and a sell order at 960.

Medium term opportunity in Refex Industries for V.good upsideHi,
NSE:REFEX has given a Bullish Flag Breakout on Weekly charts with very good volume.
MACD is also on the bullish side on Weekly time frames. RSI is also on the bullish side on daily, weekly and monthly time frames.
In the current market scenario, I am expecting that the bullish momentum will continue.
Complete price projection like entry, stop loss and targets mentioned on the charts for educational purpose.
Don't Forget to Follow me to get all the updates.
Please share your feedback or any queries on the study.
Disclaimer: Please consult your financial advisor before making any investment decision.

Medium term trading opportunity in Black Box for V.good upsideHi,
NSE:BBOX has given a Bullish Flag Breakout on Weekly charts with very good volume.
MACD is also on the bullish side on Weekly time frames. RSI is also on the bullish side on daily, weekly and monthly time frames.
In the current market scenario, I am expecting that the bullish momentum will continue.
Complete price projection like entry, stop loss and targets mentioned on the charts for educational purpose.
Don't Forget to Follow me to get all the updates.
Please share your feedback or any queries on the study.
Disclaimer: Please consult your financial advisor before making any investment decision.

Medium term opportunity in Coromandel for >20% upsideHi,
NSE:COROMANDEL has given a Bullish Flag Breakout on Weekly charts with very good volume.
MACD is also on the bullish side on Weekly time frames. RSI is also on the bullish side on daily, weekly and monthly time frames.
In the current market scenario, I am expecting that the bullish momentum will continue.
Complete price projection like entry, stop loss and targets mentioned on the charts for educational purpose.
Don't Forget to Follow me to get all the updates.
Please share your feedback or any queries on the study.
Disclaimer: Please consult your financial advisor before making any investment decision.

Medium term opportunity in Oriental PG Electr for V. good upsideHi,
NSE:PGEL has given a Bullish Flag Breakout on Weekly charts with very good volume.
MACD is also on the bullish side on Weekly time frames. RSI is also on the bullish side on daily, weekly and monthly time frames.
In the current market scenario, I am expecting that the bullish momentum will continue.
Complete price projection like entry, stop loss and targets mentioned on the charts for educational purpose.
Don't Forget to Follow me to get all the updates.
Please share your feedback or any queries on the study.
Disclaimer: Please consult your financial advisor before making any investment decision.

SAIL will SAIL to the MOON 🌘🚀
SAIL is at 14 years resistance level. Volumes, RSI on monthly and weekly charts look very promising. A possible breakout on the cards!
Overall, metal sector looks well set for a rally in the next 1-2 years which makes SAIL a safe bet.
Keep a close watch and go LONG if it breaks out!

go long in Kennametal IndiaAn Inverted Head & Shoulder Chart Pattern Breakout happened on the Weekly Time frame of NSE:KENNAMET
Price Action supported by volume.
The stock is currently in uptrend making higher highs and higher lows.
One can add this stock into their stocks to buy list.
One can initiate the long trade as per the lavel mentioned on the chart
Stop loss will be on a Weekly closing basis.
Trend Analysis :- UP Trend
Chart Pattern :- Bullish Inverted Head & Shoulder Chart Pattern
Technical Indicator :- Positive MACD Crossover
Disclaimer: This is for Educational Purpose only.
KLong

Opportunity to go long in AEGISCHEM.since the zone of 440-444 has acted as a support/resistance zone previously, current price action showed rejection to the same zone and sustained above the same. with the better risk reward ratio we can go long with previous low as a SL With the above mentioned targets in the chart. Rsi is also near to oversold zone. so, would suggest to go long.
#ENTRY :- CMP (345-355)
#TARGET :- T1-361, T2-375, T3-386.
#SL :- day candle closing below 339.
THIS VIEW OF MINE IS PURELY BASED ON TECHNIAL CHART AND FOR EDUCATIONAL PURPOSE ONLY, BEWARE OF NEWS AND OTHER FACTORS WHICH CAN AFFECT THE MARKET SENTIMENT OR ANY PARTICULAR STOCK/SECURITY.
ALong

KOTAKBANKKOTAKBank broke out of descending parallel channel with good volumes on hourly/daily charts.
Could be bought with mentioned stoploss & target.

ABB INDIA LTD. inverse head and sholder pattern looking good for up side , just for eduaction porpose

BAJAJ FINANCE COMING TOWARD DEMAND ZONEI have been tracking this stock for last few weeks , as you can see price is coming toward its Demand zone,
so keep this stock in your watchlist to Trade for Reversal
We will wait for price to make some bullish reversal pattern ,so that we can take entry with confirmation
Also, we can accumulate this share for long term , as it is trading almost 25% down from its All time high (8050)

APLAPOLLO after breaking the previous highs APLAPOLLO looks good at this price. Gave a strong closing above the resistance zone, so, we can expect a good upside move. We can also consider this as a Double Top breakout, Go long with strict stop-loss for the given targets.

SUNPHARMA COULD GO TOWARDS ITS ALL TIME HIGHS.As far as sunpharma is above its weekly trend line, it is demonstrating the strength and can go towards its all-time highs. One can get into this trade, keeping a stop loss below the trend line. Do follow risk management rules and maintain proper position size.

Hikal in on the verge of breakoutHikal may go above in the coming days if it sustain the brakout. to target may 543-550

NIFTY ENGERGY ANALYSIS MONTHLY WEEKLY DAILYNifty Energy cooking something delicious dinner. Some stocks also behave like this. Keep eyes its Stocks to get more gain. Happy Investing & trading.

Astral buy above 2115Hello guys, last few days have been volatile so I was not giving many trades, seeing the market it is now better to take the trades on support rather than on breakout as most of them are failing.
Astral retraced 78.6% from last swing high.
Sitting above flip level
Near Demand/Supply conversion zone
Bounced from 200 MA cluster
Immediate resistance at 2095 - 2110
Buy above 2115
Targets mentioned in the chart above
Please LIKE, COMMENT and SHARE to motivate and support me. I'll keep on posting new ideas on Indices & Stocks. Be sure to follow so that you don't miss any good trades that might have been rewarding.
Any comments and critiques will be appreciated even if it's of opposite view as a trader can also be right so many times.

Reliance bullish swing above 2400Hello traders, no updates on the last stocks due to limited time I have right now.
Reliance has been following a supportive trendline for about 6 months and now it is following a resistance trendline for about 2 months, it is time for the intersection of these trendlines to complete the symmetrical triangle. When it gives a breakout from this triangle go long for the upper marked targets.
Buy above - 2400
Targets marked in the chart above
RSI in the bullish zone
MACD above signal line
Stock above 200 ma cluster
Above flip zone
Symmetrical triangles tend to be a continuation pattern and in this script I'll consider going long as a better opportunity.
Please LIKE, COMMENT and SHARE to motivate and support me. I'll keep on posting new ideas on Indices & Stocks. Be sure to follow so that you don't miss any good trades that might have been rewarding.
Any comments and critiques will be appreciated even if it's of opposite view as a trader can also be right so many times.

Astral bullish above 2290Hello traders, Astral gave a breakout of the channel and now looks bullish for the above marked targets.
Buy above - 2290
Targets mentioned in the chart above.
To motivate us to post more content, like and comment on the idea and share with the ones it'll benefit.

MSTC near DEMAND/SUPPORT ZONEAfter a big fall of nearly 130 points, MSTC is currently trading at/near Demand zone, we can also call it as support zone. Previously the same zone acted as a Résistance/Supply zone, which is indicated by red arrows, seen a strong rejection from upper level. After being in a channel for long time A strong Candle closing with huge volume can be seen in weekly chart. In bearish market we can see the price has respected the demand/support zone very beautifully and sustained over the important zone. In weekly timeframe we can see MORNING STAR Candlestick Formation on the Demand/Support zone which indicates the strong bullish Reversal after a downfall. Can go long for the given Targets of level 400 and 470 in midterm like 10-12 weeks. Go long with the Strict Stop-Loss of Level 320 (candle closing below basis).
ABOVE POSITION/ENTRY/VIEW IS SUGGESTED ON THE BASIS OF DEMAND AND SUPPLY ZONE OR SUPPORT AND RESISTANCE ZONE. TAKE THIS STUDY AS A EDUCATIONAL PURPOSE, DO YOUR ANALYSIS BEFORE TAKING/ENTERING INTO THE TRADE.
THIS VIEW OF MINE IS PURELY BASED ON TECHNIAL CHART AND FOR EDUCATIONAL PURPOSE ONLY, BEWARE OF NEWS AND OTHER FACTORS WHICH CAN AFFECT THE MARKET SENTIMENT OR ANY PARTICULAR STOCK/SECURITY.
MLong
