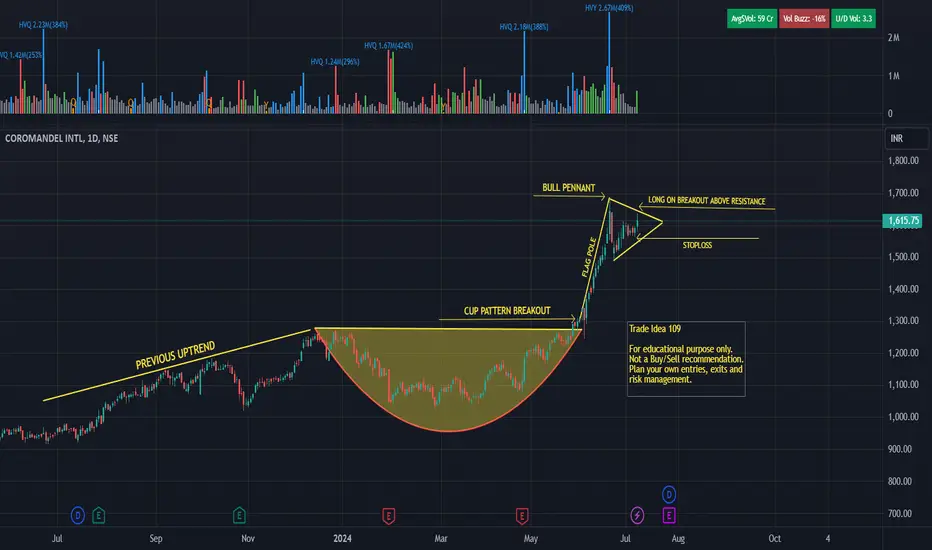
Coromandel - Bull pennant continuation patternCoromandel International - NSE
Higher Trade and Delivery Quantity.
Close crossing Lase Week High.
Outperforming Stock.
Disclaimer:
For educational purpose only.
Please do your own research before taking any trades.
Happy Trading!
Next report date
—
Report period
—
EPS estimate
—
Revenue estimate
—
55.80INR
16.42 BINR
138.75 BINR
120.15 M
About COROMANDEL INTL
Sector
Headquarters
Chennai
Employees (FY)
16.29 K
Website
Founded
1961
ISIN
INE169A01031
FIGI
BBG000CQ7FQ9
Coromandel International Ltd. engages in the manufacture and market of fertilizers and pesticides products. It operates through the Nutrient and Other Allied Business, and Crop Protection segments. The Nutrients and Other Allied Business segment consists of specialty nutrients and organic fertilizers. The Crop Protection segment produces insecticides, fungicides, and herbicides. The company was founded on October 16, 1961 and is headquartered in Chennai, India.
Bullish Price Action in Coromandel: A Long Opportunity?The one-day time frame chart of Coromandel International stock is looking gold due to strong price action. After a breakout, the stock started an upward move, forming higher highs and higher lows twice, which indicates a solid bullish price action. Recently, the stock traded at an all-time high of R

COROMANDEL 30-05-2024Happy learning with trading. I just shared my view. If correct give me one like. If not correct me.
Points to Note:
1) support from bounce and looking for breakout with good volume
2) Chart looks good and we can see ATH.
Disclaimer:
I am not a Registered Analyst with SEBI and it is only for educat

Coromandel International - Breakout Setup, Move is ON...#COROMANDEL trading above Resistance of 1456
Next Resistance is at 1680
Support is at 1239.80
Here is previous chart:
Chart is self explanatory. Levels of breakout, possible up-moves (where stock may find resistances) and support (close below which, setup will be invalidated) are clearly defin

THE BOWL PATTERN. Clean and simple once the stock breaks out.THE BOWL PATTERN. Clean and simple, this sleeper pattern takes off once the stock breaks out.
For the 2005 winners, the breakouts occurred on 52-week highs of the stocks' prices. In his book Encyclopedia Of Chart Patterns, Thomas Bulkowski tested and rated the various patterns, and the rounded, or

#COROMANDEL #NSE - CUP PATTERNCOROMANDEL INTERNATIONAL LTD
Completed CUP pattern in daily timeframe.
Breakout of resistance line.
Disclaimer:
For educational purpose only.
Please do your own research before taking any trades.
Happy Trading!

Coromandel Intl (NSE) - Potential Breakout and Uptrend ContinuatCoromandel Intl (NSE) has been on an upward trend for the past few months, with higher highs and higher lows. Recently, the price appears to have broken above a resistance level around ₹1,271.69, which could signal a continuation of the uptrend. Additionally, the trading volume on the day the chart

CoromendalThis stock up move as per the below prediction
1.21 Ema above 50 Ema
2.50 Ema above 200 Ema
3.Price above 21 EMA
4.21 Ema retrace
5.Stock in unmoved
5.ROCE >15
6.Debt to equity<1
This is for the educational purposes

Coromandel International all time highCoromandel int is all time high and near resistance and RSI (dwm) 70, 67 & 66

CoromendalThis stock up move as per the below prediction
1.21 Ema above 50 Ema
2.50 Ema above 200 Ema
3.Price above 21 EMA
4.21 Ema retrace
5.Stock in unmoved
5.ROCE >15
6.Debt to equity<1
This is for the educational purposes

See all ideas
An aggregate view of professional's ratings.
Trade directly on the supercharts through our supported, fully-verified and user-reviewed brokers.


Frequently Asked Questions
The current price of COROMANDEL is 1,624.95 INR — it has decreased by 0.04% in the past 24 hours. Watch COROMANDEL INTERNATIONAL LTD. stock price performance more closely on the chart.
Depending on the exchange, the stock ticker may vary. For instance, on BSE exchange COROMANDEL INTERNATIONAL LTD. stocks are traded under the ticker COROMANDEL.
COROMANDEL stock has risen by 1.21% compared to the previous week, the month change is a 6.70% rise, over the last year COROMANDEL INTERNATIONAL LTD. has showed a 63.30% increase.
We've gathered analysts' opinions on COROMANDEL INTERNATIONAL LTD. future price: according to them, COROMANDEL price has a max estimate of 1,670.00 INR and a min estimate of 1,025.00 INR. Watch COROMANDEL chart and read a more detailed COROMANDEL INTERNATIONAL LTD. stock forecast: see what analysts think of COROMANDEL INTERNATIONAL LTD. and suggest that you do with its stocks.
COROMANDEL reached its all-time high on Jun 20, 2024 with the price of 1,689.05 INR, and its all-time low was 146.35 INR and was reached on Feb 12, 2016. View more price dynamics on COROMANDEL chart.
See other stocks reaching their highest and lowest prices.
See other stocks reaching their highest and lowest prices.
COROMANDEL stock is 1.79% volatile and has beta coefficient of 0.96. Track COROMANDEL INTERNATIONAL LTD. stock price on the chart and check out the list of the most volatile stocks — is COROMANDEL INTERNATIONAL LTD. there?
Today COROMANDEL INTERNATIONAL LTD. has the market capitalization of 478.76 B, it has decreased by 0.57% over the last week.
Yes, you can track COROMANDEL INTERNATIONAL LTD. financials in yearly and quarterly reports right on TradingView.
COROMANDEL INTERNATIONAL LTD. is going to release the next earnings report on Jul 26, 2024. Keep track of upcoming events with our Earnings Calendar.
COROMANDEL earnings for the last quarter are 5.55 INR per share, whereas the estimation was 5.87 INR resulting in a −5.40% surprise. The estimated earnings for the next quarter are 13.23 INR per share. See more details about COROMANDEL INTERNATIONAL LTD. earnings.
COROMANDEL INTERNATIONAL LTD. revenue for the last quarter amounts to 39.13 B INR, despite the estimated figure of 43.79 B INR. In the next quarter, revenue is expected to reach 48.92 B INR.
COROMANDEL net income for the last quarter is 1.60 B INR, while the quarter before that showed 2.31 B INR of net income which accounts for −30.60% change. Track more COROMANDEL INTERNATIONAL LTD. financial stats to get the full picture.
Yes, COROMANDEL dividends are paid annually. The last dividend per share was 6.00 INR. As of today, Dividend Yield (TTM)% is 0.74%. Tracking COROMANDEL INTERNATIONAL LTD. dividends might help you take more informed decisions.
COROMANDEL INTERNATIONAL LTD. dividend yield was 0.56% in 2023, and payout ratio reached 10.75%. The year before the numbers were 1.36% and 17.52% correspondingly. See high-dividend stocks and find more opportunities for your portfolio.
As of Jul 27, 2024, the company has 16.29 K employees. See our rating of the largest employees — is COROMANDEL INTERNATIONAL LTD. on this list?
EBITDA measures a company's operating performance, its growth signifies an improvement in the efficiency of a company. COROMANDEL INTERNATIONAL LTD. EBITDA is 23.99 B INR, and current EBITDA margin is −40.87%. See more stats in COROMANDEL INTERNATIONAL LTD. financial statements.
Like other stocks, COROMANDEL shares are traded on stock exchanges, e.g. Nasdaq, Nyse, Euronext, and the easiest way to buy them is through an online stock broker. To do this, you need to open an account and follow a broker's procedures, then start trading. You can trade COROMANDEL INTERNATIONAL LTD. stock right from TradingView charts — choose your broker and connect to your account.
Investing in stocks requires a comprehensive research: you should carefully study all the available data, e.g. company's financials, related news, and its technical analysis. So COROMANDEL INTERNATIONAL LTD. technincal analysis shows the buy rating today, and its 1 week rating is buy. Since market conditions are prone to changes, it's worth looking a bit further into the future — according to the 1 month rating COROMANDEL INTERNATIONAL LTD. stock shows the buy signal. See more of COROMANDEL INTERNATIONAL LTD. technicals for a more comprehensive analysis.
If you're still not sure, try looking for inspiration in our curated watchlists.
If you're still not sure, try looking for inspiration in our curated watchlists.