Dalal Street Shaken Ahead of Monthly Expiry — What’s Next?Indian equity markets witnessed a sharp corrective move last week, with the Nifty sliding nearly 2.5% to close around 25,050. The sell-off came at a sensitive juncture—just ahead of monthly expiry.
Adding to the nervousness, India VIX jumped sharply by 24.8% to 14.19, signaling a sudden rise in uncertainty and trader caution.
A combination of geopolitical tensions, pre-Union Budget 2026 jitters, and mixed Q3 earnings weighed heavily on market sentiment, prompting profit booking across sectors.
◉ Technical Setup
Nifty is currently testing the lower end of its rising channel, a technically important area. A mild relief bounce is possible from these levels.
However, a decisive breakdown below the channel support could trigger another leg of sharp selling in the coming sessions, making this zone extremely crucial for near-term direction.
◉ Key Levels to Watch
Support Zones
25,000 – 24,900: Immediate psychological and technical support
24,500 – 24,400: Strong base with heavy put writer concentration
Resistance Zones
25,400 – 25,500: Immediate hurdle with significant call writing
26,000 – 26,100: Major supply zone and strong resistance
◉ Near-Term View
Volatility is likely to remain elevated in the coming week. While the broader structure has weakened, a short-term bounce from the 25,000 zone cannot be ruled out, given oversold conditions and strong psychological support.
That said, any recovery should be viewed with caution and may face stiff resistance at higher levels.
◉ Suggested Strategy
A cautious, stock-specific strategy is preferred for the week ahead. Short-term oversold signals may support a bounce, but the broader trend has weakened. Avoid aggressive longs and focus on protecting gains.
Goodluckcapital

Indian Markets on Hold: Nifty Awaits the Next Big TriggerIndian markets remained range-bound last week, with the Nifty ending on a flat note. Participants stayed cautious as volatility showed early signs of revival, with India VIX inching up to 11.37.
◉ Technical Setup
From a technical standpoint, the index briefly slipped below the rising wedge support, but the move failed to attract strong selling pressure. Nifty continues to consolidate in a narrow band, suggesting indecision rather than a trend reversal.
This phase of consolidation is likely to extend into the coming week unless key levels are breached.
◉ Key Levels to Watch
The broader structure remains unchanged from last week.
Resistance: 26,000–26,100
Strong call writing in this zone makes it a tough hurdle.
Support: 25,500–25,400
A solid put base is visible here, offering near-term support.
A decisive break below 25,400 could open the door for a sharp downside move, pulling the index closer to 25,000.
◉ Key Triggers for the Week
Q3 Earnings Season – Results from large and mid-cap companies across sectors will guide stock-specific action and influence overall market sentiment.
India–US Trade Deal – Comments or policy moves around trade negotiations, especially related to agricultural tariffs, could impact sentiment and sectoral stocks.
◉ Weekly Outlook
The near-term outlook remains neutral, with Nifty expected to trade within a defined range until a decisive breakout or breakdown occurs.
◉ Trader’s Insight
Until Nifty decisively holds above 26,000, aggressive long positions across the board should be avoided. A selective, stock-specific approach, backed by strict risk management, is better suited to the current market environment.

Dalal Street Bleeds: Where Is NIFTY Headed Next?Indian markets witnessed a sharp sell-off last week, with the benchmark NIFTY closing 2.45% lower, as weak global cues and rising uncertainty dragged investor sentiment.
Adding to the caution, India VIX NSE:INDIAVIX jumped nearly 16%, settling at 10.92 after hitting multi-month lows earlier. This sudden spike in volatility clearly signals growing nervousness among market participants.
◉ Technical Picture Turns Weak
For the past few weeks, we consistently highlighted the formation of a Rising Wedge pattern on the daily chart—typically a bearish setup.
With Friday’s close below the wedge support, NIFTY has now confirmed a downside breakout, indicating that further pressure may persist in the near term.
To add to the concern, a Double Top pattern has also emerged on the charts, strengthening the bearish undertone for the coming sessions.
◉ Key Levels to Watch
Resistance Zone: 26,000 – 26,100
This area has now turned into a strong resistance, backed by heavy call writing, making it difficult for NIFTY to move higher in the short term.
Support Zone: 25,500 – 25,400
This is the immediate support area to watch closely.
A decisive break below this zone could open the door for a sharp 500-point fall, pulling the index closer to the 25,000 level.
◉ Key Triggers for the Upcoming Week
Q3 Earnings Season Kicks Off
Market focus will be on IT majors—TCS NSE:TCS , Infosys NSE:INFY , HCL Tech NSE:HCLTECH , Wipro NSE:WIPRO , and Tech Mahindra NSE:TECHM —along with heavyweights like Reliance Industries NSE:RELIANCE and HDFC Bank NSE:HDFCBANK . Earnings numbers and management commentary will play a crucial role in shaping near-term sentiment.
US Tariff Verdict
The US Supreme Court’s ruling on January 14 regarding Trump’s tariffs remains a major overhang. This decision could act as a key directional trigger, not just for India but for global and emerging markets as well.
◉ Outlook for the Coming Week
With weak global cues, rising volatility, and clear technical breakdowns, the market is likely to remain highly volatile, with a negative bias in the near term.
◉ What Traders Should Do
With volatility on the rise and technicals weakening, aggressive long positions can quickly turn risky. Until NIFTY shows stability above key support levels, traders are better off staying cautious, protecting existing profits, and focusing only on selective stocks that continue to show relative strength rather than chasing broad market moves.

Buy APL Apollo TubesShort Term Trading Advice by Goodluck Capital
Buy APL Apollo Tubes
● Buy Range- 1940 - 1960
● Target- 2060 - 2080
● StopLoss- below 1890
● Upside Potential- 6% -7%
● Approx trade duration 12 - 14 days

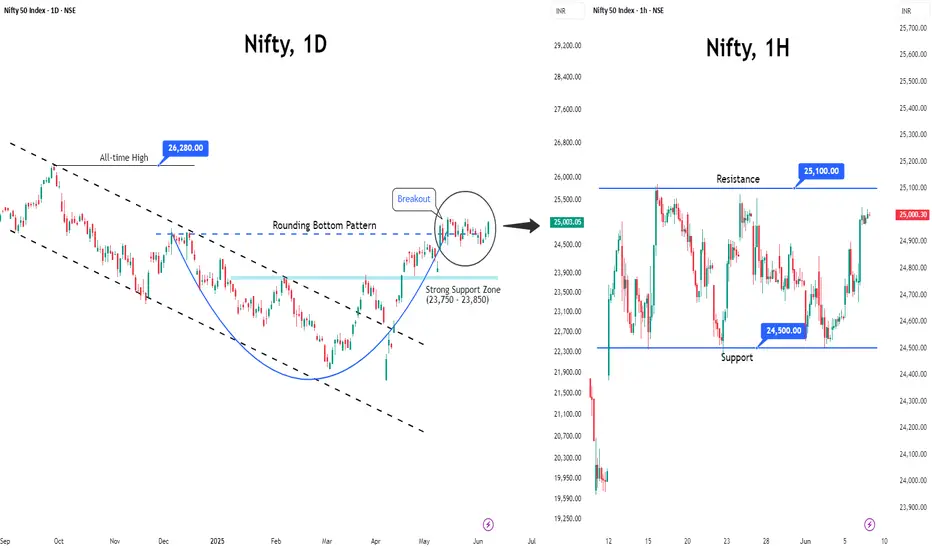
Nifty Hits a New Peak: Is the Next Leg Up Around the Corner?Indian equities kicked off the New Year with confidence, gaining nearly 1% and finally breaking out of a five-week consolidation phase. After a slow and mixed start, a strong rebound in the latter half of the week pushed the Nifty to a fresh all-time high of 26,329.
Volatility ticked up slightly, with India VIX rising 3.28% to 9.45, but it continues to remain at comfortable, historically low levels.
◉ Technical Outlook
As highlighted earlier, the Cup & Handle pattern has now taken a clearer shape. A decisive breakout and sustained move above the neckline could trigger the next leg of the rally.
◉ Key Levels to Watch
● Resistance: 26,500 – 26,600 (heavy call writing zone)
● Immediate Support: 26,100 – 26,200
● Strong Support: 25,900 – 26,000 (heavy put writing zone)
◉ Near-Term View
Nifty is likely to consolidate within a 300-point range, broadly between 26,200 and 26,500, as the market digests recent gains.
◉ Key Trigger to Watch
Global cues remain important. Markets will closely monitor developments after reports of US military strikes on Venezuela, which could influence sentiment in the coming sessions.
◉ Trading Strategy
Expect mild profit-taking at higher levels. Avoid aggressive fresh buying, protect existing gains, and stay selective by focusing on stocks showing relative strength.

NIFTY Set to Sign Off 2025 Quietly—Could 2026 Bring a Rally?As we enter the last week of 2025 and approach the first week of 2026, Nifty is doing something familiar—consolidating in a tight range.
Everything looks calm at first glance: volatility is very low (India VIX at 9.15), trading volumes are light, and price changes are small. But history shows that such calm often comes before a big move.
◉ What it means actually?
● Nifty near lifetime highs, but breadth remains weak
● Low volatility → calm market, but risk of sudden moves
● Traders aren’t chasing the market, they’re waiting for a trigger rather than pushing prices higher.
◉ Technical View
● From a technical standpoint, Nifty continues to trade within a rising wedge pattern, which carries bearish implications in the short term.
● Looking at the broader structure, a cup-and-handle pattern is forming, typically pointing to a potential upside move once the neckline is decisively breached.
◉ Important Levels to Watch
● Immediate Resistance: 26,100 - 26,200
● Immediate Support: 25,900 - 26,000
Strong breakout or breakdown from here will decide the next big leg.
◉ Looking Ahead
As 2026 begins, markets will closely track:
● FOMC minutes, which could influence global rate expectations.
● Rupee movement and FII flows, key drivers of short-term sentiment.
◉ Strategy Insight
Until fresh catalysts emerge, markets may stay range-bound as they digest year-end positioning. With volatility compressed, stock-specific strategies and relative-strength setups may offer better opportunities than broad index trades.

Buy Multi Commodity Exchange of IndiaShort Term Trading Advice by Goodluck Capital
Buy Multi Commodity Exchange of India
● Buy Range- 10475 - 10575
● Target- 11000 - 11200
● StopLoss- below 10180
● Upside Potential- 5% -6%
● Approx trade duration 12 - 14 days

NIFTY: Calm Before the Next Big Move?After a choppy end to last week, Nifty closed marginally lower, firmly stuck in a tight range of 25,700 – 26,100. Volatility has dipped sharply (India VIX near multi-year lows), which usually means calm before the next directional move.
◉ Technical Snapshot
Nifty continues to trade within a rising wedge pattern and has bounced back from its trendline support, suggesting buyers are still active at lower levels — but conviction is missing.
◉ Key Levels
● Immediate Support: 25,700 – 25,800
Strong put writing in this zone indicates solid downside support.
● Immediate Resistance: 26,000 – 26,100
Heavy call writing here signals supply and hesitation near the top.
◉ Short-Term outlook
● Bullish bias above 26,100: Could fast-track rally to new short-term highs.
● Stuck inside range: Expect sideways, choppy action with stock-specific moves.
● Break below 25,700: Risk of sharper correction increases.
◉ Trader’s Edge
This week is all about range resolution. Until Nifty delivers a clean breakout or breakdown, the smartest approach is to trade the range, keep tight stop-losses, and book profits without getting greedy.

NIFTY at a Pause: Consolidation Shapes the Near-Term TrendIndian equity markets ended the week on a slightly softer note, with the benchmark NIFTY slipping 0.53% on a weekly basis. While a supportive rate cut by the US Federal Reserve helped improve global sentiment and led to two consecutive sessions of gains, the broader trend remains mixed.
Adding to this, India VIX dropped 2.01% to 10.11, suggesting calm market conditions.
◉ Technical Setup: Key Pattern in Focus
On the daily chart, NIFTY is forming a rising wedge pattern and has recently bounced from its trendline support.
● Typically, a rising wedge reflects bearish undertones, especially near maturity.
● However, if the index manages to break above the upper resistance line and sustain, it could invalidate the bearish setup and shift sentiment positively.
● On the flip side, a decisive breakdown below support may open the door for a meaningful correction in the coming sessions.
◉ Important Levels to Watch
Based on open interest data, two critical zones are emerging as key for the current monthly expiry:
● Strong Support: 25,900 – 26,000
● Strong Resistance: 26,400 – 26,500
With no major triggers visible in the near term, NIFTY is likely to remain range-bound, consolidating between these levels.
◉ Strategy: Trade Smart, Stay Selective
Traders should maintain a moderately cautious stance in the current setup.
● Book or protect profits near higher levels.
● Avoid aggressive long positions until a clear breakout above 26,400–26,500 is confirmed.
● Prefer a stock-specific approach, focusing on names showing relative strength, while keeping risk management front and center.

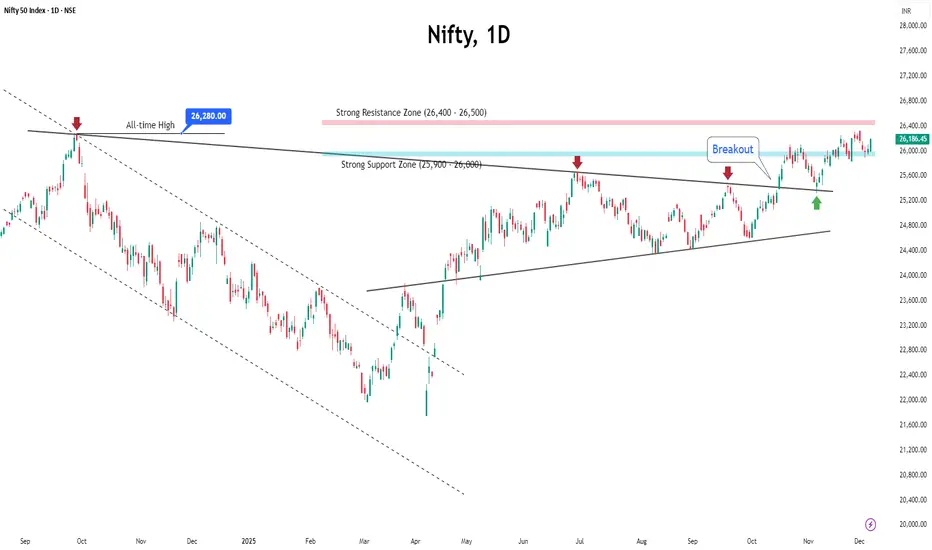
Nifty Holds Support — Is a Fresh Momentum Wave Ahead?The Nifty ended last week almost flat, up 0.6% at 26,186. The index started weak due to profit-booking, FII outflows, and a record-low rupee, but sentiment improved after the RBI cut the repo rate by 25 bps to 5.25%.
Adding to the positive tone, India VIX dropped over 11% to 10.315, highlighting a sharp cooling in volatility and a more stable trading environment.
◉ Technical Setup
Nifty has once again respected its strong support zone between 25,900 and 26,000, bouncing firmly from this level. This zone is expected to remain a key cushion for the coming week as well.
On the upside, the index faces a strong resistance around 26,400–26,500, which will be crucial to watch. A breakout above this could unlock further strength.
For now, the market is likely to trade within this range, oscillating between support and resistance until a clear signal emerges.
◉ Key Trigger This Week
US Fed Meeting (Dec 9–10)
Markets expect a 25 bps rate cut, but mixed signals from Fed officials keep uncertainty high.
A hawkish tone could weigh on global sentiment.
A dovish stance would likely support global markets, especially India.
◉ Suggested Strategy
Investors should adopt a balanced and selective approach:
Favour large caps and sectors that stand to benefit from the RBI rate cut, such as financials and autos,
Export and IT stocks may continue to draw support from the weaker rupee.
For traders, buy-on-dips remains the preferred strategy near strong support levels. Focus on stock-specific setups, maintain moderate position sizes, and stay flexible ahead of the crucial FOMC outcome.
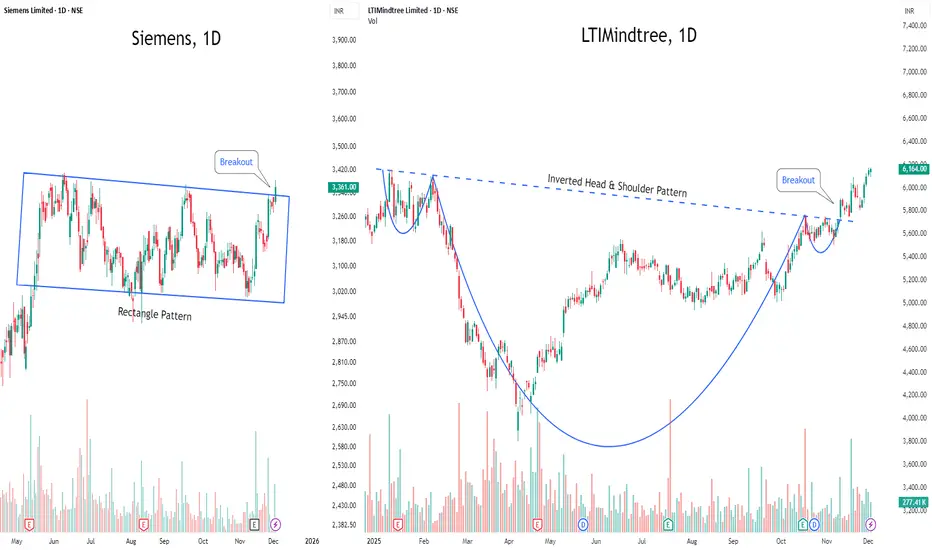
Breakout Radar: Two Stocks Turning Up the Heat This Week1️⃣ SIEMENS NSE:SIEMENS — Quiet No More
After chilling inside a rectangle range, SIEMENS just stepped out with a clean breakout.
The consolidation phase is done — now the chart is hinting at fresh upside energy. Momentum is officially back on the table. ⚡📈
2️⃣ LTIMINDTREE NSE:LTIM — Reversal Royalty
This one spent weeks building a textbook Inverted Head & Shoulder — and now it’s broken the neckline with style.
The breakout looks solid, and the stock is gearing up for a potential upside rally. 🚀💫
🔥 Two strong chart setups.
🔥 Two momentum-packed breakouts.
Perfect picks for traders eyeing action this week.
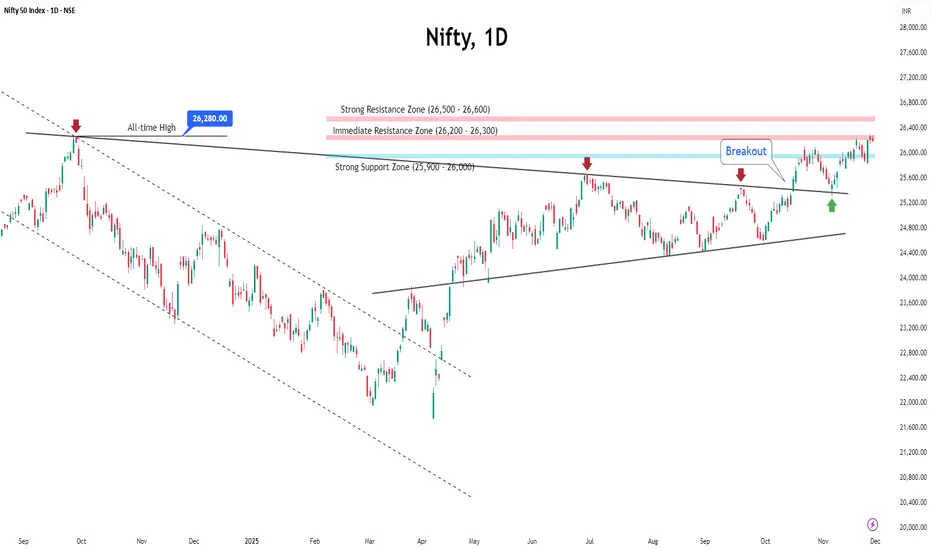
NIFTY Hits New Highs but Breadth Weakens — What’s the Signal?The NIFTY 50 closed the week with a neat gain of 134.80 points (0.52%), touching fresh lifetime highs of 26,310.45.
Sounds impressive, right?
Yes — but there’s a twist.
A deeper look shows the Nifty 500 is still over 2.5% below its all-time high.
Meaning? This rally is not broad-based — it’s being carried by select large-cap heavyweights.
Meanwhile, the India VIX dropped 14.77% to 11.62, keeping volatility calm… for now.
◉ Key Levels to Watch This Week
Support Zones
● 26,000 — Strong and immediate support. Heavy put writing is visible here.
Resistance Zones
● 26,200 – 26,300 — Near-term supply zone
● 26,500 — Major resistance to beat
◉ Key Triggers This Week
1. RBI Policy – December 5
A 25 bps rate cut is widely expected, but the RBI may take a cautious approach as it balances low inflation with rising growth momentum.
2. Q2 GDP at 8.2%
The stronger-than-expected GDP print boosts sentiment but reduces the urgency for aggressive rate cuts, shifting the policy outlook toward a more measured stance.
3. India–US Trade Deal
Both countries are close to finalizing the agreement by year-end, which could support IT, manufacturing and export-focused sectors.
4. Rupee Weakness
The rupee’s slide to ₹89.49/$ raises import costs and potential inflation risks, adding pressure on the RBI while impacting corporate margins differently across sectors.
◉ December Outlook — What’s Likely Ahead?
● Base Case: NIFTY stays in a 26,000–26,500 range, with most upside already priced in.
● Bull Case: A breakout above 26,500 could send it toward 26,700 by month-end.
● Caution: If market breadth weakens further, volatility may creep back in.
◉ Strategy:
● As long as NIFTY holds above 26,000, sentiment stays positive.
● Dips above 26,000 = buying opportunity
● Avoid chasing breakouts blindly — focus on quality sectors and high-volume confirmations.
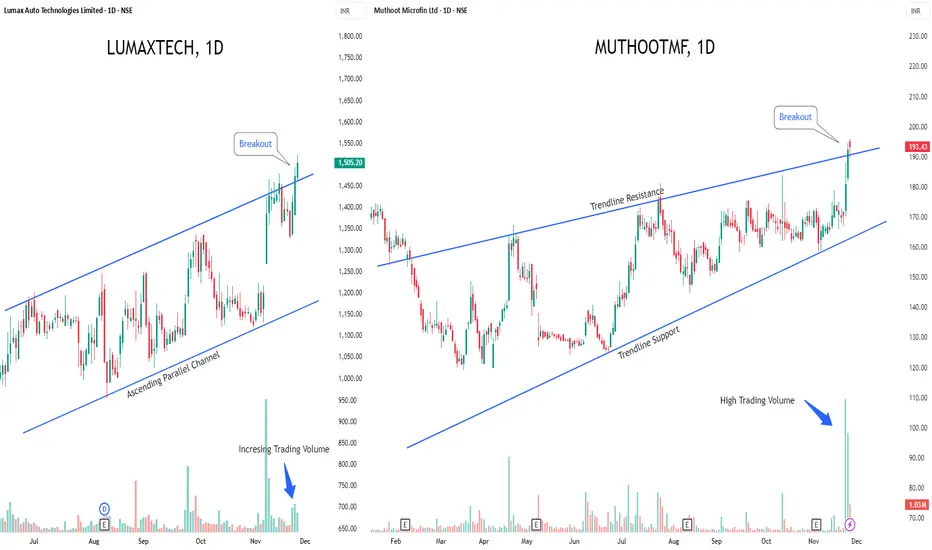
LUMAXTECH & MUTHOOTMF - Breakout Stocks to Watch This Week!1️⃣ Lumax Auto Technologies NSE:LUMAXTECH — Fresh Breakout Alert
Lumax is riding a strong uptrend and has cleanly broken above the upper boundary of its ascending parallel channel.
If this breakout sustains, the stock could see a sharp upside rally ahead.
Rising volumes are confirming strong buyer interest, giving this move an extra edge.
2️⃣ Muthoot Microfin NSE:MUTHOOTMF — Failed Rising Wedge, Strong Reversal Setup
A failed rising wedge pattern is playing out as the price has broken above the trendline resistance, flipping the structure into a bullish signal.
Even better — heavy volume buildup is reinforcing the strength of this emerging reversal.
⚡Both counters show early signs of momentum — watch for follow-through!
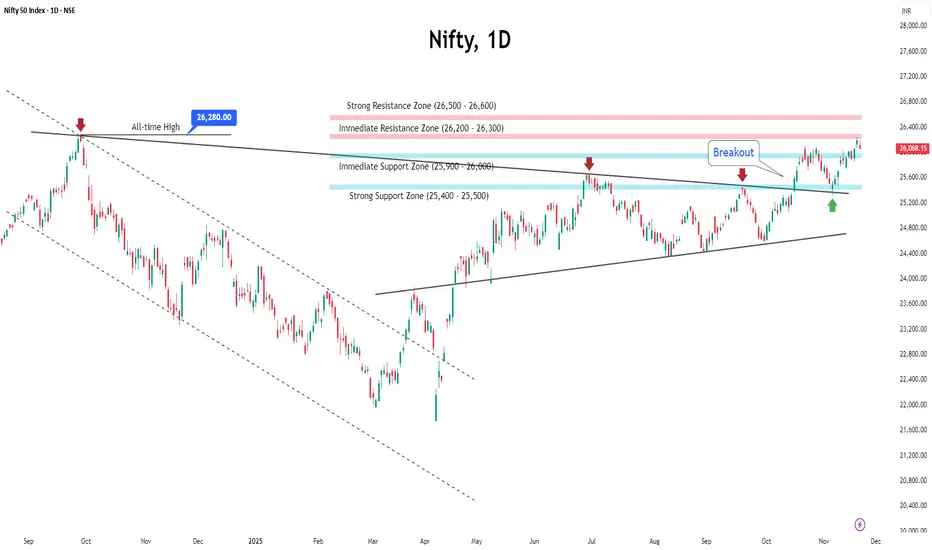
Nifty Breaks Above 26,000 — Can the Index Sustain This Strength?Indian markets ended the week on a positive note, with the Nifty rising 0.61% to close at 26,068. This came right after the index hit a fresh 52-week high of 26,246 on November 20 before cooling off.
Meanwhile, the India VIX jumped 14% to 13.63, reminding traders that volatility is quietly tightening its grip.
◉ Key Levels to Watch
Support Zones
Immediate support: 26,000.
Major support: 25,400 – 25,500, where strong put writing is visible
Resistance Zones
Near-term resistance: 26,200 – 26,300
Major resistance: 26,500
◉ Key Triggers This Week
Q2 GDP Data (Nov 28)
India’s GDP print for Q2 FY25–26 will be released this week.
Economists expect another strong reading, especially after Q1 GDP exceeded projections.
India–US Trade Deal Progress
Comments from Commerce Minister Piyush Goyal—hinting at “good news soon”—have lifted sentiment.
The proposed agreement aims to increase bilateral trade from $191 billion to $500 billion by 2030.
◉ Outlook & Strategy
For the coming week, a buy-on-dips approach remains favourable as long as Nifty sustains above 26,000.
A breakdown below this level could shift momentum, but for now, the bias stays positive with caution due to higher volatility.
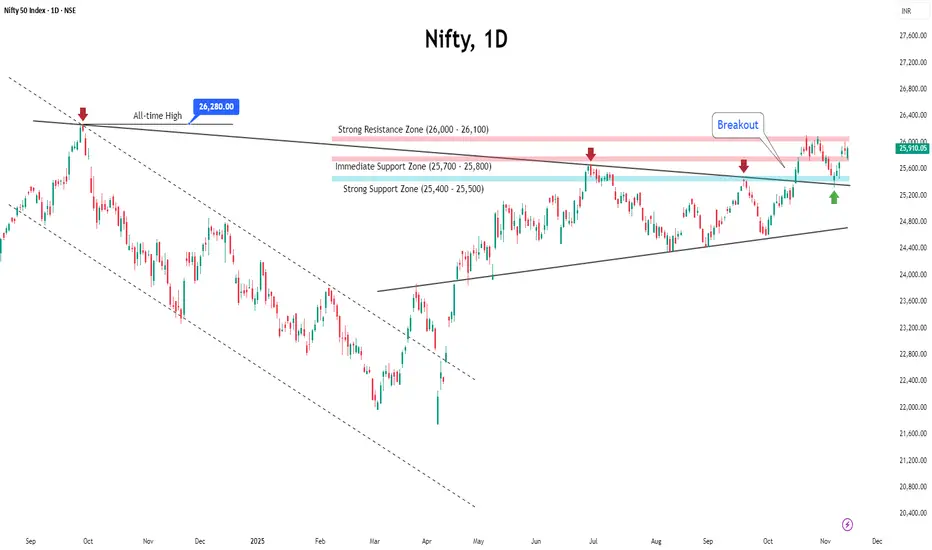
Nifty Builds Momentum, Breakout Looks Within ReachThe Indian market ended last week on a positive note, supported by the stronger-than-expected performance of the National Democratic Alliance (NDA) in the 2025 Bihar elections.
Nifty jumped over 1.5% to close at 25,910, just below the key resistance level of 26,000. Volatility also eased, with the India VIX falling over 5% on a weekly basis to settle at 11.93.
Open interest data suggests that the 25,700–25,800 zone will now act as immediate support, while 25,500 remains a strong support level.
Recent price action indicates that Nifty may attempt to break above the 26,000 resistance in the coming sessions.
In the week ahead, the overall sentiment is expected to stay positive due to strong domestic cues. Globally, market direction will depend on key U.S. economic releases, including the minutes of the latest FOMC meeting.
Investors should stick to a stock-specific approach, focusing on sectors supported by domestic demand. For traders, a buy-on-dips strategy remains favourable as long as Nifty holds above its key support zones.
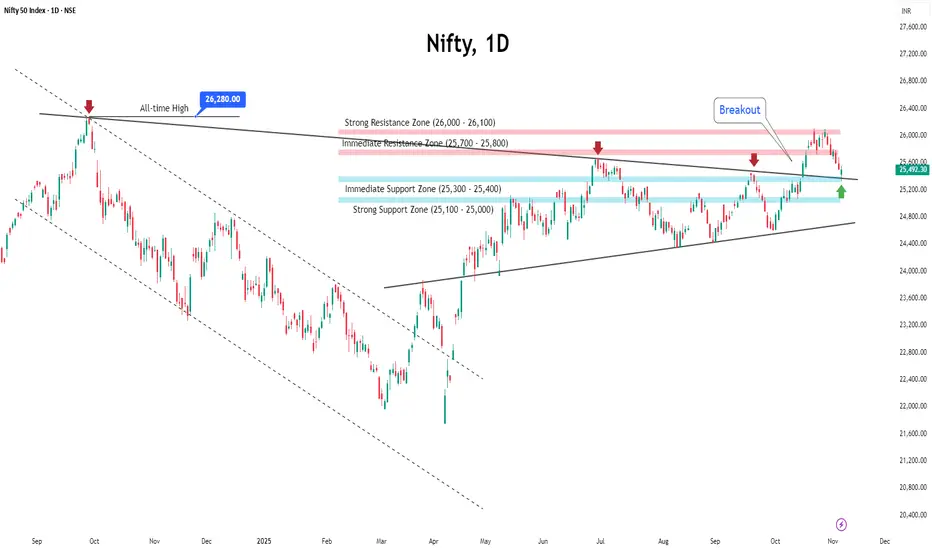
Nifty Slips for 2nd Week: Consolidation Ahead amid Rising VIXIndian markets ended lower for the second straight week, weighed down by persistent foreign fund outflows, mixed corporate earnings, and cautious global cues.
Nifty slipped nearly 0.8% to close at 25,490, while India VIX rose over 3% to 12.55, reflecting a slight uptick in market volatility.
Key Levels to Watch
Nifty is currently retesting the apex of its ascending triangle breakout, around the 25,300–25,400 zone. This area is supported by significant put writing, as reflected in recent open interest data, making it an important near-term support.
Below this, the next strong support lies near 25,000.
On the upside, the 25,700–25,800 zone could act as an immediate resistance due to heavy call writing, while 26,000 remains a major resistance level to watch.
Outlook
Given the current setup, markets are likely to trade within a neutral range in the coming week. Volatility may stay elevated as global uncertainties, FII outflows, and a busy flow of economic and earnings data continue to influence sentiment.
While near-term sentiment remains cautious, strong domestic macro fundamentals and steady corporate performance are expected to provide underlying support to the broader trend.
Traders are advised to stay stock-specific, focusing on banking and financials—particularly PSU banks—which continue to display relative strength.
Nifty Starts July Quietly; Sideways Action May ContinueNifty began the month on a subdued note, registering a net weekly loss of 176.80 points (-0.69%). Market volatility also eased, with the India VIX declining by 0.59% to 12.31, indicating reduced trader anxiety.
From a technical standpoint, an immediate resistance zone has developed between 25,500 and 25,650, while a key support range lies between 25,200 and 25,300.
Open Interest (OI) data adds weight to these levels, with a significant build-up of call writing at 25,500 suggesting strong resistance, and put writing at 25,200 indicating solid support.
Looking ahead, Nifty is expected to remain range-bound between these two zones unless a decisive breakout or breakdown occurs.

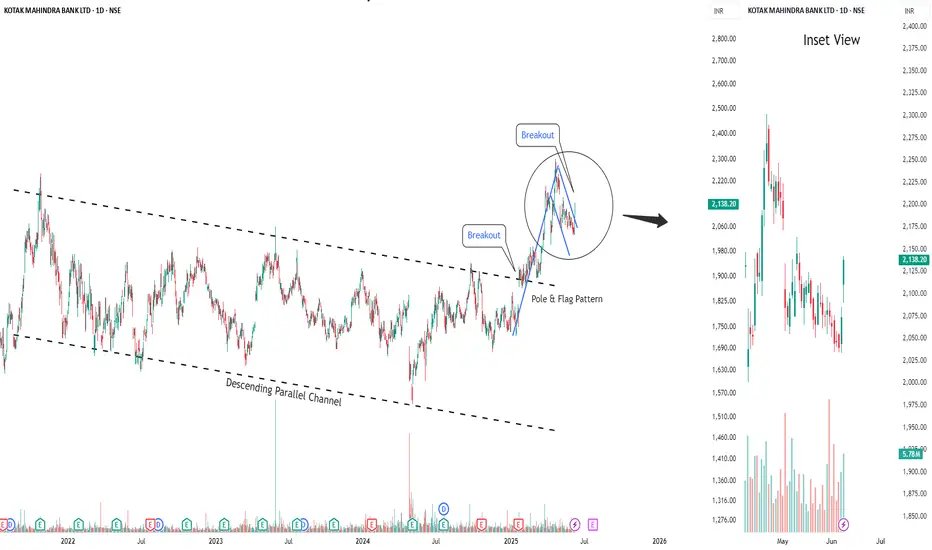
Nifty Continued to Rise, Bank Nifty Stands Tall at New Highs◉ Nifty Analysis NSE:NIFTY
Indian equity markets broke out of a five-week consolidation last week, powered by easing geopolitical tensions, which helped boost investor sentiment.
A Pole & Flag breakout on the charts signals a continuation of the uptrend, with strong bullish momentum building up.
Open Interest (OI) Snapshot
● 25,000 – Strong Base: Heavy put writing indicates strong support; bulls defending this level aggressively.
● 25,500 – Immediate Support: A secondary cushion with notable put buildup—short-term buyers watching this zone.
● 26,000 – Immediate Resistance Zone: Call writers active here; a breakout above this level could trigger a fresh leg up.
Outlook: The index looks set to maintain a bullish tone, with a possible move toward 26,000 in the coming sessions.
◉ Bank Nifty Analysis NSE:BANKNIFTY
The banking sector continues to lead the market’s strength, acting as a major driver behind the recent rally.
Fundamentally, optimism is being driven by lower funding costs, supported by banks cutting fixed deposit rates and the RBI’s recent cut in the Cash Reserve Ratio (CRR)—both of which have boosted liquidity and improved the outlook for lenders.
The index has confirmed a breakout from a Pole & Flag formation, aligning with Nifty’s bullish setup and further validating strength in the banking space.
Open Interest (OI) Snapshot
● 56,000 – Strong Support Zone: Significant put writing shows strong bullish conviction around this level.
● 57,000 – Immediate Support: Fresh positions being built; dip-buyers may step in here.
● 58,000 – Key Resistance Ahead: Call writers are holding the line—watch for breakout signals.
Outlook: As long as Bank Nifty holds above 57,000, the bullish momentum is expected to continue, with possible testing of 58,000 in the near term.

Buy Kotak Mahindra Bank Short Term Trading Advice by Goodluck Capital
Buy Kotak Mahindra Bank
Buy Range- 2100 - 2135
Target- 2200 - 2225
StopLoss- below 2060
Upside Potential- 4% -5%
Approx trade duration 7 - 8 days
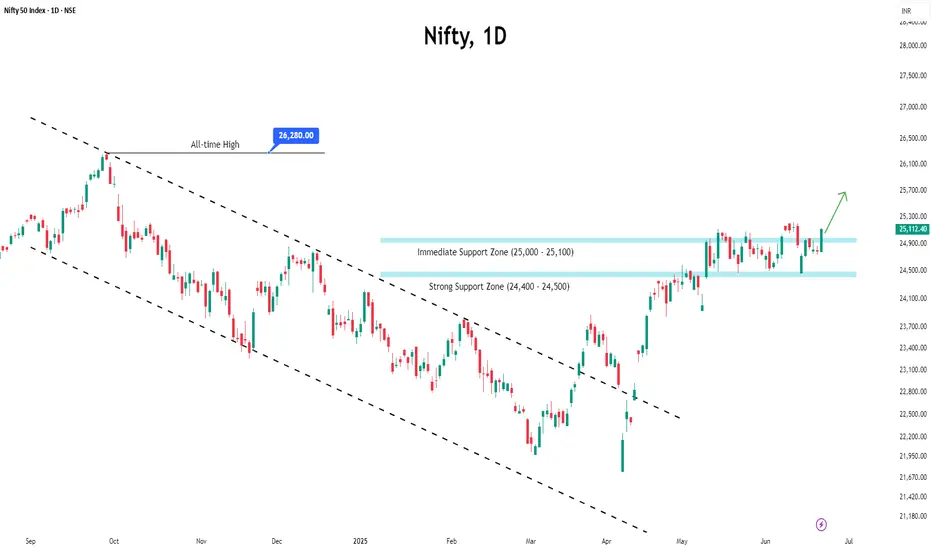
Nifty Eyes Upside as Bulls Take Charge Ahead of Expiry WeekThe Nifty closed around 25,112 on Friday, marking a 1.29% gain for the week and signalling strong bullish momentum. The rally was driven by broad-based buying, particularly in financial heavyweights like HDFC Bank, ICICI Bank, and Reliance Industries.
Despite lingering global uncertainties, market sentiment remained stable, with the India VIX closing at 13.67—reflecting subdued volatility and cautious optimism among participants.
In the derivatives space, the highest concentration of put writing at the 25,000 strike highlights strong immediate support, while the 25,500 level is emerging as a key resistance zone due to significant call writing activity.
Heading into the upcoming expiry week, the bullish trend is likely to continue, provided no major geopolitical shocks disrupt market sentiment.
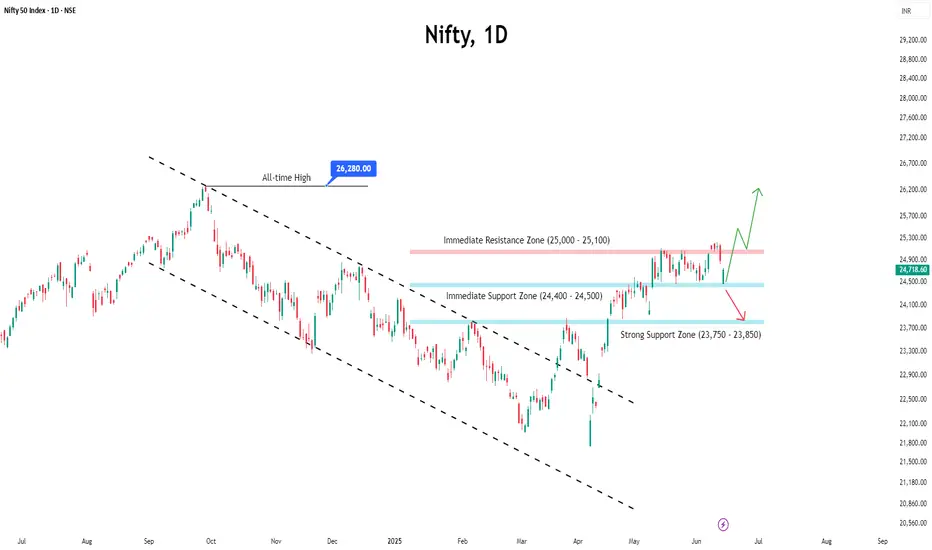
Nifty Weekly Outlook: Volatility Ahead Amid Global Tensions● Despite briefly breaking above the 25,100 resistance last week, Nifty failed to sustain the momentum and witnessed a corrective pullback towards the 24,500 level.
● Market volatility ticked up, with India VIX rising by 3.08% to 15.08 on a weekly basis, reflecting growing investor nervousness.
● Geopolitical tensions—particularly the escalating conflict between Israel and Iran—are weighing on global sentiment, and Indian equities are not immune to this uncertainty. However, relative strength in the Indian markets suggests that they may continue to outperform global peers in the near term.
● For the upcoming week, Nifty is expected to remain highly volatile, with wide-range oscillations likely. A directional trend may only emerge if Nifty decisively breaches 25,100 on the upside or breaks below the key support at 24,500.
● Options data indicates that the 25,000 level will act as a strong resistance, while 24,500 remains a crucial support zone.
● Importantly, if the index opens below 24,400 at the start of the week, it could invite further selling pressure, tipping the balance in favor of the bears.
● Given the global headwinds and sensitive technical setup, traders are advised to stay cautious as heightened volatility could dominate the week ahead.
Buy Venus Remedies Short Term Trading Advice by Goodluck Capital
Buy Venus Remedies
Buy Range- 423 - 438
Target- 470 - 480
StopLoss- below 406
Upside Potential- 9% -11%
Approx trade duration 12 - 14 days

Bulls on Standby: Can Nifty Unleash Its Next Leg Higher?As anticipated, Nifty consolidated within a 600-point range between 24,500 and 25,100 last week, ending with a modest weekly gain of around 1%.
Volatility eased as well, with India VIX declining by 9% to close at 14.63, reflecting improved market stability.
Open Interest (OI) data indicates immediate support at 24,800, backed by the highest concentration of put writing.
Looking ahead, there is a strong possibility that Nifty may breach the 25,100 resistance level in the coming sessions, which could trigger a swift rally toward the 25,500 mark.