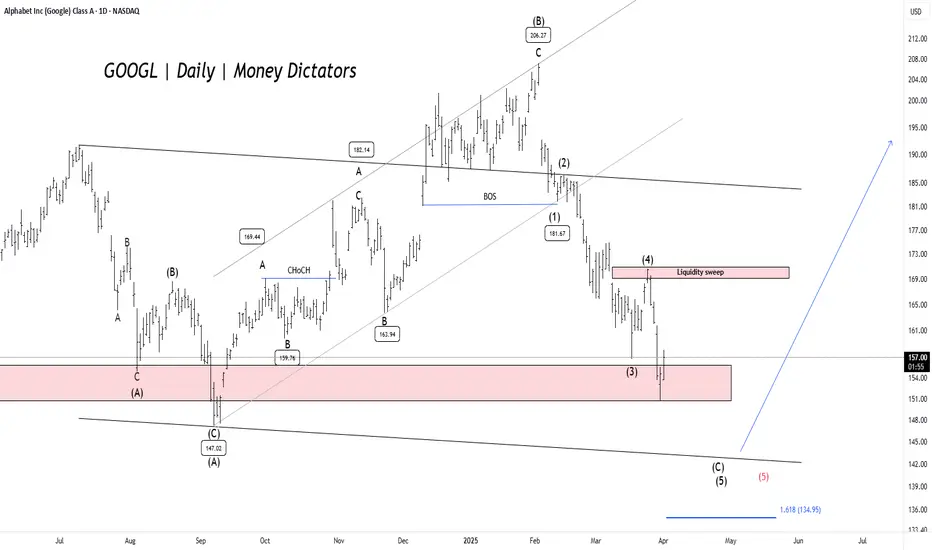
GOOGL - Elliott Wave Final ShowdownGOOGL has dropped over 27.28% , reaching a minor profit-booking zone. The $150 level serves as a key demand zone, where a potential price reversal could occur. The formation is either expanded flat or a running flat on the daily timeframe chart.
Confirmation is best observed near the lower trendline of the parallel channel. If bearish momentum persists, prices may decline further to the $142-$140 range before a strong rebound. Once the correction ends, the upside targets are $168, $180, and $195.
A new low will form if the previous low is breached. Further research will be uploaded soon.
GOOGLE - SWING TRADE IS GOING TO HAPPENGOOGLE - SWING TRADE IS GOING TO HAPPEN
Entry would be around 146 and SL is 130 for the target all time high.
Disclaimer: This is just for educational purpose.

EURUSD Levels // 20 MinHello Everyone 👋
Current Price
1.0850: This is the latest price level, reflecting the current market sentiment.
Resistance Levels
1.0880: The first resistance level, where selling pressure might increase.
1.0920: The second resistance level, indicating a stronger barrier for upward movement.
1.0980: The third resistance level, a significant hurdle for the bulls.
Support Levels
1.0820: The first support level, where buying interest might emerge.
1.0780: The second support level, indicating a stronger floor for the price.
1.0740: The third support level, a critical point for the bears.
Technical Indicators
Moving Averages: The 50-day and 200-day moving averages can provide insights into the trend direction.
Relative Strength Index (RSI): An RSI above 70 indicates overbought conditions, while below 30 indicates oversold conditions.
MACD (Moving Average Convergence Divergence): This can help identify potential buy or sell signals.
Market Sentiment
Economic Data: Keep an eye on upcoming economic releases from the Eurozone and the US, such as GDP, employment data, and inflation reports.
Geopolitical Events: Any significant geopolitical developments can impact the EUR/USD pair.

GOOGLE SETUP TRADE WIH 1:5 RISK REWARDGOOGLE SETUP TRADE WIH 1:5 RISK REWARD
A good BUYING setup detected on GOOG
It's showing a BULL MOVE due to these reason
1. It's following THE 30 M trendline here
2. It's ready to break the neckline
3. it forming a accending triangle pattern over here
Just grab out will your own risk
4. also in day chat its showing its trying to break the trendline
it will consolidate here but after breakout the upcoming move will be OSM
With a small amount
Stay connected
Stay happy

Google Long term target 200+Few months back it hits it lower support level of 88 and broken out of long term resistance level.
Now the long term targets are 150 - 175 - 190 - 210
View is for next 2-3 years.

Google Cup & Handle Pattern Google has formed Cup Handle Pattern on daily timeframe chart. This is bullish pattern, we can take swing trade here.
Entry:
We can go Long after close of bullish candle above the resistance zone as marked on chart.
Target:
Usually for Cup & Handle Pattern target is equal to the depth of cup, we are going to keep the target near the next resistance zone.
Stoploss:
We can keep the stoploss below the resistance zone.

Google ready for above 100 , cup and handle Google ready for above 100 , cup and handle chart pattern is being generating

alphabet whats next ! A CLOSE ABOVE 97$ WOULD LEAD TO AN UPWARD JOURNEY till 104 to the least as per chart!
support at 95$

APPLE whats next!support at 147.5 -148
while it cn make an upmove towards 163-165 region
the open low formation at support areas along with RSI divergence indicates strength in bullishness

Google in a Bear gripGoogle shares are being battered badly due to revenue miss and may continue for a while.
Currently its in oversold zone so shorting wont be a good idea. for uptrend to continue or reversal it needs to close above it resistance and close above it on monthly charts.
Below are possible support for the share in coming year
89 (first support)
72 (strong support)
64 (Super strong support)
The move in google shares will be very swift.

POSITIONAL - FALLING WEDGE PATTERN IN ANTONY WASTE HDG CELL LTD.NSE:AWHCL
AWHCL trading a little above life low and charts are signaling bullish reversal.
it has formed a falling wedge pattern and a breakout with good momentum is done.
now if it breaks the previous consolidated range/ or say previous swing high and managed to close a daily candle above 300 price then we can initiate new long position and the time frame would be 8-12 weeks to get our target levels.
All levels are marked on the chart.
"If you would like any more information feel free to DM me"
if you like this analysis please like and comment on idea.
happy trading & keep learning.

Google (GOOG) Stage AnalysisGoogle weekly TF chart - In Stage 4.
Only for educational purposes, not a buy/sell recommendation.

We have taken correct trade everytime in teslaIf you have taken trades according to the zone I specified you are in huge profit, right now the nearest resistance not imp, but still keep eye on at there... follow and support and suggest a stock in comment box

No words ,pure bull signsBand has strong fundamentals. Even technically if breaks the current level it's going to the moon:)

If you don't follow me, then you have missed 15%+ profitI had shared a entry point with take profit point here on my trading view account, you can check it, and follow me for more apportunity

Google (GOOGL) |The best area for correction♻️Hello traders, Google in daily timeframe , this analysis has been prepared in daily timeframe but has been published for a better view in 2 day timeframe.
The waves that we counted are the main waves 1 and 2 and the rest of the waves are related to the microwaves of the main wave 3.
From these microwaves, waves 1 and 2 are over and now we are inside wave 3.
Wave 3 itself forms Wave 4 at a lower level.
This wave has 4 triangular patterns, which is in its last wave, ie wave e, which has the ability to return from the same range and can even continue this downward movement up to Fibo 0.5.
To confirm further movement, it is necessary to break the current range (price 2660) downwards.
🙏If you have an idea that helps me provide a better analysis, I will be happy to write in the comments🙏
❤️Please, support this idea with a like and comment!❤️

Google (GOOGL) | The best point to buy🔥Hello traders, Google in daily timeframe , this analysis has been prepared in daily timeframe but has been published for a better view in 2 day timeframe.
In the wave count we had, the first wave 1 and 2 were formed, and now we are inside the wave of the main 3 wave.
From this wave, waves 1 and 2 are formed and wave 3 of wave 3 is being formed.
This wave 3 is inside its wave 4 wave and the wave 4 pattern is not clear, but the probability we give is in its last wave wave and we expect it to climb to Fibo 2.27 after breaking the trend line and then a downward movement will be formed for wave 4 from wave 3. .
The basis of the ascent for us will be the breaking of the green circle and the trend line . Also, this ascent can be part of the correction, and it should be said that another descent to the previous price floor will probably take place before this ascent.
🙏If you have an idea that helps me provide a better analysis, I will be happy to write in the comments🙏
❤️Please, support this idea with a like and comment!❤️

Google (GOOGL) | The best area to buy📍Hello traders, Google in daily timeframe , this analysis has been prepared in daily timeframe but has been published for a better view in 2 day timeframe.
According to our count, this share consists of the main waves 1 and 2, and the trend is within the waves of wave 3.
1 and 2 microwaves are composed of this wave and 4 and 5 microwaves are being completed.
That is, we are now inside wave 4 of wave 3 of wave 3.
Wave 4 is probably zigzagged, and from this zigzag the a and b waves are over, and now wave c is forming.
Wave c is probably in the form of a leading triangle, and a drop is needed to complete this triangle, which we think will end around Fibo 0.38 for wave 4.
And then the ascent for wave 5 from wave 3 to the range of 3000 and here wave 3 from wave 3 is completed and a relatively deep correction for wave 4 will begin.
🙏If you have an idea that helps me provide a better analysis, I will be happy to write in the comments🙏
❤️Please, support this idea with a like and comment!❤️

Star healthStar health Description:
1. buy when 15 min candle close above 796.45
2. huge sl 688.50
3. t1: 817.80, t2:843.95, t3:862.30, t4:880 , t5:903

Google (GOOGL) | The best area to buy🔥Hello traders, Google in daily timeframe , this analysis has been prepared in daily timeframe but has been published for a better view in 2 day timeframe.
According to our analysis, this is composed of the main waves 1 and 2, and the trend is within the waves of wave 3.
1 and 2 microwaves are composed of this wave and 4 and 5 microwaves are being completed.
That is, we are now inside wave 4 of wave 3 of wave 3.
Part of the downtrend we considered in the previous analysis has taken place and this wave is on Fibo 0.23 relative to wave 3 and also around a trend line .
This line is somewhat broken, but due to the weakness of the abrasives, there is a possibility of a price return.
We are still considering the previous target, Fibo 0.38, to reverse the trend to the price of 3000
And finally we will have a relatively deep correction for wave 4.
🙏If you have an idea that helps me provide a better analysis, I will be happy to write in the comments🙏
❤️Please, support this idea with a like and comment!❤️

✔️LIC Housing Finance-Overall analysiseverything mentioned in the chart.
something fishy
This is not a stock recommendation.Try to read the chart.

Google (GOOGL) | The best area to buy🔥Hello traders, Google in daily timeframe , this analysis has been prepared in daily timeframe but has been published for a better view in 2 day timeframe.
According to our count, this share consists of the main waves 1 and 2, and the trend is within the waves of wave 3.
This microwave consists of 1 and 2 microwaves and 3 wave 4 and 5 wave microwaves are being completed.
That is, we are now inside wave 4 of wave 3 of wave 3.
We assume that wave 4 will go down to Fibonacci 0.38 and then go up to Fibonacci 2.27 for wave 5 of wave 3.
(It is also possible to start an ascent from the same area first, with a maximum target of 3000, and then start the correction) Finally, we will have a relatively deep correction for wave 4.
🙏If you have an idea that helps me provide a better analysis, I will be happy to write in the comments🙏
❤️Please, support this idea with a like and comment!❤️

GOOG | A Good Buy Opportunity. Get ready!When it comes to GOOG Alphabet , right now it is in a downtrend and it is likely to get support at S1; which is near 2850. Since it is showing the bearishness, you might see a gap down. If gap down doesn’t happen, I wouldn’t recommend you to take the short position unless you get a pull back. When price reaches S1, you may go long while using S1 as a support area. And if you do, make sure to place the stop below the S1. Once you are in, you first exit should be at T1, which might act as a resistance area since we seen two strong rejections there.
If you find this technical analysis useful, please like & share our ideas with the community.
What do you think is more likely to happen? Please share your thoughts in comment section. And also give a thumbs up if you find this idea helpful. Any feedback & suggestions would help in further improving the analysis.
Good Luck!
Disclaimer!
This post does not provide financial advice. It is for educational purposes only! You can use the information from the post to make your own trading plan for the market. But you must do your own research and use it as the priority. Trading is risky, and it is not suitable for everyone. Only you can be responsible for your trading.
