Graphite India : VCP pattern ! Money may Double in 1.5 YearsHi Friends,
Graphite India looks promising now after ~08 years of time & price wise correction period. I am anticipating the stock to start its upward journey.
Chart Pattern : VCP
Targets, Stoploss & Entry price is mentioned in the chart .
Please feel free to share your views regarding this chart & analysis .
Note : I am not a SEBI registered advisor . Please consider my analysis only for Education purpose .
GRAPHITE

nderstanding Symmetrical Triangle Breakout in Grahipte India Ltd📈 Understanding Symmetrical Triangle Breakout in Grahipte India Ltd
Grahipte India Limited, currently trading near ₹438 on the monthly chart, has recently shown a sustained bullish breakout from a symmetrical triangle pattern. This setup is a classic continuation signal in technical analysis, especially when it occurs within an established uptrend. Let’s break down the concept, its importance, and the current opportunity with risk management considerations.
🔺 What is a Symmetrical Triangle Pattern?
Definition: A symmetrical triangle is formed when price action creates lower highs and higher lows, converging into a triangle shape.
Psychology: It reflects a period of consolidation where buyers and sellers are in equilibrium.
Breakout Direction: The eventual breakout (upward or downward) signals the next major move.
Volume Factor: A valid breakout is often accompanied by rising volume, confirming institutional participation.
🌟 Importance in an Uptrend
Continuation Signal: In an ongoing uptrend, a symmetrical triangle usually acts as a pause before continuation.
Bullish Breakout: When price breaks above the upper trendline, it indicates renewed buying interest and potential for further upside.
Market Sentiment: The breakout shows that buyers have absorbed selling pressure and are ready to push prices higher.
⚖️ Risk Management Criteria
Even strong breakouts require disciplined risk management:
Entry Zone: After a sustained breakout, traders often enter near the breakout level
Stop-Loss Placement: Below the lower trendline or recent swing low to protect against false breakouts.
Position Sizing: Allocate capital based on risk tolerance (e.g., risking 1–2% of portfolio per trade).
Confirmation: Look for monthly close above breakout zone with volume support before aggressive positioning.
📊 Current Opportunity in Grahipte India Ltd
Trend Context: The stock is in a monthly uptrend, and the breakout from the symmetrical triangle strengthens the bullish case.
Upside Potential: Based on technical projection, the height of the triangle can be added to the breakout point to estimate targets.
📝 Final Takeaway
The symmetrical triangle breakout in Grahipte India Ltd is a textbook example of consolidation followed by continuation in an uptrend. While the breakout offers a bullish opportunity, traders should respect risk management rules—enter near breakout levels, keep stops tight, and aim for logical targets.

HEG: Long consolidation breakout at 550HEG: CMP 550
Trend: Bullish.
Resistance: 612/683/727
Support: 520/496
Long consolidation breakout at 550. Needs volume to support sustained breakout.

Graphite India: Sparking the Next Electrode UpswingNSE:GRAPHITE
Company snapshot
India’s largest graphite electrode manufacturer; also produces specialty graphite, impervious graphite equipment, GRP pipes and high-speed steel.
Capacity of ~98,000 TPA across plants at Durgapur and Nashik; Germany plant closed. Utilisation stood at ~83% in FY25.
Investing in advanced carbon technologies; announced ~25,000 TPA capacity expansion (~123,000 TPA target).
Market context
Rising share of electric-arc-furnace (EAF) steel globally supports electrode demand.
US anti-dumping duty (~93.5%) on Chinese graphite improves non-Chinese producers’ competitive positioning.
Valuation & stock stats (Oct 2025)
Share price ~₹625; 52-week range ~₹365–₹638.
Market cap ~₹122 billion; P/E ~34; P/B ~2.1; dividend yield ~1.8%.
Peer: HEG and other electrode-cycle players.
Key fundamentals
Q1 FY26 results: Total income ~₹789 crore; PAT ~₹145 crore; EBITDA ~₹200 crore.
Business mix (FY25): Graphite & Carbon ~89%; Steel ~9%; Others ~2%.
Ownership: Promoters ~65% (no pledge); FIIs ~6.6%; MFs ~7.5%; DIIs ~9.6%.
Capacity & capex
Base electrode capacity ~98,000 TPA; plan to expand by ~25,000 TPA.
Expansion capex ~₹600–650 crore; timeline yet to be fully disclosed.
Technical view
Trend: Price is above 200-day moving average (~₹559); near 52-week high.
Support zone: ~₹480–₹510–₹546.
Resistance/breakout zone: ~₹630–₹640.
Strategy: Positive momentum; consider buying on dips with support around ₹540.
Actionable watch-points
Electrode price trends and needle-coke spread (core margin driver).
Execution of the ~25,000 TPA expansion—schedule, funding, payback.
EAF steel cycle developments in India and globally.
Policy/anti-dumping updates impacting Chinese graphite supply.
Capital allocation: capex vs dividend, progress in advanced carbon tech.
Key risks
Slowdown in EAF steel or electrode demand; sharp rise in raw-material (needle coke) costs.
Reversal of favourable trade or tariff policies.
Expansion delays or weaker‐than‐expected product mix shift to lower margin grades.
Stance
Fundamental: Strong balance sheet, favorable cycle exposure, expansion potential.
Technical: Bullish bias
⚠️ Disclaimer:
This analysis is for educational and informational purposes only.
We are not SEBI-registered analysts or advisors.
This is our personal view based on available data and market trends.
Please consult your SEBI-registered investment advisor before making any investment or trading decisions.
You are solely responsible for any financial decisions you make based on this content.
========================
Trade Secrets By Pratik
========================

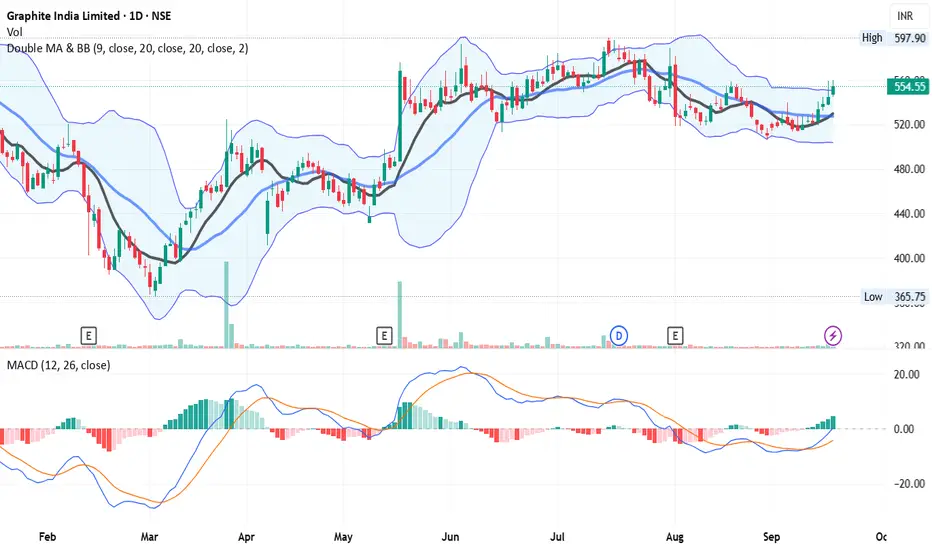
Breakout - Looks Good On Chart - GRAPHITE📊 Script: GRAPHITE
📊 Industry: Industrial Products (Electrodes & Refractories)
Key highlights: 💡⚡
📈 Script is trading at upper band of BB.
📈 MACD is giving crossover .
📈 Crossover in Double Moving Averages.
📈 Right now RSI is around 63.
📈 One can go for Swing Trade.
📈 In Monthly Chart It Script is forming Symmetrical triangle and about to give breakout, we can see good rally in future.
⏱️ C.M.P 📑💰- 555
🟢 Target 🎯🏆 - 578 / 597
⚠️ Stoploss ☠️🚫 - 539
⚠️ Important: Always maintain your Risk & Reward Ratio.
✅Like and follow to never miss a new idea!✅
Disclaimer: I am not SEBI Registered Advisor. My posts are purely for training and educational purposes.
Eat🍜 Sleep😴 TradingView📈 Repeat 🔁
Happy learning with trading. Cheers!🥂
Graphite India cmp 521.60 by Monthly Chart view*Graphite India cmp 521.60 by Monthly Chart view*
- Support Zone 455 to 490 Price Band
- Stock Price is well above the EMA 21, 50, 100, 200
- Stock Price has tested retested Support Zone well enough for Fresh Breakout
- Weekly Support at 445 > 380 > 310 with Resistance at 595 > 670 > 740 > ATH 815.90
- *Monthly Stock Chart indicative of good probability for a Fresh Upside Breakout basis Multiple Test Retest of the Support Zone*

GRAPHITEGRAPHITE seems good above 625... 625 is a hurdle... Once it crosses above this may attracted towards 800 levels

Graphite India Ltd - Breakout OpportunityDate : 24-Sep-2024
LTP : Rs. 598.15
Resistance Levels: (R1) Rs. 709 --> (R2) Rs. 815
Support Levels : (S1) Rs. 495
Technical View:
• NSE:GRAPHITE is in strong primary uptrend and was recently going through it's secondary downtrend within primary uptrend.
• After touching the high of 709.40 on 25-Apr-2024, it has retraced 32% to 485.15 level.
• NSE:GRAPHITE has breakout from it's secondary downtrend with higher than average volume. Breakout is also supported by increased volume in last few sessions.
• NSE:GRAPHITE is trading above both 20 DMA and 50 DMA since last few sessions. 20 DMA has crossed over 50 DMA on 23-Sep-2024.
• RSI is trading at 70.65. MACD is trading at 15.70. Both MACD and RSI is showing positive momentum.
• Looking good for a new swing from here.
Like the analysis? Boost/Like this idea and follow my ID.
Disclaimer : I am not a SEBI registered analyst/consultant and not recommending anyone to take any BUY or SELL position in stock market. Investing in stock market is risky and one should do a self analysis and validation before investing in stock market. My ideas are published for learning purpose only and are available to everyone at no cost/charge.

Just A View - GRAPHITE📊 Script: GRAPHITE
📊 Sector: Capital Goods-Non Electrical Equipment
📊 Industry: Electrodes - Graphites
Key highlights: 💡⚡
📈 Script is trading near at Neckline of Double Dottom on Monthly Chart.
📈 One can go for Risky Swing Trade for 66 points till resistance which is 755.
📈 Safe trader can buy only above 755.
BUY ONLY ABOVE 755
⏱️ C.M.P 📑💰- 688
🟢 Target 🎯🏆 - 939
⚠️ Important: Always maintain your Risk & Reward Ratio.
✅Like and follow to never miss a new idea!✅
Disclaimer: I am not SEBI Registered Advisor. My posts are purely for training and educational purposes.
Eat🍜 Sleep😴 TradingView📈 Repeat 🔁
Happy learning with trading. Cheers!🥂

Graphite India - Rounding Bottom Break Out At the Resistance area once above 660 will open up for 1040
Rounding bottom pattern breakout
Support / SL : 525

Graphite. Breakout stockInverse head and shoulder Break out and retest confirmation on weekly chart. W pattern on daily chart.
Buy price: 630
Follow base Trent line as stop loss.

Graphite - Any Dip is a Buy opportunityStrongly forming Higher High,
RSI confirns the Strength of Upmove.
Triangle Pattern Breakout on Strong Candle Basis.
Good to Hold for #shortterm to #longterm.
Have your own analysis and maintain your RISK REWARD!

GRAPHITE INDIA LOOKING GOOD FOR LONG Graphite India looking good for long, there is long time trend line break and seems W pattern emerging.

Graphite breakout on a weekly timeframeThe stock is exhibiting positive technical signals by trading above both the 20-day and 50-day Exponential Moving Averages (EMA). This suggests that the stock is experiencing upward momentum in the short and medium term. The crossover of the 20-day EMA above the 50-day EMA may indicate a potential bullish trend. The relatively low Price-to-Earnings (PE) ratio of 11.76 compared to the sector is a positive fundamental aspect. This could indicate that the stock is attractively valued, potentially presenting an opportunity for investors. However, it's essential to consider other fundamental factors and industry dynamics that might be influencing the PE ratio.
The breakout on the weekly timeframe is a significant technical development. Weekly timeframes are often used by traders and investors to identify longer-term trends. Confirming the breakout with increased trading volumes on the weekly chart would provide additional validation of the new trend direction.

GRAPHITE - Weekly chart, Reversal SetupThe analysis is done on Weekly TF hence price may take few weeks to few months in order to reach the targets. Trade setup is explained in image itself. This is a continuation breakout chart.
The above analysis is purely for educational purpose. Traders must do their own study & follow risk management before entering into any trade
Checkout my other ideas to understand how one can earn from stock markets with simple trade setups. Feel Free to comment below this or connect with me for any query or suggestion regarding this stock or Price Action Analysis.

Graphite India Limited - Long Setup, Move is ON...#GRAPHITE trading above Resistance of 494
Next Resistance is at 615
Support is at 344
Here is previous chart:
Chart is self explanatory. Entry, Resistances and Support are mentioned on the chart.
Disclaimer: This is for demonstration and educational purpose only. This is not buying or selling recommendations. I am not SEBI registered. Please consult your financial advisor before taking any trade.

Breakout in Graphite India Limited...Chart is self explanatory. Levels of breakout, possible up-moves (where stock may find resistances) and support (close below which, setup will be invalidated) are clearly defined.
Disclaimer: This is for demonstration and educational purpose only. This is not buying or selling recommendations. I am not SEBI registered. Please consult your financial advisor before taking any trade.

GRAPHITEGRAPHITE:- Wait for breakout, upside movement may be seen
Hello traders,
As always, simple and neat charts so everyone can understand and not make it too complicated.
rest details mentioned in the chart.
will be posting more such ideas like this. Until that, like share and follow :)
check my other ideas to get to know about all the successful trades based on price action.
Thanks,
Ajay.
keep learning and keep earning.

GRAPHITE - For Swing or Short termGraphite is looking good for swing or Short term.
More Strength above 425
Weak below 400
About Comapany :-
Graphite India Limited manufactures and sells graphite electrodes, and carbon and graphite specialty products in India and internationally. The company operates in two segments, Graphite and Carbon, and Others. It offers a range of graphite electrodes with various diameter and power for AC and DC furnaces. The company also provides extruded graphite in the form of rods and blocks, mini rods, graphite tubes, heat exchanger tubes, molded mold and isostatically moulded graphite, machined components of carbon and graphite, carbon graphite/bricks, and carbon composites/brake discs. In addition, it offers calcined petroleum coke, carbon electrode paste, graphite granules and fines, and carbonaceous materials to aluminum, steel, ferro alloy, and foundry castings industries; and impervious graphite heat exchangers, which are used as condensers, coolers, heaters, re-boilers, evaporators, interchangers, and graphite columns for distillation, absorption and scrubbing, ejector systems, and centrifugal pumps. Further, the company provides HCl synthesis and dry HCl gas generation units, and H2SO4/HCl concentration and acid dilution cooling units; bursting discs, thermos-wells, pipes, and pipe fittings; glass fiber reinforced plastic pipes, joints, and fittings; and high speed, alloy tool, and powder metallurgy steels for cutting tools. Additionally, it generates and sells electricity through a hydel power plant. The company was founded in 1962 and is headquartered in Kolkata, India. Graphite India Limited is a subsidiary of Emerald Company Private Limited.

GRAPHITE INDIA for 15% (approx..) GainGRAPHITE INDIA is for more than 15% . This trade is purely based on volume and support. volume is continuously increasing. This is a different way of trading based on volume. One can execute this. Don't forget CMP is trading below 200 EMA and the result coming.
CMP : 330
TG : 390
SL : 9 day EMA
R/R : 3 times (Risk to Reward)
Stock's selection based on 5 Point Analysis:
1: Idea : Breakout.
2: Support : Volume, Delivery & VWAP.
3: Technical : 9/21/55-EMA, RS<0, MACD, RSI & Super trend up.
4: Fundamental : PE, Industry & peer PE and sector performance.
5: Timing : Entry Timing on 2 hour chart.
Disclaimer : It is my personal view as a trader and for educational purpose only. Equity market involves risk. Please consult your financial adviser before taking any decision.

GRAPHITE - Ichimoku Bullish Breakout Stock Name - Graphite India Limited
Ichimoku Cloud Setup :
1). Today's close is above the Conversion Line
2). Future Kumo is Turning Bullish
3). Chikou span is slanting upwards
All these parameters are showing bullishness at Current Market Price
and more bullishness AFTER crossing 381
#This is not Buy and Sell recommendation to any one. This is for education purpose and a helping hand to learn trading in Market.
# Cloud Trading
# Ichimoku Cloud
# Ichimoku Followers
I hope you all like my analysis.
Please do share your thoughts into comment section.
Please give a like, share & subscribe for daily analysis.

GRAPHITEGRAPHITE:- Ascending triangle pattern formed, breakout given, keep your eye on the stock
Hello traders,
As always, simple and neat charts so everyone can understand and not make it too complicated.
rest details mentioned in the chart.
will be posting more such ideas like this. Until that, like share and follow :)
check my other ideas to get to know about all the successful trades based on price action.
Thanks,
Ajay.
keep learning and keep earning.

Trendline Breakout in Graphite India Limited...Chart is self explanatory.
Disclaimer: This is for demonstration and educational purpose only. This is not buying or selling recommendations. I am not SEBI registered. Please consult your financial advisor before taking any trade.
