GRASIM

GRASIMlooking for prolonged winters.
targets shared on our free channel mentioned in my trading view profile


GRASIM_TREND ANALYSISGRASIM MIGHT FALL 1-2% MORE AND RISE THEREAFTER.
BUY GRASIM ABOVE 950 FOR TARGETS 960/970/980 SL 935

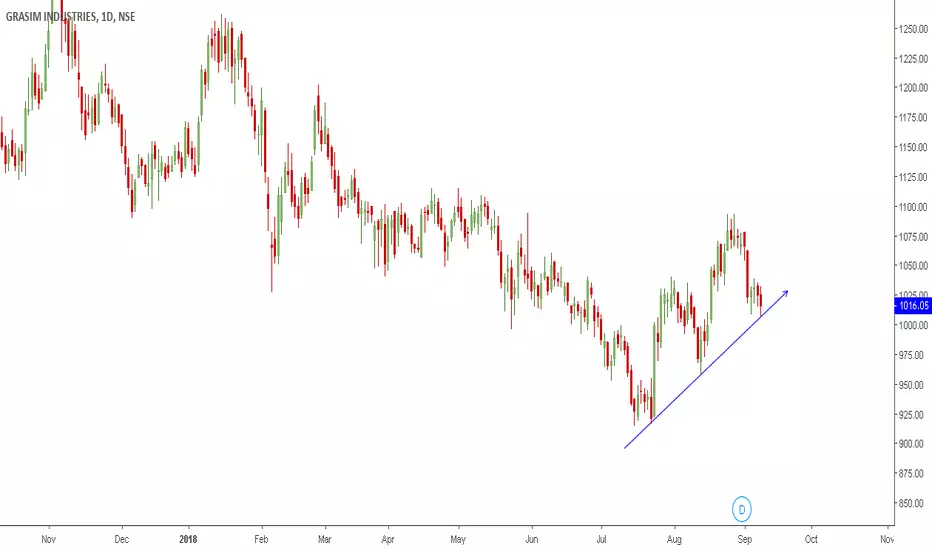


Breakout confirmed in GrasimHigh volume breakout, good momentum, divergence reversal. 100 EMA support as well

BTST IN GRASIM AUG (FUT)BTST IN GRASIM
AUGUST FUTURES
BUY@1063
STOP0@1047.5
TARGET@1085
LOT:750
QTY:1

BTST IN GRASIM JULY (FUT)BTST IN GRASIM
MARABUZO CANDLE
JULY FUTURES
BUY@998
STOP@990
TARGET@1010
LOT:750
QTY:1

ultracemco , weekly trade set upwill like to stay long in the counter considering the risk reward ratio !

My PredictiveEngine's Intraday call(07-Jun-18)-GRASIM-LongBased on my PredictiveSystem's signals, its going to be a GREEN candle on 07-Jun-2018 for GRASIM
Buy Above: 1037.6 for targets -
T1: 1045.4
T2: 1050.1
T3: 1054.9
SL: 1029.3
Note: These calls are based on my own analysis. It may or may not work well for you.So please carefully consider whether it is suitable for you and please do your own research before attempting any. The profit/loss made by you due to this call, is solely your own responsibility. Thanks, All the best. Happy Trading. :-)

GRASIM Neckline BreakoutGRASIM has been respecting the neckline for a while. Expecting a breakout/reversal on account of result.

GRASIM - HEAD N SHOULDER It is been observed on daily chart that the price action formed a bearish Head and Shoulder, indicating a further weakness ahead.
Target: 1100
Stoploss: 1165

Ascending Triangle formation on GrasimAscending Triangle formation on Grasim. price may break above the support line and MACD showing bullish crossover on bullish trend.
Trade:
Buy above - 1101
Target 1 - 1112
Target 2 - 1124
Stop loss - 1188


GRASIM INDUSTRIES - TRENDING UP (GOOD INVESTMENT)It is been observed on the Monthly Chart that the price action is trending up by making higher lows and higher highs (indicated on the chart with a long upward moving arrow). Hence it is providing a good investment opportunity at current levels. It is also fundamentally strong company and with interest rate and inflation going down shall benefit the company's upcoming quarter returns.
I believe it shall further move up and continue the trend in coming months. Therefore, I expect the price action to cross above 1100 levels soon.
Target: 1120
Stoploss: 1000
Risk Reward: 1:1
Duration: 1-2 Months.

GRASIM - BREAKOUTThe stock has given a breakout from daily resistance today with a good candle.
Keep in watchlist for going long.

GRASIM SHORT Engulfing & Divergence !Today's big Black candle which engulfed the last 2 candles and closed at lowest level is showing the forthcoming weakness. It is also showing bearish divergence in the overbought Zone. One can short the stock at the level where Stop Loss of 1102 on closing basis is affordable to them.

Abirlanuvo very good company with a target of 1450 in coming dayABIRLANUVO perfect balance sheet company. The company will be in the correction mode now. One can buy it at the level of 1331 with the target of 1450 in coming days.
Even RSI is showing overbought as of now.
