Great opportunity 20% discounted price.The stock is undervalued here is why--
> Company's profit is growing on a fast phase while the stock is not growing that much
this results that stock is still underpriced. The stock is almost 20% down from its all
time high.
> The Central Electricity Authority (CEA) estimates India’s power requirement to grow to reach
817 GW by 2030.
> TATA POWER is the leading company in solar rooftop and 102 MW orders won in Q1 FY25
Growth

Trade Catalyst Series - Episode 2 // GOKALDAS EXPORTSHey folks,
Today in new developing events in US-India deals, I have come with another stock to lookout.
This one is focused only for long-term window with the latest Reciprocal tariffs in talk.
1. Macro Overview
The US-India Interim Trade Agreement published today is a structural game changer for Indian textiles.
The Headline: US Reciprocal Tariffs on Indian exports (apparel) slashed from ~50% to 18%.
The Significance: This is not just a rollback; it is a competitive flip. For the last decade, India (tariff ~20%+) lost share to Vietnam and Bangladesh (zero or low duty).
But now new Hierarchy we have :
India: ~18% Duty
Vietnam/Bangladesh: ~20% Duty
China: ~30-35%+ Duty
Result: India is now the most cost-efficient sourcing hub for US brands.
2. Sector Impact: The "China+1" Accelerator
The entire Indian textile export sector moves from "survival mode" to "growth mode."
Exporters were absorbing 10-15% of the tariff burden to keep clients. This cost instantly vanishes, flowing directly to the bottom line.
US brands will likely to shift volume from Vietnam to India capturing the 2% duty spread.
3. Stock Spotlight: Why GOKEX you ask?
Gokaldas Exports is the highest-beta play on this specific catalyst.
~70% of GOKEX’s revenue comes from the US. No other major listed player (KPR Mill, Trident) has this level of direct sensitivity to US tariffs.
GOKEX recently acquired Atraco (Kenya) and Matrix (India). These assets were dragging earnings due to low utilization. With the tariff barrier removed, GOKEX can fill these factories with high-margin US orders.
4. Fundamental Check
Q3 FY26 (Bottom): Net profit crashed 71% YoY to inr14.6 Cr; Margins slumped to 7.7%. This is now priced in as the worst-case scenario.
FY27 Outlook (Recovery):
Revenue is expected to grow 15-20% as order books swell.
Margins: Projected to reduce back to 11-13% + tariff savings.
Valuation: Trading at ~26x depressed earnings. If earnings double in FY27 (base case on margin normalization), forward P/E drops to an attractive 13-15x.
5. Technical Setup - Daily Chart
The stock has already rallied ~40% this week.
Now on daily frame the RSI shows it is in overbought zone due to rush buying of the stock.
Next to watch out is for a minor pull back to the near support zone (here 0.786 level of fib) to make an entry.
the next resistance to watch will be 900. for that I would be monitoring the order book of the company in the next quarter.
6. Key Risks
-> The stock already rallied ~40% on rumors. A short-term dip is highly likely as other traders book profits.
->US Recession: Lower tariffs don't matter if US consumers stop buying clothes. Monitor US retail data closely.
-> A strengthening of rupee could eat into the new margin gains.
7. Final Verdict
I am long on this one so will be keep buying on Dips.
first Entry : 700-720
T1 : 1000
T2 : 1150
SL : 650
The 18% tariff rate is giving Indian exports distinct edge over Vietnam. so major focus after entry will be on the management commentary of order book visibility for Q1 FY27. If this all confirms volume shifts from Vietnam, the stock heads to inr1,000+, achieving our t2 or a new ATH.
Future episodes will explore additional sectors and companies that could emerge as beneficiaries of evolving global trade partnerships. If your eye catches on to some particular stock reflecting on the same let me know in the comments below I will do a episode on it too.

TRADE CATALYST SERIES - Episode 1 // PARADEEP PHOSPHATES LTDMajor trade deals don’t just influence diplomacy -- they create real opportunities in the stock market.
This series explores how the evolving India-US and India-EU trade partnerships could act as catalysts for select Indian companies. Each episode highlights carefully researched stocks that may benefit from these global economic shifts.
NSE:PARADEEP
1. Macro Catalyst Overview
These india's trade deals brings in two major developments:
India-EU FTA : A deal eliminating tariffs on Indian industrial goods and agricultural exports to Europe, while slashing import duties on European machinery.
US-India Trade : A strategic agreement focusing on technology transfer and supply chains, but reducing reliance on cheap/discounted Russian oil .
Global supply chains are decoupling from single-source dependencies. India is positioning itself as a manufacturing hub, while the West seeks to align India’s energy and tech standards with its own.
Market Impact:
Positive: Cheaper capital goods (machinery) for Indian manufacturers and opened gates for Indian agri-exports.
Negative: Potential spike in energy costs due to the shift away from discounted Russian feedstock.
2. Sector Impact - Fertilizers & Agro-chemicals
The "Agri-Export" angle : The EU has removed tariffs on Indian commodities. helps increase demand of NPK fert and nutrients.
The "Capex" advantage: Fert plants are capital intensive. removal of duties on European machinery will significantly lowers the cost of capacity expansion and maintenance.
The "Feedstock" squeeze: The sector requires high energy. The US-India pact’s pressure to move away from cheap Russian gas/ammonia could increase input costs, compressing margins.
3. Stock Spotlight
PPL is India’s second-largest private phosphatic fertilizer player. It distinguishes itself through backward integration (making its own acids) and a "parentage moat"—it is a joint venture with the OCP Group (Morocco), which controls 70%+ of the world's phosphate reserves.
Why This Company Benefits:
-Direct Beneficiary of Agri-Boom: PPL has a stronghold in Eastern and Southern India—key regions for tea and spice plantations. As the India-EU FTA boosts these plantations' income, PPL’s high-margin NPK fertilizer sales are poised to surge.
-Capex Efficiency: PPL is aggressively expanding capacity to 3.7 MMT. The zero-duty import of European technology will directly reduce the project cost of this expansion, improving ROCE.
- Raw Material Shield: While the sector faces energy cost risks (US Deal fallout), PPL’s partnership with OCP ensures a steady supply of Rock Phosphate, insulating it from the worst of the supply chain disruptions.
4. Fundamental Strength Check
Revenue Growth +48%yoy (Q3 2026)
Operating Margin ~9.5% ( compressed)
P/E ~ 14x
D/E 0.8x
order book is showing high visibility
5. Technicals
On Weekly chart the price is in a very sweet support zone. also the volume on red candles weekly is shrinking below VA of 10 - indicating sellers are loosing the control and bulls might now take over soon.
On Fib within price range between a year period the next targets would be at 0.5, 0.618 and 0.786 levels.
6. Risk Factors
->Energy Cost Inflation: If the US-India deal forces a switch to expensive LNG/Ammonia, PPL’s raw material bill could rise, squeezing margins further.
->Regulatory Hiccups: The recent seizure of 25,000 MT of Urea (Jan 2026) over quality disputes ("Biuret content") highlights operational and regulatory risks.
->Subsidy Dependence: Like all fertilizer stocks, PPL’s cash flow is heavily dependent on the timely release of government NBS (Nutrient Based Subsidy) payments.
->Monsoon Sensitivity: A sub-par monsoon could dampen the expected demand boom from the agri-export sector.
7. Final Verdict
I am Long on the weekly period with the following values.
Entry : 120-130
T1 : 160
T2 : 177
SL : 115
Future episodes will explore additional sectors and companies that could emerge as beneficiaries of evolving global trade partnerships. If your eye catches on to some particular stock reflecting on the same let me know in the comments below I will do a episode on it too.

Flash Crash || XAUSD/GOLDThe gold market (XAU/USD) is currently navigating a period of intense volatility, shifting from a historic "blow-off" rally to a sharp technical correction. As of February 3, 2026, the market is attempting a relief bounce after a dramatic weekend crash.
📈 Market Snapshot (Feb 3, 2026)
Following a record high near $5,600/oz in late January, gold experienced a "flash crash" toward the $4,400–$4,600 range. Today, prices have stabilized and are rebounding slightly.
Current Spot Price: Hovering around $4,800 – $4,900/oz.
Key Resistance: $4,930 (50-day EMA) and the psychological $5,000 barrier.
Key Support: $4,400 (the recent floor) and $4,650.
🔍 Why the Recent Crash?
The market didn't just "dip"—it plummeted due to a perfect storm of technical and macro triggers:
The "Warsh Shock": The nomination of Kevin Warsh as Fed Chair sparked fears of a more hawkish (higher interest rates) monetary policy, strengthening the US Dollar.
Margin Hikes: The CME Group increased margin requirements for gold futures. This forced over-leveraged traders to sell immediately, creating a "snowball effect" of liquidations.
US Budget & Shutdown Fears: While the Indian Union Budget (Feb 1) saw a domestic price correction of ~3-5%, global markets were reacting to a partial US government shutdown, which initially created uncertainty but eventually led to a stronger Dollar.
Extreme Profit Taking: After gold nearly doubled in a year, a massive wave of profit-booking was inevitable once the momentum stalled.
🛠️ Technical Outlook & Next Steps
Based on the current chart structure and your inquiry, here is a breakdown of the immediate path forward:
1. The Rebound Phase
Gold is currently in a "mean reversion" bounce. The RSI (Relative Strength Index) has moved out of oversold territory, suggesting the panic selling has paused. However, for a true trend reversal, gold must close above $4,930 on a daily timeframe.
2. Strategic Scenarios
Scenario Price Action Recommendation
Bullish Break - Price closes above $5,000 Potential for a retest of $5,200. Momentum returns.
Consolidation - Stays between $4,700 - $4,900 A "wait and watch" zone. High risk of choppy "sideways" movement.
Bearish Failure - Fails at $4,900 and breaks $4,650 Risk of a secondary drop back toward the $4,400 floor.
3. Long-Term View
Despite the crash, many institutional analysts (including J.P. Morgan) maintain a $6,000+ target for late 2026, citing continued central bank buying and global de-dollarization.

Hblengine: accident a opportunity or charm is lostHblengine which has given multibaggeer returns and awesome results over the last 2-4 years.
It was 10% down today and a light recovery from 200 day ena.
My perception is as long as 200 dema is protected we are safe and we can see ath in this year.
Order miss but still having good order book and working in multiple segments.

Premier Polyfilm Ltd – Inverted Hammer Reversal at Key SupportStrong Bullish Candle After Multi-Month Downtrend
Premier Polyfilm has printed a bullish Inverted Hammer at a major support zone after a prolonged decline — a classic early reversal signal on the weekly timeframe. The stock has been falling consistently for months, and this week’s sharp +12% bounce shows strong buying interest returning near the demand zone of ₹34–₹36.
Price is now closing above the minor resistance zone (₹40–₹43). If sustained, the stock may attempt a short-term trend reversal.
RSI also shows a bullish uptick from oversold territory, supporting the possibility of a relief rally.
🎯 Key Technical Levels
CMP: ₹43.00 (+12.33%)
Immediate Resistance: ₹49–₹52
Major Resistance Zone: ₹73–₹80
Support Zone: ₹34–₹36
Major Support: ₹30
Swing SL: Close below ₹35 (weekly basis)
📈 Technical View
A clean Inverted Hammer candle formed exactly at support → early reversal signal.
RSI bouncing sharply from oversold (14–20 range).
Price reclaiming the small demand zone around ₹40–₹43.
Trend is still down, but first signs of exhaustion are visible.
Sustaining above ₹43 could lead to a move toward the 20-week EMA and the ₹49–₹52 area.
🧠 View
Premier Polyfilm has shown its first strong bullish candle after several months of selling pressure. The combination of Inverted Hammer + support + RSI reversal makes this an early-stage reversal watch. A weekly close above ₹43 strengthens the case for upside toward ₹49–₹52, and potentially ₹70+ on a medium-term basis.

NIITMTS well posied technically and fundamentally for quick upmoFollow the "Smart Money" : Domestic Institutional Investors (DIIs) and Mutual Funds significantly increased their stake in the most recent quarter (adding +1.58%).
The "Smart Money" Divergence : This accumulation happened while retail/"public" investors sold off their holdings (-1.38%). This is a classic bullish divergence.
Proof of Accumulation : This isn't day-trading. Recent delivery volumes are exceptionally high, ranging from 65% to 81% , proving that shares are being bought and held for the long term.
Fortress-Like Business Pipeline : The business is heavily de-risked with $409 Million in contracted, visible revenue.
Perfect Client Retention : The company maintains a 100% contract renewal rate from its 104 global clients, proving its services are mission-critical.
Real Growth (Not Just a Story):
Top-Line : 20% YoY revenue growth confirms strong market demand.
AI: AI-enabled services are not a future promise; they are already contributing ~10% of total revenue.
Solid Financial Health : The balance sheet is strong. The company has a high TTM Return on Capital Employed (ROCE) of ~22-28% and a healthy, low debt-to-equity ratio.
The Opportunity : The stock is near its 52-week low due to a short-term profit dip (which scared off retail), while institutions are clearly using this as a value entry point to buy a high-quality, long-term business

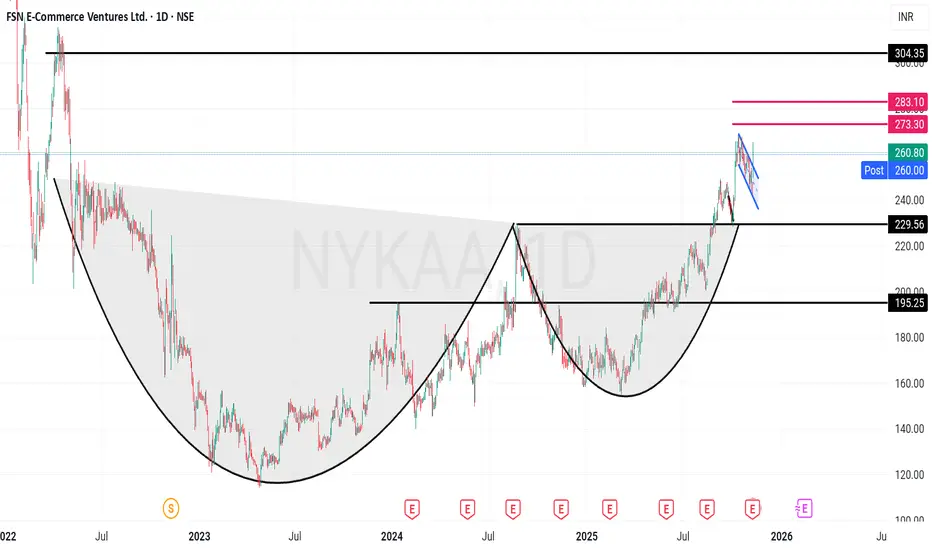
Nykaa - Strong Growth Cup & Handle with Detailed fundamentalsFSN E-Commerce Ventures Limited (Nykaa) – Technical & Fundamental Analysis
Company Overview:
FSN E-Commerce Ventures Limited (Nykaa) is a digitally native consumer technology platform, delivering a content-led, lifestyle retail experience. Since its incorporation in 2012, the company has focused on designing a differentiated brand discovery journey for its consumers. It offers a diverse portfolio of beauty, personal care, and fashion products, including owned-brand products manufactured in-house. Nykaa provides an omnichannel experience to cater to consumer preferences and convenience.
Technical Analysis
Chart Patterns: Cup and handle breakout; Today 1-hour parallel channel breakout
Current Market Price (CMP): ₹260
Targets: ₹301, ₹350
Support Levels: ₹230, ₹195
Recent News & Highlights
✅Q1 FY26 Results: Consolidated net profit surged 142% YoY to ₹23.30 Cr; revenue up 23.4% to ₹2,155 Cr
✅Arbitration Win: Nykaa Fashion received ₹10 Cr compensation from arbitration award
Q1 FY26 Guidance: Management anticipates consolidated net revenue growth at lower end of mid-twenties range YoY
✅Fashion Segment Target: Company expects EBITDA breakeven in fashion by FY26
✅Organic Portfolio Expansion: Aims to increase organic portfolio by 30% annually to reach ₹6,000 Cr GMV
✅Q4 FY25 Performance: EBITDA ₹133 Cr vs ₹93.28 Cr YoY; EBITDA margin improved to 6.47% from 5.59%
✅Corporate Action: NCLT approved merger of Iluminar Media (LBB) into Nykaa Fashion
Analytical Summary
Operational Excellence: Revenue growth of 24.5% YoY with net profit doubling to ₹66.08 Cr demonstrates strong execution and operating leverage. The company is scaling both beauty and fashion verticals while expanding margins.
Capital Structure: Debt increased 41% to ₹961 Cr, but debt-to-equity remains negligible at 0.04, showing conservative leverage. ROE at 5.9% suggests room for improvement in capital efficiency.
Valuation Risk: PE of 675.77 and PB of 40.5 reflect aggressive growth expectations. EV/EBITDA of 117.5 leaves minimal margin of safety, requiring caution for long-term investors.
SWOT Analysis
Strengths (16 Factors):
Rising net and operating cash flows for 2 consecutive years
Strong EPS growth; quarterly profit margins expanding
Improving RoCE, ROE, and ROA
Consistent revenue growth for past 2 quarters
Clean governance; zero promoter pledge
Weaknesses (3 Factors):
Promoter shareholding dilution
Expensive valuation (PE > 40) limits margin of safety
Opportunities (1 Factor):
Increasing FII/FPI shareholding validates institutional interest
Disclaimer
This analysis is for educational and informational purposes only. It does not constitute investment advice. Trading and investing in stocks involve risks, and individuals should conduct their own due diligence or consult with a qualified financial advisor before making any investment decisions. The author is not responsible for any gains or losses arising from the use of this analysis.
Short term swing on Jyoti CNCWith the earnings flattening out , EPS seems to have bottomed out and recent CEO statements clearly indicate strong order book and positive cash flow in Q3 leading upto Q4.
Along with these fundamental view , it formed a base between 878 - 924 range. Entererd the trade on breakout and pull back in to base.
Entry : Entry 912
SL : 875 ( I usually dont keep a hard SL, I exit if the price sustains under 875 for 2 successive trading sessions - thats how I've found success )
Target : 1035
Current entry does look for slightly longer term hold in which case I would add more qty if the price drops under 870 ( hold for 6-12 months ) . The hold would make sense if the company delivers on the time while sustaining a strong order book and cash flow as predicted which would eventually elevate the EPS and price should go up n beyond the previous ATH.
Note: Personally , I have a long term position which I opened at 411 so currently this is just a swing but yes a substantial drop under 870 and I'll add to my long term position.

Tamilnad Mercantile Bank (TMB) – Update | 3.5% Move from Our Lvl🟢 Tamilnad Mercantile Bank (TMB) – Update | 3.5% Move from Our Level 🚀
Latest Update : Our analysis shared around ₹499 has played out well — TMB made an intraday high of ₹517, gaining nearly 3.5% from the mentioned level.
🏦 Company Overview:
Tamilnad Mercantile Bank Limited is one of the oldest and leading old private sector banks in India. The bank offers a wide range of banking products and services to retail, MSME, agricultural, and corporate customers.
Retail Products: Home loans, personal loans, auto loans, educational loans, business loans, and security-backed loans.
MSME Portfolio: Loans for manufacturing, traders, and service sector enterprises.
Agricultural Loans: Offered to individual farmers, farmer groups, agri-businesses, and agri-corporates.
📊 Technical View:
High Reached: ₹517 (▲3.5%)
Resistance: ₹510 – price tested and faced mild rejection here.
Supports: ₹466 / ₹440
💡 View: The stock showed strong momentum from the support zone and approached its major 1-year resistance area near ₹510–₹515. A sustained close above ₹515 can confirm a breakout and open the next upside targets of ₹535 / ₹600.
📈 For educational purpose only. Not a buy/sell recommendation.

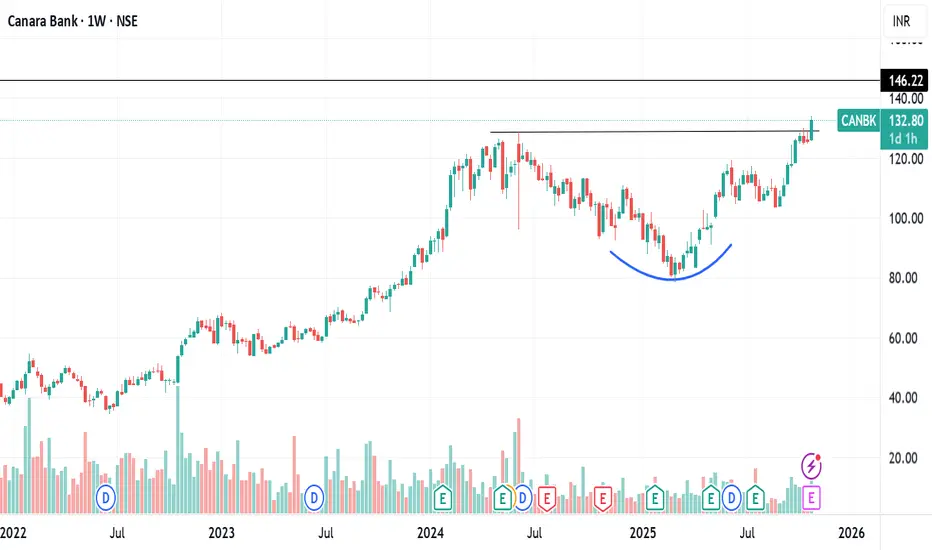
CANARA BANK ROUNDING BOTTOM BREAKOUTCanara bank breaking rounding bottom weekly
with huge volume this week
RSI above 60 bullish
heading towards 15 yr high
q2 net profit rises 19% +ve
target 146 then can lead to ATH 164 also
NO BUY/SELL RECOMENDATION
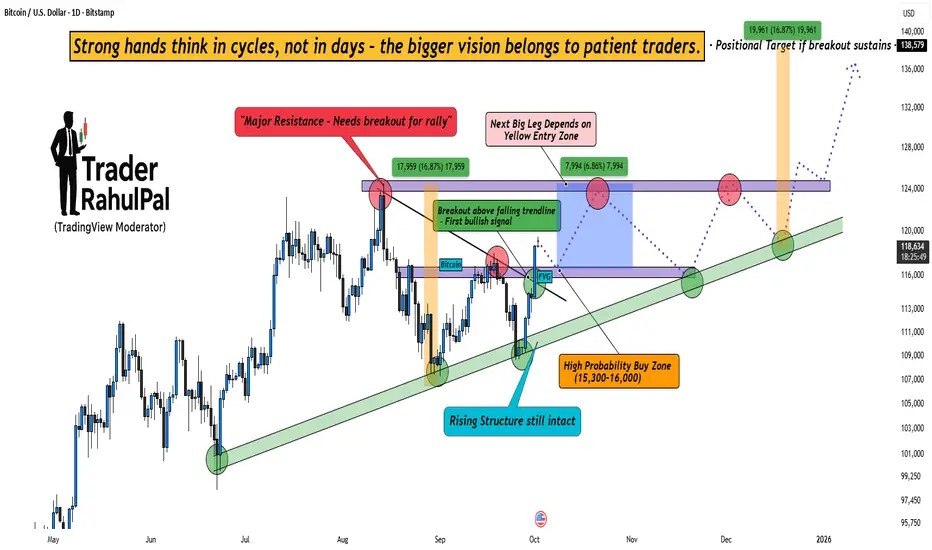
Bitcoin Cycle Play – The Setup That Could Change the Game!Bitcoin is currently showing clear bullish intent , but the real game lies in patience. The chart highlights a decisive breakout above the falling trendline , which is the first bullish signal after weeks of uncertainty.
At the same time, the rising structure is still intact , reminding us that the bigger trend remains strong. Smart money never chases candles – instead, it waits for the high probability zones . In this case, the 15,300–16,000 range could become the golden buying zone for long-term players.
However, one key hurdle remains – the major resistance overhead . Only if Bitcoin breaks and sustains above this zone, the door opens for the positional target near 138,000+ .
The psychology is simple : weak hands focus on short-term noise, but strong hands think in cycles and structures . Every dip tests conviction, but those who hold the bigger vision are the ones who capture the massive moves.
Rahul’s Tip : Don’t rush behind every breakout. Wait for zones where probability aligns with psychology . That’s where the wealth-building trades lie.
Disclaimer: This analysis is for educational purposes only and should not be taken as financial advice. Please do your own research or consult your financial advisor before investing.
Analysis By @TraderRahulPal (TradingView Moderator) | More analysis & educational content on my profile
👉 If you found this helpful, don’t forget to like and follow for regular updates.
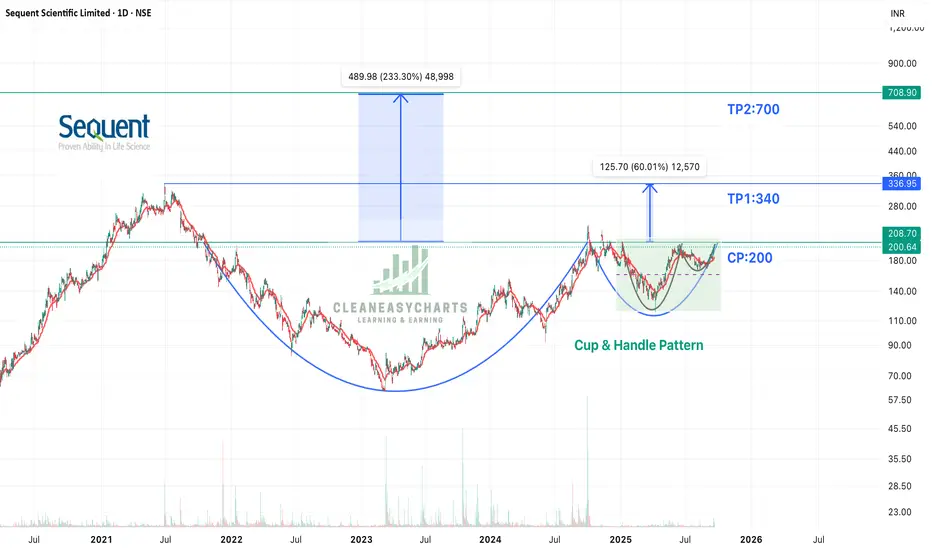
Sequent Scientific - 2 CUP & HANDLE PatternsSequent Scientific is heading for a 60% to 200% upside. Following are the factors:
Technical Factors:
1. 2 Cup & Handle Patterns waiting for a breakout
2. Small Cup & Handle - giving a potential upside of 60%
3. Large Cup & Handle - giving a potential upside of 200%+
4. Price respecting 20EMA
Technical Factors:
1. India's largest animal healthcare company and world's top 20 companies
2. Merger with Viyash - on the verge of completion
3. Post merger - Big Topline and Big Profits
Do keep this stock in your watchlist. Keep following @Cleaneasycharts as we provide Right Stocks at Right Time at Right Price.
Cheers!!
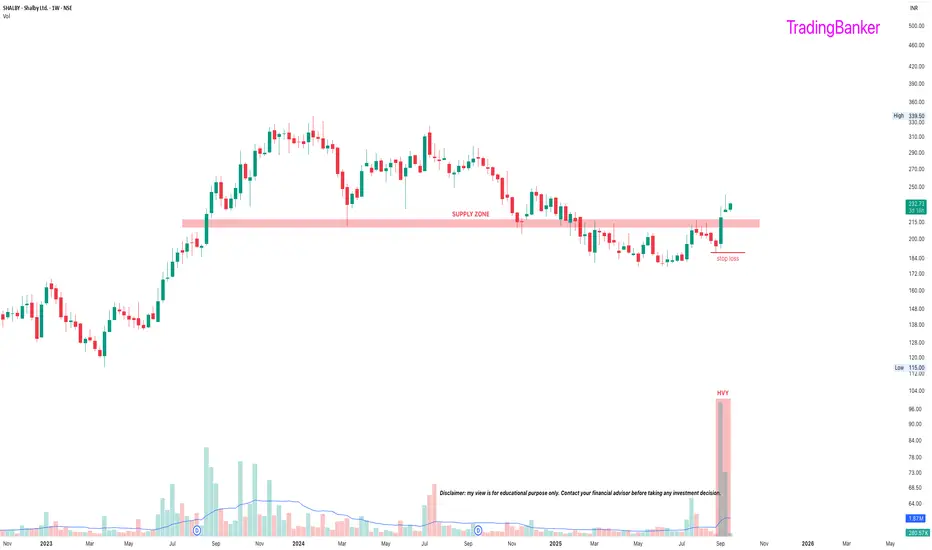
SHALBY Please consult your financial advisor before investing.This is only for learning purpose of chart.
We are NISM certified EQ and MCX trader but not SEBI register investment advisor.
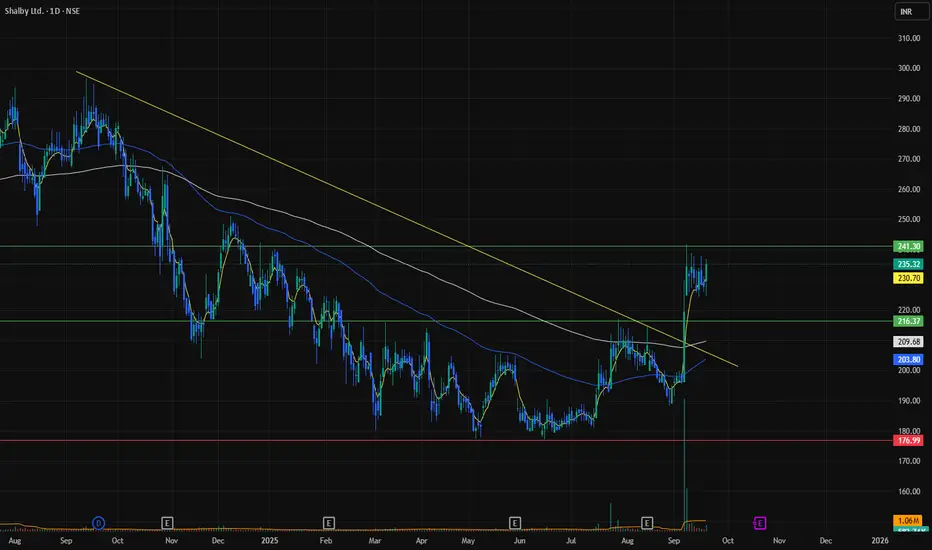
SHALBY: a probable longPros
-hospitals are a money minting machine attracting institutions (FII stake ⬆️)
-ARPOB (average revenue per occupied bed, one of the core metrics in hospitals)⬆️
-positive management commentary. for eg, aiming to improve profitability by reducing low margin schemes and focusssing on profitable schemes
-highest ever sales
-expanding through acquisitions, would eventually bring in the highest ever profits
-highest volumes of the year (week)
Cons
-SL needs risk management
-receivables > 6M = 20% of quarterly turnover (although some are from the government, they are still overdue)
Disc: Invested
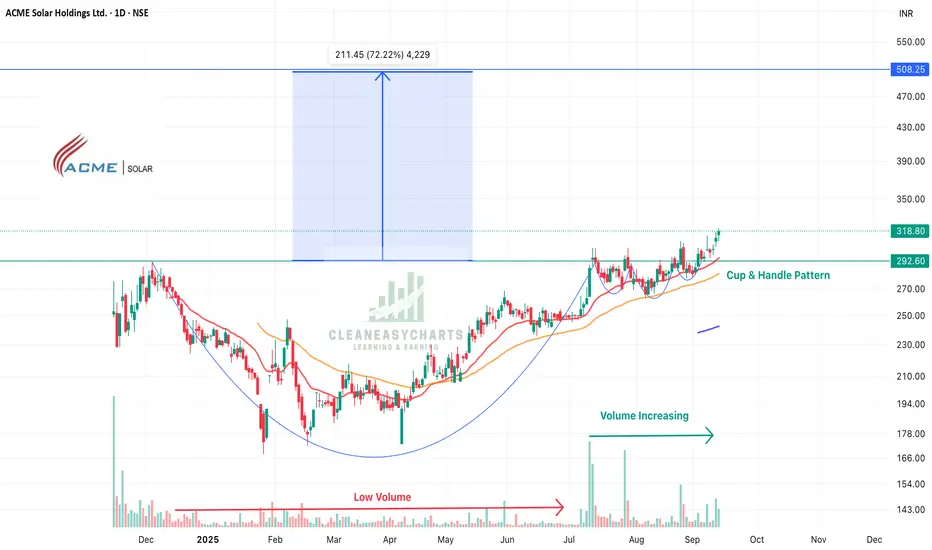
ACME Solar - Cup & Handle Patter + IPO StrategyACME Solar is heading for a 75% jump from current price. Following are the factors:
Technical Analysis:
1. IPO Strategy - The price has crossed the high of its price post listing
2. Volumes during the fall was low and now it has started picking
3. Complex Cup & Handle pattern breakout
Fundamental Analysis:
1. First Independent Power Producing Company in India
2. Super Strategic locations in India
3. Increasing profits year on year
4. Recent 3k cr loan by SBI for its project
Keep following @Cleaneasycharts for more such stocks as we provide "Right Stocks at Right Time at Right Price"
Cheers!!
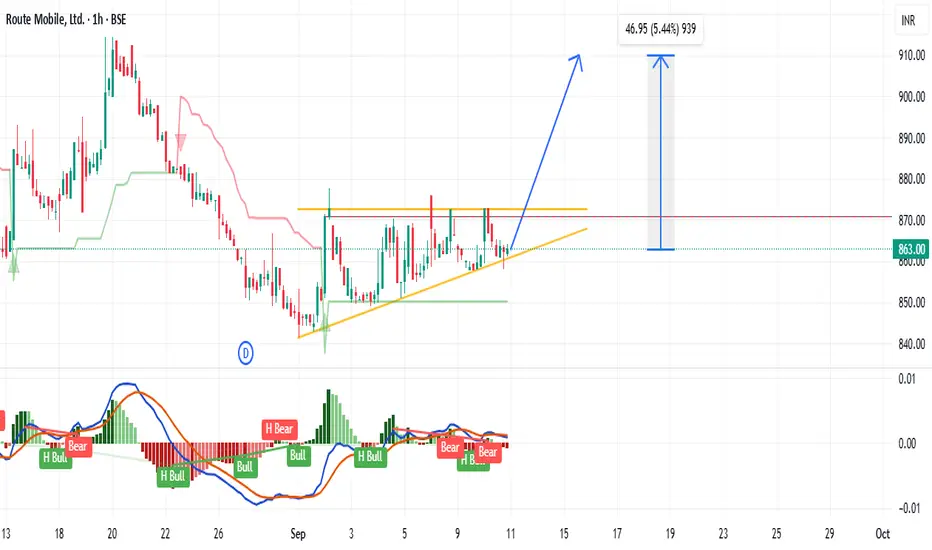
Route Mobile – Ascending Triangle Breakout Ahead on 1H timeframeRoute Mobile is showing strong technical momentum with an Ascending Triangle Breakout visible on the 1-hour chart. Price has broken above the resistance zone with notable volume support, signaling bullish strength.
Upside Potential: ~6% and possibly more if momentum sustains
Trigger Point: Breakout above resistance confirms fresh buying interest
Why this is significant:
The Ascending Triangle is a bullish continuation pattern. It forms when buyers steadily push prices higher with rising lows, while resistance holds firm. Once the resistance is decisively broken, it often unlocks strong upside potential as trapped sellers exit and fresh buyers enter with momentum.
Upside projection is based on the triangle’s height added to the breakout level, aligning with a potential 6% move. If volume sustains above breakout, there could be even more room for price appreciation.
🔎 Key takeaway: Breakout already in play, and Route Mobile looks poised for strong short-term momentum.
“Multi-Year Rally in the Making – Route Mobile”My Technical View:
---Double-bottom pattern identified – strong reversal signal.
---Long-term trendline breakout in progress, setting the stage for a huge upside rally.
Upside Targets:
🎯 Target 1: +30% Upside
🎯 Target 2: +66% Upside
🎯 Target 3: 100%+ Upside
Key Growth Catalysts:
1) Global Expansion – Integration with CPaaS major Kaleyra, giving presence in 100+ countries and Tier-1 clients.
2) Strong Backing – Supported by Proximus Group (Belgium), enhancing credibility & global scale.
3) Tech Edge – Partnership with Nokia for secure, carrier-grade CPaaS solutions worldwide.
New Business Wins (Driving Revenue & Margins):
1) IRCTC – Enterprise communication.
2) L&T Metro – Smart ticketing.
3) Nagpur / Hyderabad / Pune Metros – Digital ticketing solutions.
4) Google RCS – Advanced messaging platform.

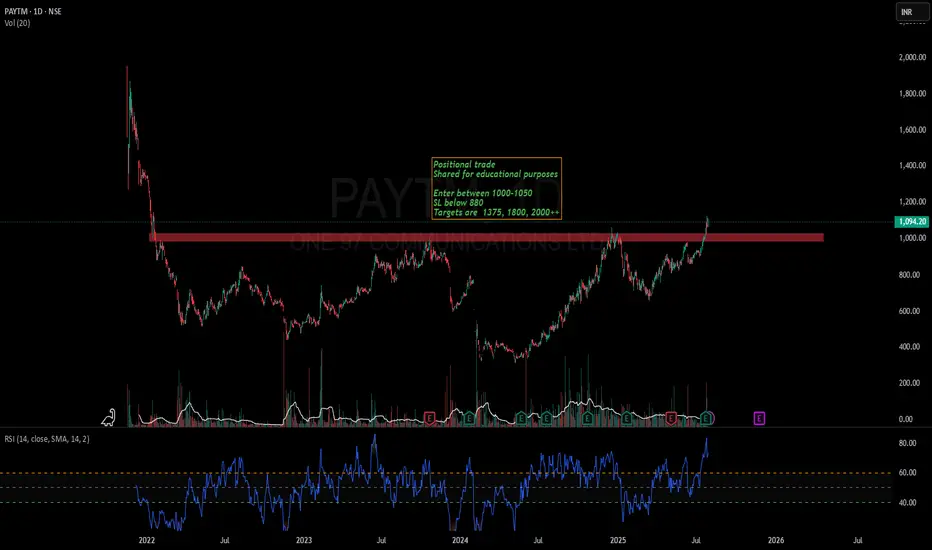
Paytm-A new ATH is coming soonPaytm has finally closed above its long term resistance of 1000.
Stock has potential to cross 2000 in near future
Keep stock in watchlist
Stock has also formed a kind of inverted head and shoulder pattern.
Not a recommendation. Watch and learn.
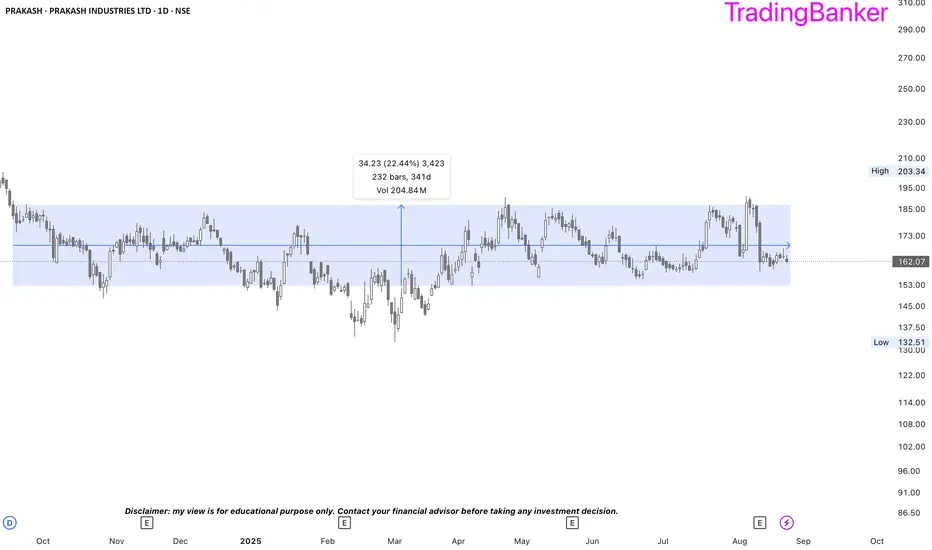
PRAKASH: range breakout soon?➡️script stuck in a range for almost a year and coiled up like a spring in the rectangle pattern.
➡️highest margins in last 5 years and an extremely low PE of 8 against the industry PE of 23.
➡️capex should bear fruit soon.
➡️highest promoter holding in last 6 years.
➡️not a matter of if, it’s a matter of when.
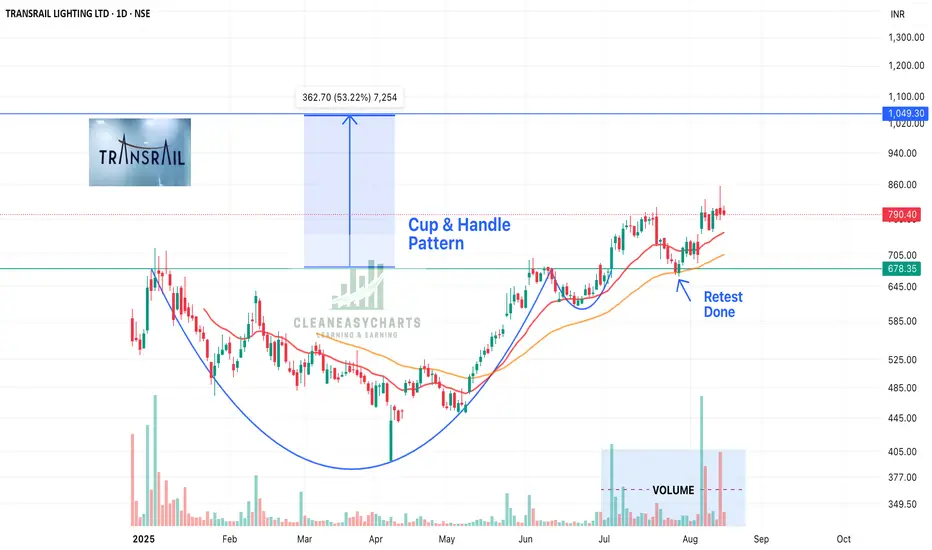
Transrail Lighting: Cup & Handle Pattern- Breakout & Retest DoneTransrail has made a cup & handle pattern and is looking for 50% jump. Other factors:
1. It got listed in Dec 2024 and has crossed that price, made a Cup & Handle Pattern - Breakout & Retest done.
2. 15000 crores order book
3. Recently got 700 crore order
4. Perform orders in 59 countries
5. Profitability is increasing
6. 25% growth rate
Transrail is solid fundamental & technical stock. This should be in your portfolio.
Right Stocks at Right Time at Right Price !!!
Keep following @Cleaneasycharts
Cheers!!
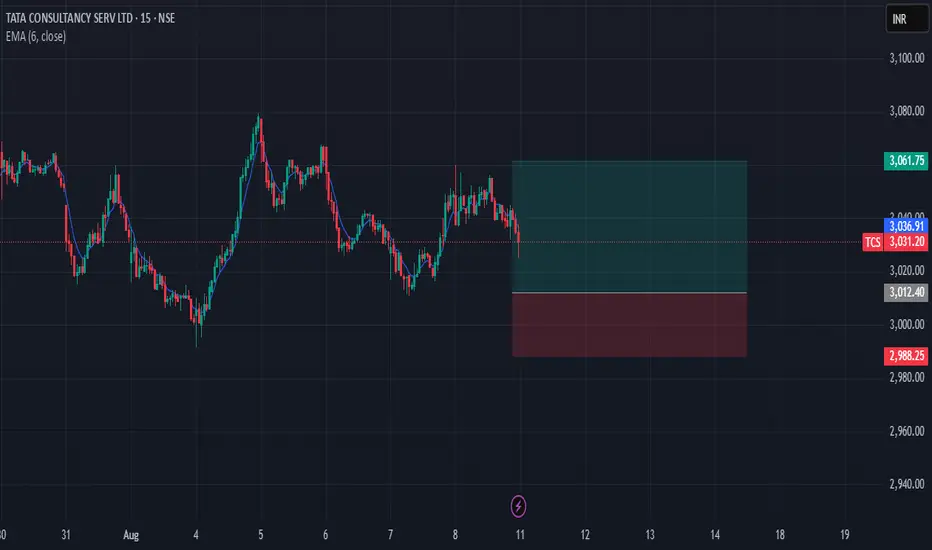
TCS Oversold — Eyeing a Short-Term ReboundTata Consultancy Services (TCS) is approaching oversold territory on the daily chart with RSI near 30, signaling potential for a short-term bounce. Price action is testing support, and risk is well-defined with a 1:1+ risk-reward setup. While the broader IT sector remains under watch, this setup offers an attractive opportunity for swing or short-term traders.
Route Mobile Bottomed-out for Highest UpsideMy Stock View and Opinion:
Double-bottom pattern identified, Huge upside potential as enterprise communication continues to evolve globally.
Strategic Moves:
1) Successful integration with global CPaaS major Kaleyra, unlocking access to 100+ countries and Tier-1 enterprise clients.
2) Backed by Proximus Group (Belgium), enhancing global reach and enterprise credibility.
3) Collaboration with Nokia to deliver secure, carrier-grade CPaaS services to telecom operators globally.
Strong execution capabilities, strategic partnerships with global telecom leaders, scalable SaaS-driven model, and growing demand for digital engagement platforms position Route Mobile for sustained multi-year growth.
