Part 6 Learn Institutional Trading1. Advantages of Options Trading
Leverage: Control larger positions with smaller capital.
Flexibility: Numerous strategies to profit in rising, falling, or stagnant markets.
Hedging: Reduce risk of adverse price movements.
Income Generation: Selling options can generate additional income.
Defined Risk for Buyers: Buyers can only lose the premium paid.
2. Risks and Challenges in Options Trading
Complexity: Options require deep understanding; mistakes can be costly.
Time Decay (Theta): Options lose value as expiration approaches.
Market Volatility: Sudden moves can amplify losses for sellers.
Liquidity Risk: Some options have low trading volumes, making entry and exit difficult.
Leverage Risk: While leverage amplifies profits, it also magnifies losses.
3. Practical Steps to Start Options Trading
Open a Trading Account: With a SEBI-registered broker.
Understand Margin Requirements: Options may require initial margins for writing strategies.
Learn Option Greeks: Delta, Gamma, Theta, Vega, and Rho affect pricing and risk.
Practice with Simulations: Use paper trading before committing real capital.
Develop a Trading Plan: Define goals, strategies, risk tolerance, and exit rules.
Continuous Learning: Markets evolve, so staying updated is crucial.
4. The Greeks: Understanding Option Sensitivities
Option Greeks measure how the option price responds to changes in various factors:
Delta: Sensitivity to the underlying asset’s price change.
Gamma: Rate of change of delta.
Theta: Time decay impact on the option’s price.
Vega: Sensitivity to volatility changes.
Rho: Sensitivity to interest rate changes.
Greeks help traders manage risk and optimize strategies.
5. Real-World Examples of Options Trading
Example 1: Hedging with Puts
Investor holds 100 shares of a stock at ₹2,000 each.
Buys 1 put option at strike price ₹1,950 for ₹50.
If stock falls to ₹1,800, the put option gains ₹150, limiting overall loss.
Example 2: Speculation with Calls
Trader expects stock to rise from ₹1,000.
Buys a call at strike price ₹1,050 for ₹20.
Stock rises to ₹1,100, call’s intrinsic value becomes ₹50.
Profit = ₹30 per share minus premium paid.
Harmonic Patterns

Part 2 Ride The Big Moves 1. Option Pricing and Valuation
Option prices are determined by two main components:
1.1 Intrinsic Value
The difference between the current price of the underlying asset and the option’s strike price.
1.2 Time Value
The remaining portion of the premium, reflecting time until expiration and volatility. Options with longer time to expiration usually have higher time value.
1.3 Factors Affecting Option Prices
Underlying Asset Price: Movement in the underlying asset directly affects the option’s value.
Strike Price: Determines whether the option is ITM, ATM, or OTM.
Time to Expiration: Longer expiration provides higher flexibility and premium.
Volatility: Higher volatility increases option premiums.
Interest Rates: Rising interest rates can increase call option values and decrease put option values.
Dividends: Expected dividends reduce the value of call options.
1.4 Option Pricing Models
Black-Scholes Model: Widely used for European options, factoring in asset price, strike price, time, volatility, and risk-free rate.
Binomial Model: Flexible and suitable for American options, where early exercise is possible.
2. Risk and Reward in Options Trading
2.1 Risk for Option Buyers
The maximum risk for buyers is limited to the premium paid. If the market moves unfavorably, the option can expire worthless, but the loss cannot exceed the initial investment.
2.2 Risk for Option Sellers (Writers)
Sellers face potentially unlimited risk:
For a call writer without owning the underlying asset (naked call), losses can be infinite if the asset price rises sharply.
For put writers, losses occur if the asset price falls significantly below the strike price.
2.3 Reward Potential
Buyers have unlimited profit potential for calls and substantial profit for puts if the market moves favorably.
Sellers earn the premium as maximum profit, regardless of market movement, assuming they manage positions correctly.
3. Hedging and Speculation Using Options
3.1 Hedging
Options are a powerful tool for risk management. For instance:
Investors holding a stock can buy put options to protect against downside risk.
Traders can use options to lock in profit targets or minimize losses.
3.2 Speculation
Speculators use options to capitalize on market movements with limited capital. Examples:
Buying calls to profit from an anticipated rise.
Buying puts to profit from an anticipated fall.
Using complex strategies to exploit volatility or time decay.
4. Options in Different Markets
4.1 Stock Options
Options on individual stocks are most popular and widely traded. They provide leverage and hedging opportunities.
4.2 Index Options
Options on market indices like Nifty or S&P 500 allow traders to speculate on broader market trends.
4.3 Commodity Options
Used in commodities markets like gold, crude oil, and agricultural products for hedging or speculation.
4.4 Currency Options
Provide protection or speculation opportunities in the forex market against currency fluctuations.

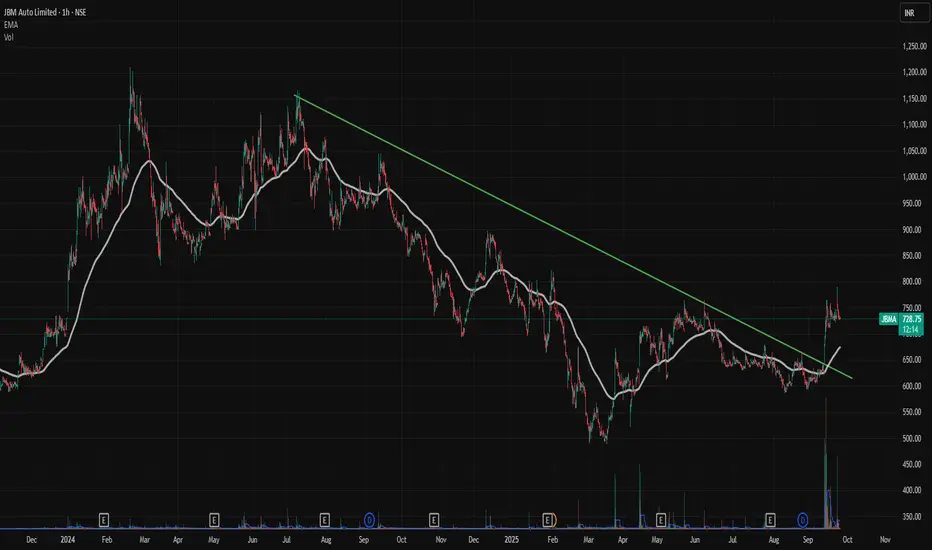
Gapup breakout in JBMAA good good gap up in JBMA.
Very healthy volumes showing up.
Very good time to enter as consolidating after gapup
Trendline breakout also.
good setup
can enter on 1 hr time frame
Risk to Reward ratio 1:2 or higher .
Thank u
Abdul Maajid Gouri
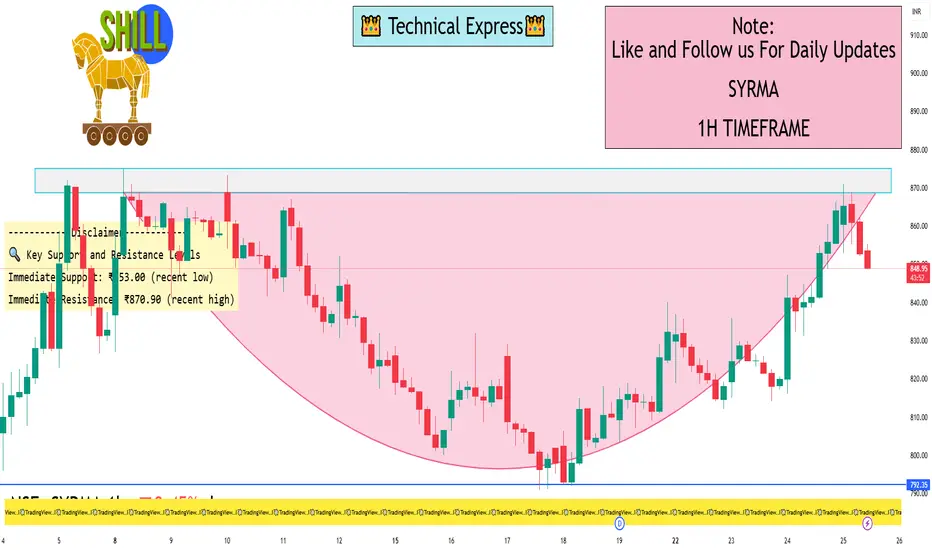
SYRMA 1 Hour View📈 1-Hour Time Frame Technical Overview
Based on recent intraday data, here’s a snapshot of SYRMA’s 1-hour technical indicators:
Relative Strength Index (RSI): 67.55, indicating bullish momentum.
Moving Average Convergence Divergence (MACD): 26.80, suggesting upward momentum.
Average Directional Index (ADX): 25.47, reflecting a moderately strong trend.
Stochastic Oscillator: 56.86, showing no overbought or oversold conditions.
Supertrend: ₹765.70, indicating a bullish trend.
Parabolic SAR (PSAR): ₹792.41, supporting the bullish trend.
Chaikin Money Flow (CMF): 0.110, suggesting accumulation of shares.
These indicators collectively point towards a bullish short-term trend for SYRMA.
🔍 Key Support and Resistance Levels
Immediate Support: ₹853.00 (recent low)
Immediate Resistance: ₹870.90 (recent high)
A breakout above ₹870.90 could signal further upside potential, while a dip below ₹853.00 might suggest a pullback.
For real-time intraday analysis on a 1-hour time frame, you can utilize the following platforms:
TradingView: Offers a comprehensive technical analysis overview, including indicators like RSI, MACD, and moving averages
Chartink: Provides customizable candlestick charts with various time frames and technical indicators
Investing.com: Features candlestick charts with pattern recognition and technical indicators
TopStockResearch: Delivers interactive charts with real-time updates and technical analysis tools
BTC/USD: Bearish Trend After Flash Crash and Key NewsThe BTC/USD chart shows a strong bearish trend following the "flash crash" event and contract liquidations. Currently, BTC is moving within a downward channel with support levels at 110,300 USD and 108,000 USD.
News Impact:
Morgan Stanley to Offer Crypto Trading: Morgan Stanley’s partnership with Zerohash to provide crypto trading on E*Trade could boost cryptocurrency acceptance, but it's not enough to reverse the bearish trend in BTC.
Fed Chairman Jerome Powell on Interest Rates: Jerome Powell's statements regarding the possibility of maintaining high interest rates have increased uncertainty, negatively impacting the cryptocurrency market.
Conclusion: The bearish trend of BTC/USD may continue. Traders should pay attention to support levels and stay updated with economic news to make informed trading decisions.

XAU/USD H1 – Gold at Key Resistance, Potential Pullback to 0.618
💥✅🎯On the one-hour (H1) timeframe, the price of gold (XAU/USD) has reached the key resistance level of 3,766–3,770 after a strong bullish rally. This resistance zone coincides with the upper supply area marked in red, as well as the rising orange trendline channel mid-level.
Key points:
Resistance Zone: 3,766–3,770
Support Levels: 3,740 and 3,720
Fibonacci Levels: Possible correction targets at 0.618 (~3,740) and 0.786 (~3,720).
Price action is consolidating near the resistance; watch for reversal candlestick patterns for short opportunities.
If resistance breaks, next upside target is around 3,800.
If rejection occurs, expect a corrective move down to Fibonacci levels before resuming the uptrend.
Risk Management:
For long positions: Wait for a breakout above 3,770 with sustained volume.
For short positions: Place stops above 3,780 to limit exposure.
Always use appropriate position sizing.

Understanding the Psychology of Trading1. The Role of Psychology in Trading
Trading is a mental battlefield. Financial markets are complex systems influenced by countless variables, from economic data and geopolitical events to investor sentiment. However, the human mind is inherently emotional, often reacting irrationally to market fluctuations.
Even the most robust trading strategies can fail if a trader cannot manage emotions such as fear, greed, overconfidence, or frustration. Psychological discipline ensures traders follow their plans consistently, avoid impulsive decisions, and maintain a long-term perspective. Studies suggest that over 80% of trading mistakes are rooted in poor psychological management rather than technical errors.
Key aspects of trading psychology include:
Emotional regulation: Maintaining composure in the face of gains and losses.
Cognitive control: Avoiding biases that cloud judgment.
Discipline: Following trading rules and strategies without deviation.
Resilience: Recovering quickly from losses and mistakes.
2. Common Emotional Traps in Trading
2.1 Fear
Fear is perhaps the most pervasive emotion in trading. Fear manifests in several ways:
Fear of losing: Traders may hesitate to enter positions, missing opportunities.
Fear of missing out (FOMO): Conversely, traders may impulsively enter trades to avoid missing profits, often at unfavorable prices.
Fear after losses: A losing streak can lead to panic and overly cautious behavior, reducing trading effectiveness.
Example: A trader sees a strong upward trend but hesitates due to fear of a sudden reversal. By the time they act, the price has already surged, causing frustration and regret. This cycle often leads to indecision and missed profits.
2.2 Greed
Greed is the desire for excessive gain, often leading to poor risk management. Traders may hold on to winning positions too long, hoping for unrealistic profits, or take excessive risks to recover previous losses.
Example: A trader makes a small profit but refuses to exit, hoping for a bigger gain. Suddenly, the market reverses, and the profit evaporates, turning into a loss.
2.3 Overconfidence
After a series of successful trades, traders may develop overconfidence, believing they are infallible. This often leads to reckless trades, ignoring risk management rules, and underestimating market volatility.
2.4 Impatience
Markets do not always move predictably. Impatience causes traders to enter or exit positions prematurely, deviating from their strategy. The result is frequent small losses that accumulate over time.
3. Cognitive Biases in Trading
Cognitive biases are systematic thinking errors that affect decision-making. Recognizing these biases is crucial for traders.
3.1 Confirmation Bias
Traders often seek information that confirms their existing beliefs while ignoring contrary evidence. This bias can lead to holding losing positions or entering trades without proper analysis.
3.2 Anchoring Bias
Anchoring occurs when traders fixate on specific price levels or past outcomes, influencing future decisions irrationally. For instance, a trader may refuse to sell a stock below their purchase price, even when fundamentals have deteriorated.
3.3 Loss Aversion
Humans are naturally more sensitive to losses than gains. In trading, loss aversion may prevent traders from cutting losses early, hoping the market will turn, which often worsens financial outcomes.
3.4 Recency Bias
Traders give undue weight to recent events, assuming trends will continue indefinitely. This bias can cause chasing performance or overreacting to short-term market moves.
4. The Importance of Discipline in Trading
Discipline is the bridge between strategy and execution. A disciplined trader follows a clear set of rules and adheres to risk management, regardless of emotional fluctuations.
4.1 Developing a Trading Plan
A trading plan is a blueprint that defines:
Entry and exit criteria
Risk-reward ratio
Position sizing
Trade management rules
Example: A trader may decide to risk only 2% of their account on a single trade and exit if losses reach that limit. Following this plan consistently prevents emotional decisions and catastrophic losses.
4.2 Sticking to Risk Management
Risk management is the cornerstone of psychological stability. Setting stop-losses, diversifying trades, and controlling leverage ensures that no single loss can devastate your account or trigger panic.
5. Emotional Control Techniques
Successful traders develop mental strategies to control emotions and maintain focus.
5.1 Mindfulness and Meditation
Mindfulness techniques improve awareness of thoughts and feelings, helping traders remain calm during volatility. Meditation has been shown to reduce stress and improve decision-making under pressure.
5.2 Journaling
Maintaining a trading journal helps identify recurring emotional patterns and mistakes. By recording each trade, the rationale behind decisions, and emotional states, traders can objectively review performance and refine their strategies.
5.3 Routine and Preparation
A structured daily routine reduces emotional fatigue. Preparation includes reviewing charts, setting alerts, and defining trading goals before market hours.
5.4 Breathing and Relaxation Techniques
Simple breathing exercises can reduce stress during high-pressure trading moments, preventing impulsive decisions.
6. Building a Resilient Trading Mindset
6.1 Accepting Losses as Part of Trading
Losses are inevitable in trading. Accepting them as a natural part of the process prevents emotional spirals and promotes learning from mistakes.
6.2 Focusing on Probabilities, Not Certainties
Markets are probabilistic. Traders must view each trade as a calculated bet, not a guaranteed outcome. Focusing on risk-reward ratios and statistical probabilities reduces emotional overreactions to individual trades.
6.3 Continuous Learning and Adaptation
Markets evolve, and so should traders. A resilient mindset embraces learning from both successes and failures, adapting strategies to changing market conditions.
7. Psychological Traits of Successful Traders
Through observation and research, several psychological traits consistently appear in successful traders:
Patience: Waiting for the right setup rather than forcing trades.
Discipline: Adhering to plans and strategies without deviation.
Emotional stability: Remaining calm under pressure.
Self-awareness: Recognizing personal biases and tendencies.
Confidence without arrogance: Trusting analysis without reckless behavior.
Adaptability: Adjusting strategies as markets evolve.
8. Avoiding Psychological Pitfalls
8.1 Overtrading
Overtrading is driven by boredom, greed, or the desire to recover losses. It usually results in higher transaction costs and emotional exhaustion. Limiting the number of trades and focusing on quality setups can mitigate this.
8.2 Revenge Trading
After a loss, some traders attempt to “win back” money through aggressive trades. This emotional reaction often leads to larger losses. Accepting losses calmly and returning to a plan is key.
8.3 Chasing the Market
Jumping into trades based on hype or short-term trends often results in poor entries and exits. Patience and adherence to trading plans prevent this behavior.
9. Developing Mental Strength Through Simulation and Practice
Simulation trading or “paper trading” allows traders to practice strategies without financial risk. This helps build psychological resilience, test reactions to losses, and develop disciplined trading habits. Reviewing simulated trades offers insights into emotional patterns and decision-making flaws.
10. Integrating Psychology Into Strategy
Successful trading requires the integration of psychological awareness into technical and fundamental strategies. Some approaches include:
Pre-trade checklist: A psychological and analytical checklist ensures readiness for trades.
Post-trade reflection: Assessing decisions objectively to identify emotional interference.
Routine review sessions: Weekly or monthly analysis of trades to refine strategy and mindset.
11. Real-World Examples of Psychological Trading
George Soros: Known for his high-risk trades, Soros emphasizes the importance of understanding one’s own psychology and the market’s reflexive behavior. His success stemmed from disciplined risk management and emotional control, even in volatile markets.
Jesse Livermore: Despite enormous successes, Livermore’s career was marked by the dangers of emotional trading, including overconfidence and revenge trading. His life highlights the balance between psychological mastery and the destructive power of unchecked emotions.
Retail Traders: Many retail traders fail due to emotional decision-making, overtrading, and lack of risk discipline. Psychological resilience differentiates consistent winners from occasional profitable traders.
12. Conclusion
Trading is as much a psychological pursuit as it is a technical or analytical one. Emotional regulation, cognitive control, discipline, and resilience are crucial for consistent success. Understanding one’s own mind, recognizing biases, and developing a disciplined, patient approach transforms trading from a high-stress gamble into a strategic, probabilistic endeavor.
Mastering the psychology of trading is an ongoing journey. It requires self-awareness, continuous learning, and practice. By integrating psychological insights into trading strategies, traders can navigate market volatility with confidence, make rational decisions, and achieve long-term profitability.
In short, the mind is the ultimate trading tool. Sharpen it, discipline it, and respect it, and the markets become not just a place of opportunity, but a mirror reflecting your mastery over fear, greed, and uncertainty.

XAUUSD Facing Downward PressureHello traders, XAUUSD is currently facing downward pressure following recent economic news. The lower-than-expected unemployment claims data suggests economic stability, reducing the demand for gold. The higher-than-expected PCE core index increases the likelihood that the Fed will maintain high interest rates, putting pressure on gold prices. While the US GDP remains stable , there is no strong breakthrough.
Technically, XAUUSD is in an uptrend but has encountered resistance at $3,790 . The price of gold is currently testing support at $3,700. If this level is broken, gold could fall to the $3,635 region.
Given the current fundamental and technical factors , the likelihood of XAUUSD continuing to decline is high. If support doesn't hold, gold could continue to drop.
Wishing you successful trading!

Technical Indicators for Swing Trading1. Introduction to Technical Indicators
Technical indicators are mathematical calculations based on historical price, volume, or open interest data. They help traders identify trends, reversals, and potential entry and exit points. There are two main types of indicators used in swing trading:
Trend-Following Indicators – These help identify the direction of the market and confirm the strength of a trend. Examples include Moving Averages, MACD, and Average Directional Index (ADX).
Oscillators – These help identify overbought or oversold conditions and possible price reversals. Examples include RSI, Stochastic Oscillator, and Commodity Channel Index (CCI).
Most swing traders use a combination of trend-following indicators and oscillators to improve the accuracy of their trades.
2. Trend-Following Indicators
2.1 Moving Averages (MA)
Definition: Moving averages smooth out price data to identify trends by averaging prices over a specific period. The two most popular types are:
Simple Moving Average (SMA): The arithmetic mean of prices over a chosen period.
Exponential Moving Average (EMA): Gives more weight to recent prices, making it more responsive to price changes.
Application in Swing Trading:
Trend Identification: A rising MA indicates an uptrend, while a declining MA indicates a downtrend.
Crossovers: A common strategy is the moving average crossover. For instance, when a short-term MA (e.g., 20-day) crosses above a long-term MA (e.g., 50-day), it signals a potential bullish trend. Conversely, a cross below indicates a bearish trend.
Support and Resistance: MAs often act as dynamic support or resistance levels. Traders can enter trades when the price bounces off the MA.
Example: If a stock’s 50-day EMA is rising, swing traders might look for pullbacks to this EMA as entry points.
2.2 Moving Average Convergence Divergence (MACD)
Definition: MACD measures the relationship between two EMAs (usually 12-day and 26-day) and includes a signal line (9-day EMA of MACD) to generate trading signals.
Components:
MACD Line: Difference between the 12-day EMA and the 26-day EMA.
Signal Line: 9-day EMA of the MACD line.
Histogram: Represents the difference between the MACD line and the signal line.
Application in Swing Trading:
Trend Identification: MACD above zero indicates an uptrend; below zero indicates a downtrend.
Crossovers: When the MACD line crosses above the signal line, it’s a bullish signal. A cross below signals bearishness.
Divergence: When price makes a new high or low but the MACD doesn’t, it signals a potential trend reversal.
Example: A swing trader may buy a stock when the MACD crosses above the signal line after a pullback in an uptrend.
2.3 Average Directional Index (ADX)
Definition: ADX measures the strength of a trend, regardless of direction. It ranges from 0 to 100.
Application in Swing Trading:
Trend Strength: ADX above 25 indicates a strong trend, while below 20 suggests a weak trend or range-bound market.
Trade Confirmation: Swing traders often avoid taking trades when ADX is low because the price may be consolidating rather than trending.
Example: If ADX is 30 and the trend is upward, traders may consider buying on pullbacks.
3. Oscillators for Swing Trading
3.1 Relative Strength Index (RSI)
Definition: RSI measures the speed and change of price movements on a scale of 0 to 100. Traditionally, RSI above 70 is considered overbought, and below 30 is oversold.
Application in Swing Trading:
Identify Overbought/Oversold Conditions: Overbought conditions may indicate a potential reversal down, while oversold conditions suggest a potential reversal up.
Divergence: When price makes a new high but RSI doesn’t, it can signal a reversal.
Support and Resistance: RSI often reacts to trendlines, helping traders anticipate price reactions.
Example: If a stock is in an uptrend but RSI drops below 30 after a pullback, a swing trader might use it as a buy signal.
3.2 Stochastic Oscillator
Definition: The stochastic oscillator compares a security’s closing price to its price range over a specific period, usually 14 periods.
Components:
%K Line: Measures the current closing price relative to the high-low range.
%D Line: 3-day moving average of %K.
Application in Swing Trading:
Overbought/Oversold Conditions: Above 80 is overbought; below 20 is oversold.
Crossovers: A bullish signal occurs when %K crosses above %D; a bearish signal when %K crosses below %D.
Divergence: Like RSI, divergence can indicate potential reversals.
Example: During an uptrend, a pullback that moves the stochastic below 20 and then back above it can be a buying opportunity.
3.3 Commodity Channel Index (CCI)
Definition: CCI measures the variation of the price from its average price over a specified period. It helps identify cyclical trends.
Application in Swing Trading:
Overbought/Oversold Levels: CCI above +100 indicates overbought; below -100 indicates oversold.
Trend Reversals: Swing traders use CCI to detect potential reversal points during pullbacks.
Entry and Exit Signals: Traders may enter long positions when CCI crosses above -100 and exit when it crosses below +100 in an uptrend.
Example: A CCI moving from -120 to -90 during an uptrend can indicate a potential entry point.
4. Volume-Based Indicators
Volume is a crucial aspect of swing trading because it confirms the strength of price moves.
4.1 On-Balance Volume (OBV)
Definition: OBV adds volume on up days and subtracts volume on down days to measure buying and selling pressure.
Application in Swing Trading:
Confirm Trends: Rising OBV with rising prices confirms an uptrend; falling OBV with falling prices confirms a downtrend.
Divergence: If OBV diverges from price, a reversal may be imminent.
Example: If a stock price is rising but OBV is falling, swing traders may be cautious about taking long positions.
4.2 Volume Oscillator
Definition: Measures the difference between two moving averages of volume, usually a short-term and a long-term MA.
Application in Swing Trading:
Helps identify volume surges that precede price movements.
Confirms breakout or breakdown signals.
Example: A spike in the volume oscillator along with a price breakout indicates strong momentum, ideal for swing trades.
5. Combining Indicators for Swing Trading
No single indicator is perfect. The most successful swing traders combine multiple indicators to confirm trades and reduce false signals. Here are common combinations:
Trend + Oscillator: Use moving averages or MACD to identify the trend, and RSI or Stochastic to time entry points during pullbacks.
Trend + Volume: Confirm a breakout with rising volume and a bullish MACD signal.
Oscillator + Volume: Use RSI or Stochastic for potential reversals, with OBV confirming strength of buying/selling.
Example Strategy:
Identify a stock in an uptrend using 50-day EMA.
Wait for RSI to drop below 30 during a pullback.
Confirm volume increase with OBV.
Enter long position when price starts moving up, exit when RSI approaches 70.
6. Practical Swing Trading Tips Using Indicators
Avoid Overloading: Using too many indicators can create conflicting signals. Stick to 2–3 complementary indicators.
Timeframe Matters: Swing traders typically use daily or 4-hour charts. Shorter timeframes may generate noise.
Risk Management: Always use stop-loss orders based on support/resistance levels or ATR (Average True Range) to protect capital.
Backtesting: Test strategies historically before applying them live to understand performance and potential drawdowns.
Patience is Key: Swing trading requires waiting for the right setup; don’t rush trades based on impulse.
7. Common Mistakes to Avoid
Ignoring Trend: Using oscillators alone without trend context can lead to premature entries.
Overreacting to Short-Term Signals: Swing trading is about the bigger picture, not intraday fluctuations.
Neglecting Volume: Price movements without volume confirmation are less reliable.
Lack of Strategy: Entering trades randomly without clear indicator-based rules often leads to losses.
8. Advanced Indicator Techniques
Divergence Analysis: Spotting divergence between price and indicators like RSI, MACD, or CCI can reveal hidden reversals.
Indicator Confluence: Using multiple indicators to converge on a single trading signal increases accuracy.
Adaptive Indicators: Some traders use adaptive MAs or dynamic RSI levels based on market volatility for improved precision.
9. Conclusion
Technical indicators are indispensable tools for swing traders. They provide insight into market trends, potential reversals, and entry/exit points. Popular indicators such as moving averages, MACD, RSI, Stochastic Oscillator, and volume-based indicators can be combined to create robust trading strategies. The key to successful swing trading lies not just in using indicators but in understanding their strengths, limitations, and context within the market. By combining trend-following tools with oscillators and volume confirmation, swing traders can systematically identify profitable trading opportunities while managing risk effectively.
Swing trading is both an art and a science. While indicators provide the science, the art comes from interpreting signals, recognizing patterns, and exercising discipline. Over time, with consistent application, swing traders can develop strategies that maximize profits and minimize losses in ever-changing markets.

Introduction to the Digital Revolution1. Understanding the Digital Revolution
The term Digital Revolution refers to the sweeping transformation brought about by digital computing and communication technologies that have reshaped virtually every aspect of human life. This revolution, which began in the latter half of the 20th century, has fundamentally altered how we communicate, work, entertain ourselves, and even think. Unlike previous industrial revolutions that were rooted in mechanical innovations—such as the steam engine in the First Industrial Revolution or electricity and mass production in the Second—this revolution is defined by the digitization of information and the rise of computational technologies.
At its core, the Digital Revolution marks the transition from analog and mechanical systems to digital systems. It involves the widespread use of computers, software, internet technologies, and mobile devices that facilitate the storage, processing, and transmission of information in digital formats. This shift has made information more accessible, reliable, and portable, enabling unprecedented levels of connectivity and efficiency.
2. Historical Background of the Digital Revolution
The Digital Revolution did not happen overnight; it evolved through a series of key technological milestones:
The Birth of Computers (1940s–1950s): The invention of early digital computers like ENIAC and UNIVAC marked the beginning of automated data processing. These machines, though bulky and limited in functionality, laid the foundation for computational advancements.
The Microprocessor Era (1970s): The development of microprocessors revolutionized computing by making computers smaller, faster, and more affordable. Companies like Intel and IBM played a pivotal role, creating machines that could be used not just by governments and corporations, but eventually by individuals.
The Personal Computer Revolution (1980s): The introduction of personal computers (PCs) by companies like Apple and IBM brought computing into homes and offices worldwide. This democratization of technology allowed people to interact with digital systems directly.
The Internet and World Wide Web (1990s): The commercialization of the internet and the creation of the World Wide Web transformed global communication, commerce, and information sharing. This era introduced email, online banking, e-commerce, and search engines, all of which became integral to modern life.
The Mobile and Wireless Era (2000s–2010s): Smartphones and mobile networks made digital connectivity ubiquitous. Devices like the iPhone, launched in 2007, shifted the paradigm by providing portable computing power and internet access anywhere.
The Era of Artificial Intelligence and Big Data (2010s–Present): The rise of AI, machine learning, and big data analytics has pushed the Digital Revolution into a phase where automation, predictive technologies, and intelligent systems shape industries and society at large.
3. Key Components of the Digital Revolution
Several technological pillars define the Digital Revolution:
Computing Technologies: Central processing units (CPUs), graphics processing units (GPUs), and quantum computing developments form the backbone of the revolution. Faster and more efficient computing powers the data-driven world.
The Internet and Connectivity: The internet is the nervous system of the digital age, enabling real-time global communication and collaboration. Wireless technologies, including 4G and 5G networks, further amplify accessibility.
Software and Applications: From productivity tools like Microsoft Office to sophisticated AI-driven software, software systems facilitate automation, problem-solving, and enhanced productivity.
Digital Storage and Cloud Computing: Innovations in data storage, ranging from solid-state drives (SSDs) to cloud-based storage solutions, ensure vast amounts of information can be securely stored and accessed anywhere.
Mobile and Wearable Devices: Smartphones, tablets, and wearables have made digital interaction a constant part of daily life, transforming communication, health monitoring, and entertainment.
Artificial Intelligence and Machine Learning: AI algorithms analyze massive datasets to generate insights, automate decision-making, and improve efficiencies in areas such as healthcare, finance, and transportation.
Emerging Technologies: Blockchain, augmented reality (AR), virtual reality (VR), and the Internet of Things (IoT) continue to push the boundaries of digital integration, creating new opportunities for innovation.
4. Societal Impact of the Digital Revolution
The Digital Revolution has profoundly influenced human society, altering how we live, work, and interact.
Communication and Connectivity
Digital technologies have made communication instantaneous, breaking geographical barriers. Social media platforms, messaging apps, and video conferencing tools have transformed personal relationships, professional collaboration, and information dissemination. The rise of platforms like Facebook, Twitter, and TikTok demonstrates how digital media reshapes culture, politics, and public discourse.
Education and Learning
Digital tools have revolutionized education by providing access to vast online resources, virtual classrooms, and personalized learning experiences. Platforms like Coursera, Khan Academy, and Duolingo exemplify how technology democratizes education, enabling lifelong learning.
Employment and Workforce Transformation
Automation, AI, and digital tools have shifted the nature of work. Routine manual jobs are increasingly automated, while demand grows for digital literacy, coding skills, and creative problem-solving. Remote work, facilitated by platforms like Zoom and Microsoft Teams, has redefined workplace structures and work-life balance.
Entertainment and Media
Streaming services like Netflix, YouTube, and Spotify exemplify how digital technologies have transformed entertainment, providing personalized, on-demand content. Gaming, augmented reality, and virtual reality experiences have created immersive digital worlds that redefine leisure and social interaction.
Governance and Civic Engagement
Digital platforms facilitate citizen engagement, e-governance, and transparency in government operations. From online voting systems to real-time public service tracking, digital technologies are enhancing civic participation and accountability.
5. Economic Implications of the Digital Revolution
The economic impact of the Digital Revolution is profound, influencing global markets, industries, and business models.
Emergence of the Digital Economy
The rise of digital platforms has created entirely new industries and revenue streams. E-commerce giants like Amazon and Alibaba, digital payment systems like PayPal and UPI, and sharing economy platforms like Uber and Airbnb exemplify the transformative economic impact.
Productivity and Efficiency
Automation, data analytics, and digital supply chain management have significantly increased productivity across sectors. Businesses can leverage real-time insights, optimize operations, and reduce costs through digital tools.
Globalization and Trade
Digital technologies have facilitated global trade by enabling real-time communication, online marketplaces, and digital logistics systems. Small and medium enterprises (SMEs) can now access international markets without extensive physical infrastructure.
Disruption of Traditional Industries
Traditional industries, such as retail, banking, and media, face disruption as digital alternatives gain prominence. Companies that fail to adapt risk obsolescence, while agile digital-first organizations capture market share.
6. Challenges and Risks of the Digital Revolution
Despite its benefits, the Digital Revolution presents several challenges:
Privacy and Data Security
The collection and storage of massive amounts of personal data raise privacy concerns. Cybersecurity threats, data breaches, and identity theft are persistent risks in a digitally connected world.
Digital Divide
Access to digital technologies remains uneven across regions and socioeconomic groups. The digital divide exacerbates inequalities, limiting opportunities for marginalized communities.
Ethical Concerns
AI-driven decision-making, surveillance technologies, and automated systems raise ethical questions about accountability, bias, and fairness. Societies must navigate the balance between innovation and ethical responsibility.
Environmental Impact
The digital infrastructure, including data centers and electronic devices, contributes to energy consumption and e-waste. Sustainable practices are essential to mitigate environmental consequences.
7. The Future of the Digital Revolution
The Digital Revolution continues to evolve, with emerging trends shaping the future:
Artificial Intelligence and Automation: AI systems will increasingly augment human capabilities, transforming industries from healthcare to finance. Ethical frameworks will be critical to guide responsible AI adoption.
Quantum Computing: This technology promises to revolutionize computational power, solving problems beyond the capacity of classical computers, from cryptography to climate modeling.
Metaverse and Immersive Technologies: Virtual and augmented reality are creating immersive digital environments for work, play, and social interaction, redefining the concept of presence.
Blockchain and Decentralization: Blockchain technology may transform finance, supply chains, and digital identity systems, promoting transparency and trust.
Sustainability and Green Technologies: Digital innovations will increasingly focus on sustainability, including energy-efficient computing, smart grids, and circular economies.
8. Conclusion
The Digital Revolution represents a fundamental transformation in human civilization, redefining how societies communicate, work, and thrive. Its impact spans every domain—economic, social, technological, and cultural. While it presents challenges such as privacy concerns, ethical dilemmas, and environmental implications, it also offers unprecedented opportunities for innovation, connectivity, and human advancement.
Embracing this revolution requires a balance between technological adoption and responsible governance. Societies must invest in education, digital literacy, and infrastructure to ensure inclusive participation. Businesses must innovate while safeguarding ethical standards, and individuals must adapt to lifelong learning in a rapidly changing digital landscape.
In essence, the Digital Revolution is more than a technological shift; it is a societal metamorphosis, redefining the very fabric of human interaction, economic activity, and global collaboration. Understanding and harnessing this revolution is not merely an option—it is an imperative for navigating the 21st century successfully.
EURUSD MULTI TIME FRAME ANALYSISHello traders , here is the full multi time frame analysis for this stock , let me know in the comment section below if you have any questions , the position will be taken only if all rules of the strategies will be satisfied. wait for more price action to develop before taking any position. I suggest you keep this pair on your watchlist and see if the rules of your strategy are satisfied.
🧠💡 Share your unique analysis, thoughts, and ideas in the comments section below. I'm excited to hear your perspective on this pair .
💭🔍 Don't hesitate to comment if you have any questions or queries regarding this analysis.

Powergrid: Falling wedge pattern- Bullish breakout.Price has given the breakout already, but the entry is pending as I'm waiting for a retest of the entry level 290-291.30 range as support to validate the entry level.
The stop loss will be the upper trendline of the falling wedge for the upper side target. Targets are set as recent swing highs. Targets are 301, 310, 317 and 321-324.
On a higher timeframe, a triangle pattern is also evident, but I'm more bullish on this stock. If the price falls back within the wedge, a new updated video will be shared.

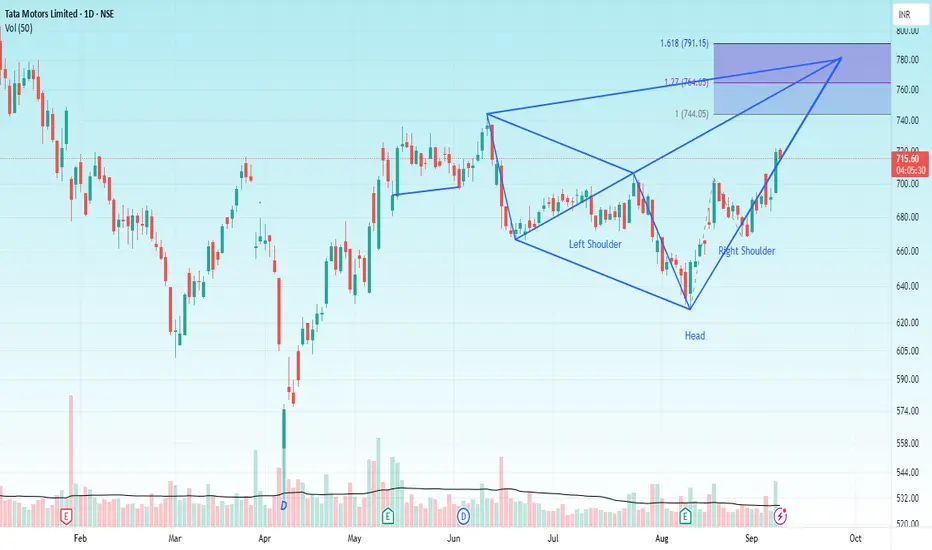
TATA MOTORS Hello & welcome to this analysis
The stock in daily time frame has given a double breakout
Inverse Head & Shoulder
Bullish Harmonic Seahorse
The upside levels as per IHS are 740 & 790 while the Seahorse pattern is indicating 775.
Both patterns have strong support at 690-700 and both would be considered invalid below 665
All the best
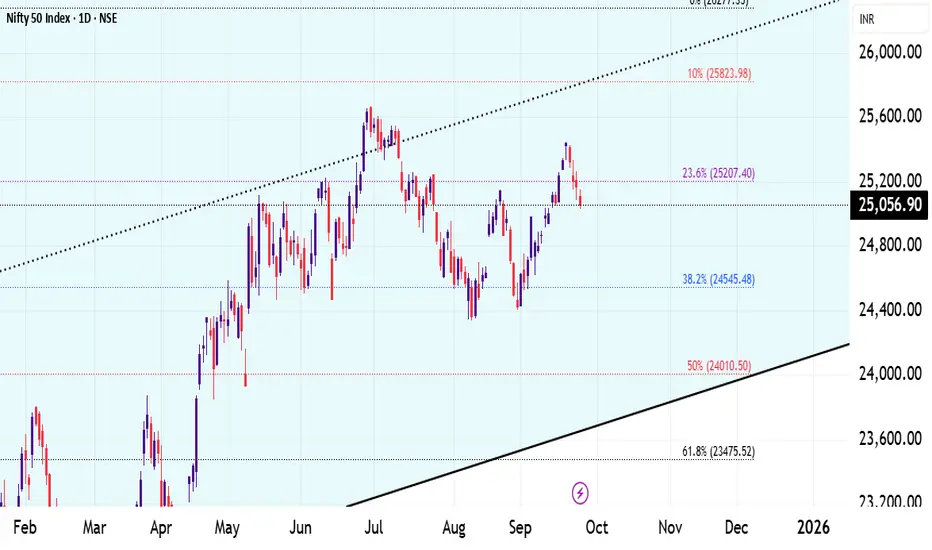
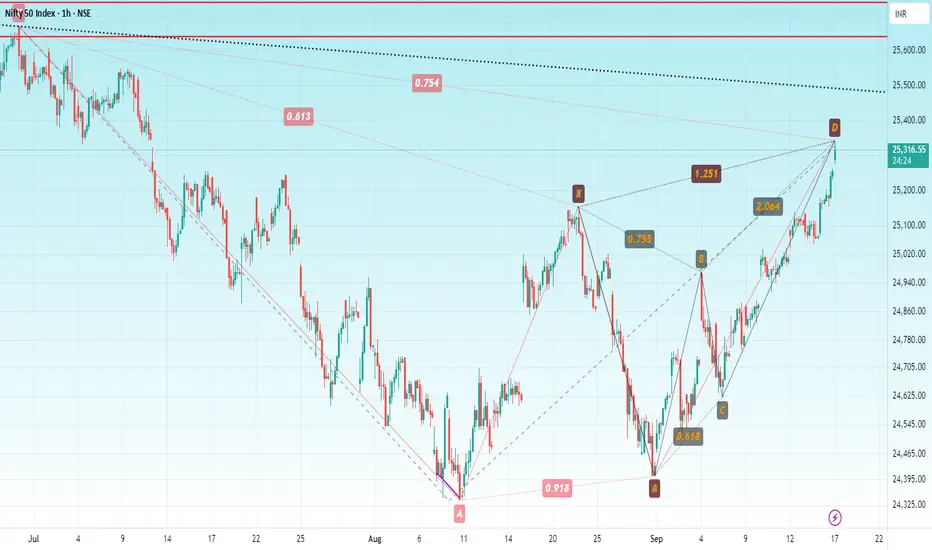
NIFTYHello & welcome to this analysis
On the eve of FOMC meet, the index has today covered the gap down made on July 11th and entered the potential reversal zone (PRZ) 25350 - 25425 of two bearish harmonic patterns - Butterfly (15m) & Gartley (daily).
Reversal confirmation as of now is once it starts giving a 60m close below 25225.
Pattern gets negated above 25525.
All the best
Regards
Divergenc Secrets1. Option Styles
American Options – Can be exercised at any time before expiration.
European Options – Can only be exercised on the expiration date.
Exotic Options – Customized contracts with complex features (used by institutions).
Most stock options in the U.S. are American-style, while index options are often European-style. In India, stock and index options are European-style.
2. Why Trade Options?
Options trading is popular because it offers:
Leverage – Control large stock positions with small capital.
Hedging – Protect portfolios against market declines.
Income Generation – By selling (writing) options and collecting premiums.
Speculation – Betting on price movements without owning the stock.
Flexibility – Strategies can be bullish, bearish, neutral, or even profit from volatility.
3. Risks in Option Trading
While options provide benefits, they also come with risks:
Limited life span – Options expire; if your prediction is wrong, you lose the premium.
Leverage risk – Small movements can cause large percentage losses.
Complexity – Strategies can be difficult for beginners.
Unlimited losses – Selling (writing) naked options can lead to unlimited loss potential.
4. Basic Option Strategies
a) Buying Calls
Suitable when expecting strong upward movement.
Limited risk (premium), unlimited reward.
b) Buying Puts
Suitable when expecting strong downward movement.
Limited risk, high reward potential.
c) Covered Call
Own the stock and sell a call option against it.
Generates income but caps upside potential.
d) Protective Put
Own the stock and buy a put as insurance.
Protects against downside risk.
e) Straddle
Buy both a call and put at the same strike and expiration.
Profits from large movements in either direction.
f) Strangle
Similar to straddle but with different strike prices.
Cheaper but requires bigger move.
g) Iron Condor
Sell one call and one put (out of the money) and buy further out-of-the-money options for protection.
Profits from low volatility.

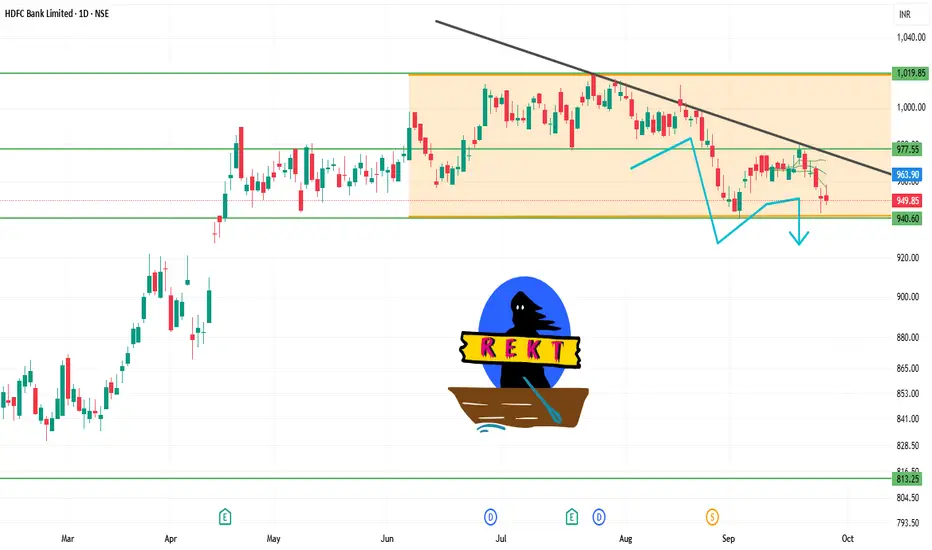
HDFCBANK 1D Time frame📊 Daily Snapshot
Closing Price: ₹949.20
Day’s Range: ₹947.40 – ₹958.00
Previous Close: ₹957.20
Change: Down –0.52%
52-Week Range: ₹806.50 – ₹1,018.85
Market Cap: ₹14.6 lakh crore
P/E Ratio: 20.66
Dividend Yield: 2.32%
EPS (TTM): ₹45.97
Beta: 0.92 (indicating lower volatility)
🔑 Key Technical Levels
Support Zone: ₹947.40 – ₹950.00
Resistance Zone: ₹957.20 – ₹960.00
All-Time High: ₹1,018.85
📈 Strategy (1D Timeframe)
1. Bullish Scenario
Entry: Above ₹957.20
Stop-Loss: ₹947.40
Target: ₹965.00 → ₹970.00
2. Bearish Scenario
Entry: Below ₹947.40
Stop-Loss: ₹957.20
Target: ₹940.00 → ₹935.00
Every time gold falls back, it is to reboundGold is no longer in a one-sided rally. Technically, it's undergoing a major correction. Our strategy is to follow the trend and prioritize both long and short positions. Now that we're seeing a major trend, the most common question we receive is whether a major decline has begun or whether gold has peaked. Yesterday's daily chart closed with a negative candlestick pattern, and the previous trading day also saw a vague tombstone candlestick pattern. Currently, we can only confirm short-term resistance, but we can't confirm a major trend peak or a bullish weekly trend. Furthermore, the short-term correction hasn't disrupted the bullish trend, so today we'll maintain a long strategy on pullbacks.
From a 4-hour analysis, effective support remains near the 3718-23 area, with upward pressure focused on the 3756-65 area. Our strategy is to primarily buy on pullbacks. In the intermediate range, be cautious and watchful.
Gold Trading Strategy:
Buy on pullbacks to the 3718-23 area, with a stop-loss at 3709 and a target of 3756-3765.

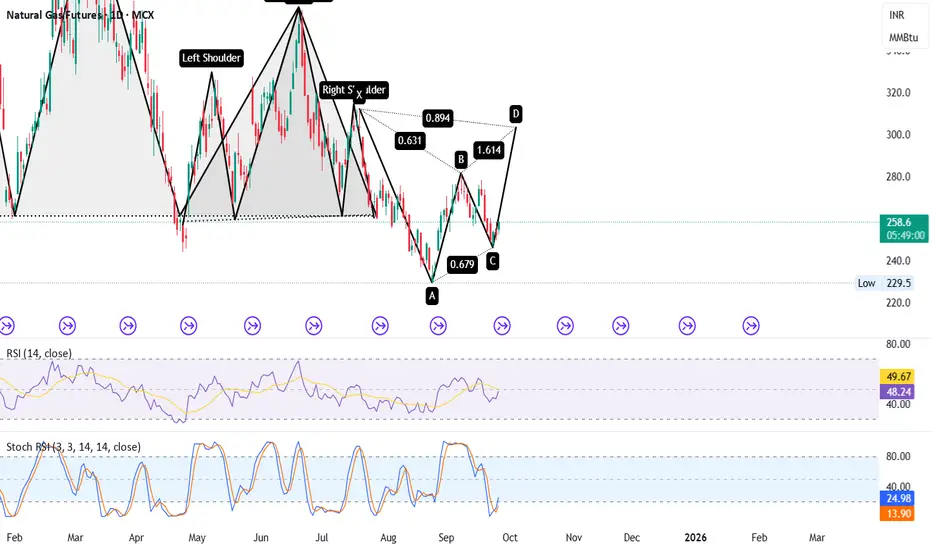
Natural Gas – Potential Bullish Reversal-304🔍 Key Highlights:
✅ XABCD Pattern Completion Zone:
XA to AB = 0.631 retracement
BC = 0.679 retracement
CD = 1.614 extension (projected move towards Point D)
✅ Bullish Structure in Progress:
Hidden Inverse Head & Shoulder supports bullish reversal
Confluence near Point C, increasing probability of trend reversal
✅ Momentum Confirmation:
RSI bouncing from neutral zone (47–49)
Stoch RSI reversing from oversold zone (13–23) – signaling early long buildup
🎯 Key Levels to Watch:
📈 Upside Target Zone (D): 1.614 extension zone
🛑 Invalidation: Break below recent Point C Low (229.5)
💡 Trading Insight:
This setup aligns with harmonic precision. If price holds the recent low and reverses with volume, Natural Gas may witness a strong upside bounce into the D leg completion.

ETHUSDT: Strong Uptrend with Solid SupportETHUSDT is currently experiencing a strong uptrend driven by the stability of the cryptocurrency market and strong fundamental factors. Despite some recent pullbacks, the primary trend remains bullish, supported by a solid foundation and positive investor sentiment.
Technical Analysis: ETHUSDT is currently testing a key support level at 3,985. If this level holds, there is a high probability of a rebound and continued upward momentum. The next resistance level is expected at 4,215.
Trading Strategy: If the price stays above the support level at 3,985, ETH is likely to continue rising towards the next resistance levels.
Outlook: Given the current fundamentals and technical indicators, ETHUSDT is likely to maintain its upward trajectory and target the 4,215 resistance level in the near future.

TCS - Time to go up towards 3500+ Bullish CRAB PRZ at play
TF: Daily
CMP: 2965
Here is my previous post on this script for a detailed review.
Price has completed the potential target as per the Bullish Crab pattern.
Results are due in the next couple of weeks.
I expect the stock to bounce from this zone 2900-2950 and potentially march towards 3500+ in the coming weeks
Internal wave counts are also marked in this chart.
I will await bullish confirmation candle in this zone for a good RR entry.
Disclaimer: I am not a SEBI registered Analyst and this is not a trading advise. Views are personal and for educational purpose only. Please consult your Financial Advisor for any investment decisions. Please consider my views only to get a different perspective (FOR or AGAINST your views). Please don't trade FNO based on my views. If you like my analysis and learnt something from it, please give a BOOST. Feel free to express your thoughts and questions in the comments section.
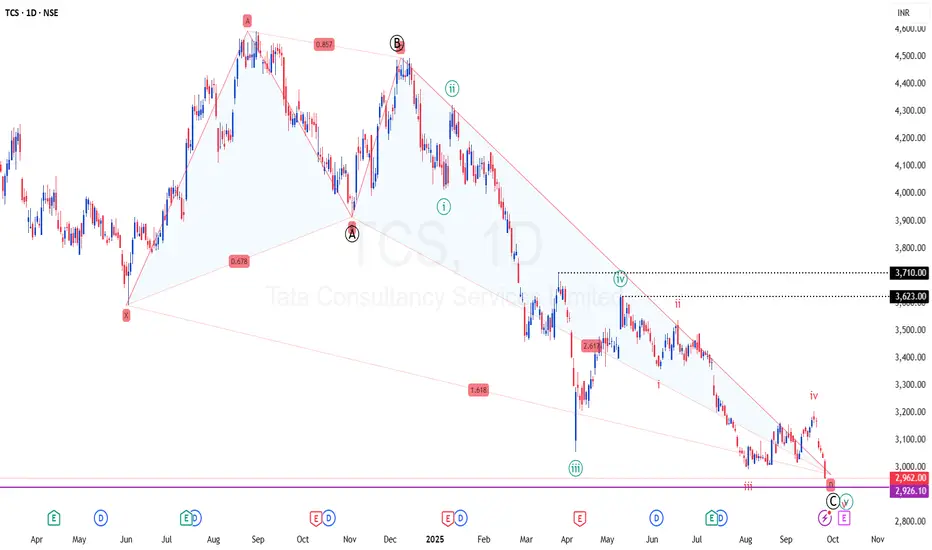
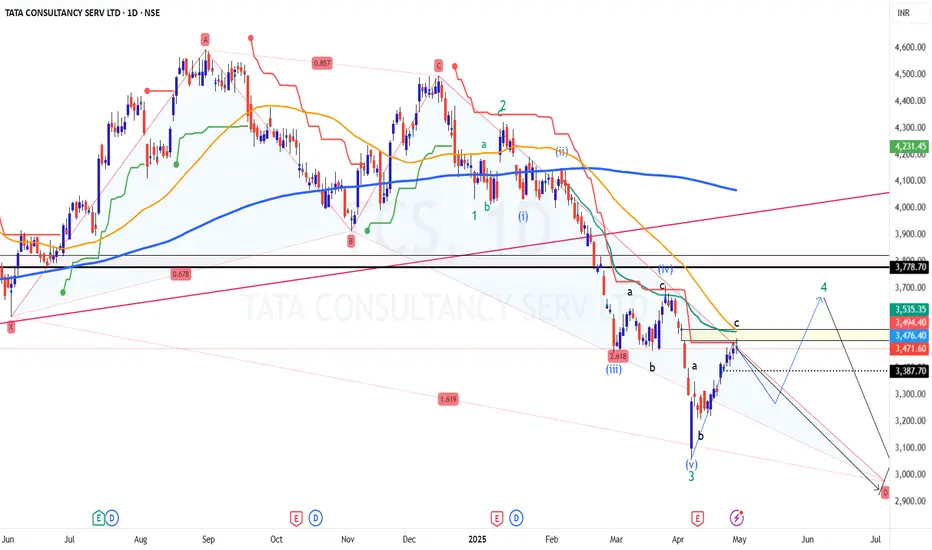
TCS at Confluence of Resistance / EMA / ST/ GAP/ AVWAP / FIB
Between 3500-3550, TCS could face strong resistance on multiple fronts and they are listed below.
Daily SuperTrend
GAP Zone
50 DEMA at 3540 (retesting it after a long time, expect a rejection)
Fib retracement of 61.8% of the recent swing
Avwap from the recent swing (at 3530)
100% (abc pullback) from the swing low (at 1498)
Daily chart with Harmonic pattern, suggests that one more low at 3000 odd levels is due. The same is being observed as per the EW counts
Here is the chart with possible path/count/target destinations
Finally, this is a first bounce after a sharp correction; expect first bounces to be sold in to, similarly, first dip will be bought in to.
In all likelihood, I am not expecting TCS to go up much from here.. expecting a meaningful decline before resuming the upmove.
Disclaimer: I am not a SEBI registered Analyst and this is not a trading advise. Views are personal and for educational purpose only. Please consult your Financial Advisor for any investment decisions. Please consider my views only to get a different perspective (FOR or AGAINST your views). Please don't trade FNO based on my views. If you like my analysis and learnt something from it, please give a BOOST. Feel free to express your thoughts and questions in the comments section.