Impact of US Federal Reserve and Interest Rate DecisionsThe Indian Economy:
The monetary policy decisions of the United States Federal Reserve (commonly known as the Fed) have far-reaching consequences beyond the US economy. As the world’s most influential central bank, the Fed’s interest rate actions significantly affect global liquidity, capital flows, currency movements, commodity prices, and investor sentiment. For an emerging economy like India—deeply integrated into global trade and financial systems—changes in Fed rates play a crucial role in shaping economic growth, inflation dynamics, financial markets, and policy responses. Understanding this relationship is essential for policymakers, businesses, investors, and households.
1. The Federal Reserve and Its Global Influence
The Federal Reserve primarily adjusts interest rates to manage inflation, employment, and economic stability in the United States. However, because the US dollar is the world’s reserve currency and US financial markets dominate global capital flows, Fed rate decisions influence borrowing costs and investment decisions worldwide. When the Fed raises interest rates, global liquidity tends to tighten; when it cuts rates, liquidity expands. These shifts directly and indirectly affect emerging markets like India.
2. Capital Flows and Foreign Investment in India
One of the most immediate impacts of Fed rate changes on India is through foreign capital flows. When the Fed raises rates, US assets become more attractive due to higher yields and lower perceived risk. This often leads to Foreign Institutional Investors (FIIs) pulling money out of emerging markets, including India, and reallocating it to US bonds and equities. Such outflows can lead to volatility in Indian equity and debt markets.
Conversely, when the Fed pauses or cuts rates, global investors search for higher returns, making India an attractive destination due to its relatively strong growth prospects. This can result in increased foreign portfolio investment, boosting stock markets and improving liquidity conditions.
3. Impact on the Indian Rupee and Exchange Rates
Fed rate hikes typically strengthen the US dollar. A stronger dollar puts depreciation pressure on the Indian rupee. Rupee depreciation makes imports—especially crude oil, natural gas, and other commodities—more expensive, contributing to imported inflation. On the other hand, a weaker rupee can benefit exporters by making Indian goods more competitive globally.
When the Fed cuts rates, the dollar often weakens, which can support the rupee. A stable or appreciating rupee helps contain inflation and reduces the cost of imports, but it may slightly reduce export competitiveness. The Reserve Bank of India (RBI) closely monitors these movements and may intervene in forex markets to reduce excessive volatility.
4. Inflation Dynamics and Monetary Policy in India
Fed rate decisions influence global inflation trends and commodity prices, which directly affect India. Higher US interest rates often cool global demand, leading to softer commodity prices. For India, this can reduce inflationary pressures, particularly from oil and metals.
However, capital outflows and currency depreciation caused by Fed hikes can offset these benefits by increasing import costs. In such scenarios, the RBI faces a policy dilemma: whether to raise domestic interest rates to control inflation and stabilize the rupee or to prioritize growth by keeping rates accommodative.
When the Fed adopts an easing stance, global liquidity increases, often pushing commodity prices higher. While this supports global growth, it can raise inflation risks for India, forcing the RBI to act cautiously.
5. Impact on Indian Interest Rates and Borrowing Costs
Although the RBI sets interest rates based on domestic conditions, Fed actions indirectly influence Indian interest rates. Persistent Fed tightening can pressure the RBI to maintain relatively higher rates to prevent excessive capital outflows and currency instability. This leads to higher borrowing costs for Indian businesses and consumers, affecting investment, housing demand, and consumption.
In contrast, a dovish Fed provides the RBI with more room to cut rates or maintain an accommodative stance, supporting credit growth and economic expansion.
6. Effects on Indian Equity Markets
Indian stock markets are highly sensitive to global monetary conditions. Fed rate hikes generally lead to risk aversion, causing corrections in equities, especially in sectors dependent on foreign capital such as IT, banking, and real estate. Growth stocks often underperform during high interest rate cycles due to higher discount rates.
On the other hand, Fed rate cuts or expectations of easing usually fuel global equity rallies. Indian markets benefit from increased foreign inflows, improved liquidity, and positive sentiment, often leading to higher valuations.
7. Impact on Debt Markets and Government Borrowing
Fed tightening can raise global bond yields, influencing Indian government securities (G-Secs). Higher yields increase borrowing costs for the Indian government, potentially widening fiscal deficits. Corporate bond yields may also rise, making debt financing more expensive for companies.
When the Fed eases, global yields tend to soften, which can help lower Indian bond yields, ease government borrowing pressures, and support infrastructure and development spending.
8. Trade, Exports, and Global Demand
Fed rate decisions influence the pace of global economic growth. Aggressive rate hikes can slow down the US and global economy, reducing demand for Indian exports such as IT services, pharmaceuticals, textiles, and engineering goods. This can negatively impact India’s trade balance and corporate earnings.
A dovish Fed stance, encouraging global growth, can boost export demand and improve India’s external sector performance.
9. RBI’s Strategic Response to Fed Actions
The RBI does not mechanically follow the Fed but considers its actions while formulating policy. India’s strong foreign exchange reserves, improving macroeconomic fundamentals, and domestic demand provide some insulation. The RBI uses a combination of interest rate adjustments, liquidity management, and forex interventions to mitigate the spillover effects of Fed policies.
10. Long-Term Perspective for India
In the long run, India’s economic trajectory depends more on domestic reforms, productivity growth, fiscal discipline, and structural factors than on external monetary cycles. However, Fed rate decisions remain an important external variable that can influence short- to medium-term volatility.
Conclusion
The US Federal Reserve’s interest rate decisions have a profound and multi-dimensional impact on the Indian economy. From capital flows and currency movements to inflation, interest rates, and market sentiment, Fed actions shape India’s macroeconomic environment. While India has built resilience through strong reserves and prudent policymaking, it cannot remain completely immune to global monetary shifts. A balanced and flexible policy approach by the RBI, combined with structural economic strength, is key to navigating the challenges and opportunities arising from changing Fed rate cycles.
Harmonic Patterns

Indian Stock Market: The Pulse of India’s Economic GrowthStructure and Foundation of the Indian Stock Market
The Indian stock market primarily operates through two major exchanges: the Bombay Stock Exchange (BSE) and the National Stock Exchange (NSE). The BSE, established in 1875, is Asia’s oldest stock exchange, while the NSE, launched in 1992, revolutionized trading with its fully electronic platform. Together, these exchanges ensure transparency, liquidity, and efficient price discovery for thousands of listed companies across sectors.
At the heart of the market lies the Securities and Exchange Board of India (SEBI), the regulatory authority responsible for protecting investor interests and maintaining fair market practices. SEBI’s regulatory framework has strengthened corporate governance, improved disclosure standards, and enhanced market integrity, making the Indian stock market more credible and attractive to domestic as well as global investors.
Key Indices and Market Representation
Market indices serve as barometers of overall market performance. The BSE Sensex, comprising 30 blue-chip companies, and the NSE Nifty 50, representing 50 of the largest and most liquid stocks, are the most widely tracked indices in India. These indices reflect the collective performance of key sectors such as banking, IT, pharmaceuticals, energy, FMCG, and automobiles.
Beyond these benchmarks, sectoral and thematic indices allow investors to gauge performance in specific industries or investment themes. This diversity enables market participants to align their investment strategies with macroeconomic trends and sector-specific opportunities.
Participants in the Indian Stock Market
The Indian stock market is driven by a diverse set of participants, each playing a distinct role. Retail investors form the backbone of market liquidity, increasingly participating through online trading platforms and mutual funds. Institutional investors, including domestic institutions like mutual funds and insurance companies, provide long-term stability to the market.
Foreign Institutional Investors (FIIs), now referred to as Foreign Portfolio Investors (FPIs), significantly influence market trends through capital inflows and outflows. Their participation links the Indian market to global economic developments, making it responsive to international events such as interest rate changes, geopolitical tensions, and global growth cycles.
Role of Technology and Digital Transformation
Technology has been a game changer for the Indian stock market. The introduction of electronic trading, online brokerage platforms, and mobile trading apps has democratized access to markets. Investors can now trade in real time, analyze data instantly, and manage portfolios with greater efficiency.
Advanced tools such as algorithmic trading, artificial intelligence, and big data analytics have further transformed market operations. These innovations have improved execution speed, reduced transaction costs, and enhanced market depth, making the Indian stock market more competitive on a global scale.
Economic Linkages and Market Drivers
The Indian stock market is closely intertwined with the country’s economic fundamentals. Factors such as GDP growth, inflation, interest rates, fiscal policies, and corporate earnings directly impact market sentiment. Government reforms, infrastructure spending, and policy initiatives like “Make in India” and digitalization efforts often create new investment opportunities.
Global factors also play a crucial role. Movements in crude oil prices, currency exchange rates, and global equity markets influence Indian stocks, particularly in export-oriented and import-dependent sectors. As India integrates further with the global economy, these linkages continue to strengthen.
Investment Opportunities and Wealth Creation
One of the most compelling aspects of the Indian stock market is its potential for long-term wealth creation. Historically, equities have outperformed most other asset classes over extended periods, rewarding patient investors. The rise of systematic investment plans (SIPs) in mutual funds has encouraged disciplined investing, allowing individuals to participate in equity markets with lower risk and greater consistency.
The growing startup ecosystem, frequent initial public offerings (IPOs), and expansion of small and mid-cap companies provide investors with opportunities across different risk-return profiles. This breadth makes the Indian stock market suitable for both conservative and aggressive investors.
Risks, Volatility, and Investor Awareness
Despite its growth potential, the Indian stock market is not without risks. Market volatility, driven by economic uncertainties, policy changes, and global events, can lead to short-term fluctuations. Behavioral biases, lack of financial literacy, and speculative trading can also expose investors to losses.
However, increased investor education, regulatory safeguards, and the availability of diversified investment products have helped mitigate these risks. A focus on long-term fundamentals, risk management, and asset allocation remains essential for sustainable investing.
Future Outlook of the Indian Stock Market
The future of the Indian stock market appears promising, supported by favorable demographics, rising income levels, and a growing middle class. Continued reforms, technological advancements, and increased participation from both domestic and global investors are likely to deepen market maturity.
As India aspires to become a major global economic powerhouse, its stock market will play a crucial role in channeling capital, fostering innovation, and supporting sustainable growth. For investors, the Indian stock market offers not just opportunities for financial returns but also a chance to participate in the nation’s economic journey.
Conclusion
In essence, the Indian stock market is more than a platform for buying and selling shares—it is a reflection of India’s economic vitality and future potential. Its evolution, driven by regulation, technology, and investor participation, underscores its importance in the global financial landscape. For those who understand its dynamics and invest with discipline, the Indian stock market remains a powerful tool for wealth creation and economic progress.

#Nifty Directions and Levels for Jan 13thThe structure suggests that the market could consolidate between today’s high and the immediate support level. However, if it breaks either above today’s high or below today’s low, we can expect gradual ups and downs toward the next targets

#Banknifty Directions and Levels for Jan 13thThe structure suggests that the market could consolidate between today’s high and the immediate support level. However, if it breaks either above today’s high or below today’s low, we can expect gradual ups and downs toward the next targets.

Mejor Forex Pair Scanning Session – 1Scanning multiple forex pairs to filter high-quality trade setups. No trades forced, only structure-based opportunities.

$XMR Hits New ATH $650: But Here’s My WarningOMXSTO:XMR Hits New ATH $650: But Here’s My Warning
Privacy Coin Just Hit An All-Time High Exactly When Dubai Banned Privacy Coins.
Classic Crypto, They Ban It, We Pump It 😂
The Returns:
2 Years → 6x
1 Year → 3.5x
2026 (Just 13 Days) → +57%
My Honest View:
🔹 Global Regulations Are Tightening Hard On Privacy Coins Like OMXSTO:XMR And $ZEC.
🔹 Remember What Happened To CRYPTOCAP:ZEC ?
🔹 Pumped To $775 → Crashed To $300
🔹 That’s A 61% Dump In Just A Few Days.
When Regulators Target Something This Aggressively, These Pumps Can Turn Into Exit Liquidity Before Major Crashes.
My Suggestion:
❌ No Fresh Entries At This Level
✅ If Holding: Consider Booking Profits
⚠️ If You Still Want In (FOMO Mode): ALWAYS Use Stop Loss
Risk Here Is HIGH. Potential Reward Is LIMITED.
This Isn’t FUD: This Is Risk Management.
Stay Smart. Book Profits. Protect Capital.
Not Financial Advice & DYOR: Just Awareness For My Community 🙏

BTCUSD · 15M · SMC BiasPrice is currently compressing inside a higher-timeframe premium discount equilibrium, respecting a clear range structure.
HTF Context
Equal highs / liquidity resting above the range highs.
Premium zone overhead aligned with prior supply + inducement.
Discount zone below marked by clean HTF demand.
LTF Narrative
Market already delivered a strong impulsive leg up.
Current consolidation suggests liquidity engineering, not continuation.
Upside push toward the equal highs is likely a liquidity grab, not acceptance.
Expectation
Sweep of buy-side liquidity into the premium zone.
Immediate reaction from supply.
Sharp displacement to the downside targeting:
Range low
Discount imbalance
HTF demand below
Execution Plan
No chasing longs in premium.
Wait for:
Liquidity sweep above highs
Bearish displacement
LTF MSS confirmation
Shorts favored post confirmation.
Targets trail into discount until opposing demand shows intent.

RIVER COIN LOOKING BULLISH As per price action its looks bullish from the current market price
on other half we can alts market looks bullish so we can can long from her let see what next come


$TON BREAKOUT SETUP | MACRO CHANNEL TARGET $30 | CRYPTOPATELLSE:TON / USDT: Weekly Price Forecast | CryptoPatel
TON is trading at a major HTF support confluence on the weekly timeframe after a prolonged corrective move from the 2024 highs.
Technical Structure:
Price continues to respect a macro ascending channel in play since 2022. Within this structure, TON has been correcting inside a descending channel from the ~$8 high, indicating a controlled correction rather than trend failure.
The current price is reacting from the lower boundary of the descending channel, which also aligns with long-term ascending trendline support — a key accumulation zone historically.
Key Levels & Confirmation:
• Weekly close above $2.70 = descending channel breakout
• Reclaim of $3.50 = bullish trend resumption
• Measured move projects toward $28–$30 zone (upper macro channel)
Targets: $3.50 → $7 → $15 → $30+
Invalidation: Weekly close below $1.20
This is a high time-frame accumulation setup with asymmetric risk-reward, best suited for spot and long-term positioning.
TA Only. Not Financial Advice. Always Manage Risk.

TATA Moters Bullish ViewHere is a clear and professional **Company Overview of Tata Motors** in English:
---
## 📌 Company Overview: Tata Motors
**Tata Motors Limited** is one of India’s leading **automotive manufacturers** and a flagship company of the **Tata Group**. It designs, manufactures, and sells a wide range of vehicles including **passenger cars, utility vehicles, trucks, buses, and electric vehicles**.
---
### 🔹 Founded
**1945**
### 🔹 Founder
**Jamsetji Tata** (Tata Group)
### 🔹 Headquarters
**Mumbai, Maharashtra, India**
### 🔹 Industry
**Automobile Manufacturing**
### 🔹 Company Type
**Public Listed Company**
(Listed on NSE & BSE)
---
## 🚗 What Tata Motors Does
Tata Motors operates across multiple automotive segments:
### 🔹 Passenger Vehicles
* Cars & SUVs (ICE and EVs)
* Popular brands: Nexon, Punch, Harrier, Safari, Tiago
### 🔹 Electric Vehicles (EV)
* Market leader in India’s EV segment
* Nexon EV, Tiago EV, Tigor EV
### 🔹 Commercial Vehicles
* Trucks, buses, defense vehicles
* Strong presence in domestic & international markets
### 🔹 Luxury Vehicles (Global)
* Owner of **Jaguar Land Rover (JLR)**
(Luxury cars & SUVs sold worldwide)
---
## 🌍 Global Presence
* Operations in **125+ countries**
* Manufacturing plants in India, UK, Slovakia, Thailand, and South Africa
* Strong export network
---
## ⭐ Key Strengths
* Strong brand value & Tata Group backing
* Leadership in Electric Vehicles in India
* Diverse product portfolio
* Global presence via JLR
* Focus on sustainability & innovation
---
## 💼 Business Model
Tata Motors earns revenue through:
* Vehicle sales (passenger & commercial)
* Electric vehicle solutions
* Spare parts & after-sales services
* International operations (JLR)
---
## 🌱 Sustainability & Innovation
* Commitment to **clean mobility**
* Investment in EVs, hydrogen, and alternative fuels
* Focus on safety, design, and technology
---
If you want, I can also provide:
* 📊 **SWOT Analysis of Tata Motors**
* 📈 **Financial Highlights**
* 🆚 **Tata Motors vs Maruti vs Mahindra**
* 🧾 **Investor Presentation–style summary**

Infosys Price Bearish New Long Near 1460Here is a clear and professional **Company Overview of Infosys** in English:
---
## 📌 Company Overview: Infosys
**Infosys Limited** is a leading global provider of **digital services, consulting, and IT solutions**. The company helps clients navigate digital transformation through technology-driven innovation and industry expertise.
---
### 🔹 Founded
**1981**
### 🔹 Founders
**N. R. Narayana Murthy** and six co-founders
### 🔹 Headquarters
**Bengaluru, Karnataka, India**
### 🔹 Industry
**Information Technology Services & Consulting**
### 🔹 Company Type
**Public Listed Company**
(Listed on NSE, BSE, and NYSE)
---
## 🏢 What Infosys Does
Infosys delivers end-to-end IT services including:
* Digital transformation
* Software development and maintenance
* Cloud computing services
* Artificial Intelligence (AI) & Automation
* Data analytics and big data solutions
* Cybersecurity services
* Enterprise consulting
---
## 🌍 Global Presence
* Operations in **50+ countries**
* Serves clients across industries such as:
* Banking & Financial Services
* Insurance
* Retail & E-commerce
* Manufacturing
* Telecom
* Healthcare
---
## ⭐ Key Strengths
* Strong global brand and reputation
* Large, skilled workforce
* Focus on innovation and R&D
* Robust corporate governance
* Long-term relationships with global clients
---
## 💼 Business Model
Infosys generates revenue primarily through:
* IT consulting and managed services
* Digital and cloud-based solutions
* Long-term enterprise contracts
---
## 🌱 Sustainability & Values
Infosys is known for:
* Strong ESG (Environmental, Social, Governance) practices
* Carbon neutrality initiatives
* Ethical business conduct and transparency
---
If you want, I can also provide:
* 📊 **SWOT Analysis of Infosys**
* 📈 **Financial Highlights**
* 🆚 **Infosys vs TCS comparison**
* 🧾 **Investor-style company profile**

NIFTY 12th Expiry - jackpot -- tgt 26020/26082/26192 if holdsAs highlighted yesterday, today’s dip near 25,500 offered a solid buying opportunity, with the index rebounding to 25,817 — a gain of nearly 300 points.
Next move: A sustained break above 25,900 could trigger a strong rally.
Key hurdle: Watch the 25,867–25,980 zone; once cleared, upside targets open at 26,020 / 26,082 / 26,192+.
If not achieved by expiry, these levels may still be reached within 3–4 sessions.
Strategy: stay on CALL side for upside momentum and any dip is buying opportunity

XAUUSD (Gold) | Technical Outlook | 12th Jan'2026XAUUSD (Gold Spot) | Technical Outlook | 12th Jan'2026
Gold is trading near 4,593, gaining +1.83% intraday and holding close to record highs around 4,601. The overall trend remains strongly bullish across all timeframes, with price well above all major moving averages. Momentum indicators continue to support the upside, while short-term indicators show overbought conditions, hinting at possible intraday pullbacks or consolidation before the next move higher.
Key Decision Zone: 4,570 – 4,585
Above 4,585, bulls stay in control with upside targets at 4,600–4,605, followed by 4,620 and 4,650. Below 4,570, short-term profit booking may extend toward 4,550, 4,520, and 4,500. Shorts should be treated as intraday only, as the higher-timeframe trend remains bullish.
Above 4,585 → Bullish 🐂
Below 4,570 → Short-term Bearish 🐻
⚠️ Disclaimer:
This analysis is for educational purposes only. Not a buy/sell recommendation. Trade with proper risk management.

Divergence Secrets Pros of Option Trading
✔ Low capital requirement
✔ High leverage
✔ Risk-defined trades
✔ Can profit in any market condition
✔ Wide variety of strategies
✔ Best tool for hedging
✔ High return potential
Cons of Option Trading
✘ Complexity for beginners
✘ Time decay risk
✘ Requires knowledge of volatility
✘ High risk for option sellers
✘ Emotional pressure
✘ Requires active monitoring

OFSS -7584-7348 Buy ZoneThe stock is holding a strong support zone and may see a reversal within 1–2 days.
Upside target: Open for a big move toward ₹8200/8500/9000+.
Current level: Around ₹7584.
Any dip near ₹7348 should be viewed as a buying opportunity

ADANIGREEN - Good buy levels 930 levelsThe stock is holding a strong support zone and may see a reversal within 1–2 days.
Upside target: Open for a big move toward ₹1140+.
Current level: Around ₹940.
Any dip near ₹930 should be viewed as a buying opportunity

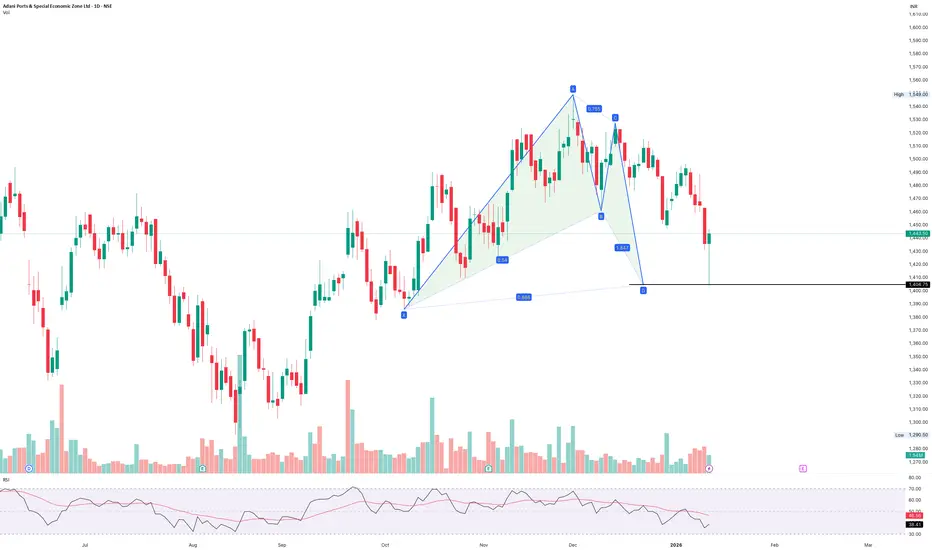
ADANIPORT - DOT TO DOT REVERSAL at 1404The stock is holding a strong support zone and may see a reversal now.
Upside target: Open for a big move toward ₹1540+.
Current level: Around ₹1443.
Any dip near ₹1420/1405 should be viewed as a buying opportunity.
ADANIENT - 2119 reversed today - GOOD BUY FOR UPSIDEThe stock is holding a strong support zone and may see a good reversal on the upside within 1–2 days.
Upside target: Open for a big move toward ₹2362/2411/2444+.
Current level: Around ₹2171.
Any dip near ₹2150 should be viewed as a buying opportunity

DMART - on good buy levels 3600-3700The stock is holding a strong support zone and may see a good iupside in coming days
Upside target: Open for a big move toward ₹4484/4830/5033+++.
Current level: Around ₹3832.
Any dip near ₹3600 should be viewed as a buying opportunity

DLF on support zone for BUY @650The stock is holding a strong support zone and today reversed from the bottom.
if this low holds which is 648 levels in 1–2 days.
Upside target: Open for a big move toward ₹700/750/800 levels+.
Current level: Around ₹648.
Any dip below current level should be viewed as a buying opportunity

Prestige Estate on reversal Zone soon 1490 levels The stock is heading towards a strong support zone and may see a reversal within 1–2 days.
Upside target: Open for a big move toward ₹1778+.
Current level: Around ₹1505.
Any dip near ₹1490 should be viewed as a buying opportunity.

Godrejprop - On reversal - BUY ZONE 1900-1930 levelsThe stock is holding a strong support zone and may see a reversal within 1–2 days.
Upside target: Open for a big move toward ₹2353+.
Current level: Around ₹1930.
Any dip near ₹1900 should be viewed as a buying opportunity.
