CALLED ETH CRASH AT $3,700. NOW 65% DOWN. CALLED ETH CRASH AT $3,700. NOW 65% DOWN. ACCUMULATION ZONE ACTIVATED
REMEMBER MY WARNING?
When ETH Broke $3,700-$3,600 Support, I told you: "Major Breakdown Incoming"
THE RESULT:
✅ Entry Warning: $3,700
✅ Current Price: ~$1,700
✅ Total Drop From Our Entry: -54% (65% from Peak in Last 6 months)
ACCUMULATION ZONES:
✅ Zone 1: $2,000-$1,800 - FILLED (First Bids Triggered)
🎯 Zone 2: $1,400-$1,270 (0.786 Fib) - BIDS PLACED
→ This is maximum Pain Zone
→ Historical Bounce Level
→ Best Long-Term Entry
WHY I’M LONg-TERM BULLISH ON CRYPTOCAP:ETH :
→ U.S. ETH ETFs Have Accumulated 6M ETH ($55B) in ~18 months
→ Bitmine Continues aggressive Accumulation, Now Holding 4.28M ETH (~$13B+)
→ Combined with Other ETH-Strategy Firms, Institutions Now Control ~13M ETH
This Level of Structural, Long-Term Demand is Extremely Bullish for Ethereum’s Next Cycle.
Long-Term Targets: $10,000-$20,000 (5-10x Potential)
MY APPROACH:
1️⃣ Scale in Slowly (Not All-In)
2️⃣ Place Bids at Key Technical Levels
3️⃣ Let Market Come to Me
4️⃣ Think in Years, Not Weeks
THE MINDSET (THE REALITY):
❌ Most Bought at $3,700 (Greed)
✅ I'm Buying at $1,800 (Fear)
This is how generational wealth is built in crypto.
IMPORTANT:
This is NOT Short-term Trading, This is LONG-TERM Accumulation
65-80%% Corrections = Normal in Crypto
Next Bull Run = 500-1000% Moves
THE FIBONACCI PROOF:
0.618 Fib ($1,700) = Current Support Test
0.786 Fib ($1,270) = Maximum Opportunity
More Downside Possible Before Reversal.
But When $10K-$20K Hits, You'll Remember this Post.
NFA. ALWAYS DYOR. Scale in Smart.
Harmonic Patterns

BTCUSD Trend Outlook and Key Price ZonesBTCUSD is trading in a clear bearish trend after strong and continuous selling pressure. Price is making lower highs and lower lows, showing sellers are still in control. The market has now reached an important support and demand area near 65,000, where some short-term stability is visible. This zone is crucial for buyers to hold. If price sustains above this level, a slow recovery toward 68,000 is possible, followed by resistance near 70,000–72,000, where selling was seen earlier. These levels may act as strong supply zones. On the downside, a clear break below 65,000 can increase downside momentum and open the path toward 63,500 and further toward 61,000. Overall trend remains bearish unless price breaks above key resistance and forms a higher low. Any buying at current levels should be cautious and based on confirmation. Proper risk management is important in this volatile market.

DAILY FOREX SCAN Session – 26 05 02 26Scanning multiple forex pairs to filter high-quality trade setups. No trades are forced—only structure-based opportunities.
Note: There may be a delay in this video due to upload processing time.
Disclaimer: FX trading involves high leverage and substantial risk, and losses can exceed your initial investment. This content is for educational purposes only and should not be considered financial advice. Trade at your own risk.

NIFTY- Intraday Levels - 6th Feb 2026If NIFTY sustain above 25676/87/707 then 25742/83 then above this bullish above this wait more levels marked on chart
If NIFTY sustain below 25604/596 then 25968/54 below this bearish below this wait more levels marked on chart
Consider some buffer points in above levels.
Please do your due diligence before trading or investment.
**Disclaimer -
I am not a SEBI registered analyst or advisor. I do not represent or endorse the accuracy or reliability of any information, conversation, or content. Stock trading is inherently risky and the users agree to assume complete and full responsibility for the outcomes of all trading decisions that they make, including but not limited to loss of capital. None of these communications should be construed as an offer to buy or sell securities, nor advice to do so. The users understands and acknowledges that there is a very high risk involved in trading securities. By using this information, the user agrees that use of this information is entirely at their own risk.
Thank you.

US 100 - High time frame liquidity sweep + bullish reversal🔎 Description
US100 has tapped into a major demand zone after a sharp downside sweep, collecting liquidity below previous swing lows. Price has reacted strongly from the confluence of:
HTF ascending trendline support
4H demand block
Liquidity sweep + aggressive rejection wick
Fair value gap alignment
The structure suggests a potential bullish corrective leg as long as the demand zone holds.
📝 Trade Idea
Bias: Long (Counter-trend corrective move)
Entry: 25,163 (Reaction zone already tested)
Stop-Loss: Below liquidity sweep low – 24,880
Take-Profit Targets:
TP1: 25,472 (FVG + minor resistance)
TP2: 25,700 (Major supply zone)
TP3: 25,790 (HTF liquidity)**
Risk-to-Reward: ~1:2+
Disclaimer: For educational purpose

Probable moves after 05 feb 2026NIFTY is currently moving inside a falling channel (descending channel) after a sharp drop.
🔍 Market Structure
Price is making lower highs and lower lows → short-term downtrend.
The two parallel trendlines show a consolidation within a bearish channel.
Volatility has reduced → market is in compression mode.
This indicates indecision and preparation for a breakout.
📐 Key Zones
Resistance (Upper Channel):
Around 25,780 – 25,850
Break above this = bullish signal
Support (Lower Channel):
Around 25,580 – 25,600
Break below this = bearish continuation
Current price is near support, which is a crucial area.
🔁 Possible Scenarios
✅ 1. Bullish Breakout (Positive Bias)
If price:
Breaks and sustains above the upper channel
With good volume
Then:
➡️ Target: 25,900 – 26,000+
➡️ Trend reversal possible
⚠️ 2. Bearish Breakdown (Negative Bias)
If price:
Breaks below 25,580
Then:
➡️ Target: 25,450 – 25,300
➡️ Downtrend resumes
🔄 3. Range / Whipsaw (Most Likely Short-Term)
If price stays inside the channel:
Expect zig-zag movement
Small swings
Difficult for positional trades
Only scalping works in this phase.
🧠 Price Action View
No strong buyers yet
Sellers losing momentum
Market is waiting for trigger (news/data/participation)
This is a “make-or-break” zone.
📌 Trading Insight (Pullback Style)
✔️ Best Trade = Wait for Breakout + Retest
Buy only after channel breakout + pullback
Sell only after breakdown + pullback
Avoid prediction. Trade confirmation.

Momentum Patterns in Cryptocurrency MarketsUnderstanding Momentum in Crypto Markets
Momentum refers to the speed and strength of price movement in a particular direction. In crypto markets, momentum is driven by a combination of factors such as liquidity inflows, news events, social media hype, whale activity, derivatives positioning, and macroeconomic sentiment.
Unlike equities, where institutional flows dominate, crypto momentum often begins with retail enthusiasm and is amplified by leverage in futures markets. This creates exaggerated price movements, making momentum patterns more pronounced and more frequent.
Why Momentum Is Stronger in Cryptocurrencies
Cryptocurrency markets exhibit stronger momentum patterns than most traditional assets due to:
High Volatility – Daily moves of 5–15% are common.
Leverage Availability – Futures allow 10x–100x leverage, accelerating trends.
24/7 Trading – No closing bell means trends evolve continuously.
Narrative-Driven Moves – News, tweets, and narratives can trigger instant momentum.
Lower Liquidity in Altcoins – Small capital inflows can cause explosive price action.
These characteristics make momentum trading especially attractive—but also risky.
Major Momentum Patterns in Cryptocurrency Markets
1. Breakout Momentum Pattern
Breakouts occur when price moves beyond a well-defined resistance or support zone with increased volume.
Crypto-specific traits:
Breakouts often happen during low-liquidity periods.
Fake breakouts are common due to stop-hunting.
Volume confirmation is crucial.
Strong breakout signals include:
Expansion in volume
Large candle bodies
Open Interest increasing with price
Breakout momentum works best in high-liquidity coins like Bitcoin, Ethereum, and top-tier altcoins.
2. Trend Continuation Momentum
Once a trend is established, crypto markets often show extended continuation phases.
Common continuation patterns include:
Bull flags
Bear flags
Ascending or descending channels
Consolidation above key moving averages
In strong bull markets, cryptocurrencies can remain overbought for extended periods, making traditional indicators less effective. Traders who wait for “cheap” prices often miss the move entirely.
3. Parabolic Momentum Pattern
Parabolic moves are unique to crypto markets and occur when buying pressure becomes exponential.
Characteristics:
Steep price angle
Increasing candle size
RSI staying above 70 for long periods
Media and social hype at extremes
While parabolic momentum can produce massive gains, it is unsustainable. The end often comes with a sharp vertical drop, trapping late buyers.
4. Momentum Divergence Pattern
Divergences occur when price continues to make higher highs or lower lows while momentum indicators fail to confirm.
Common divergence types:
Bearish divergence (price up, momentum down)
Bullish divergence (price down, momentum up)
In crypto, divergences are early warnings, not immediate reversal signals. Strong trends can ignore divergences for extended periods, especially in Bitcoin during macro-driven cycles.
5. Mean Reversion Momentum Exhaustion
Crypto markets frequently experience momentum exhaustion, where price moves too far too fast.
Signs include:
Long wick candles
Declining volume at highs
Extreme funding rates
Overcrowded long or short positions
This often leads to sharp pullbacks or sideways consolidation rather than immediate trend reversal.
Momentum Indicators Commonly Used in Crypto Trading
Relative Strength Index (RSI)
RSI measures momentum strength but behaves differently in crypto:
RSI above 70 can persist for weeks
RSI below 30 often leads to short-term bounces
RSI mid-range (40–60) signals consolidation
Moving Averages
Momentum traders watch:
20 EMA for short-term momentum
50 EMA for trend confirmation
200 EMA for macro bias
Strong momentum often keeps price above key EMAs with shallow pullbacks.
MACD
MACD works best on higher time frames in crypto. Frequent false signals appear on lower time frames due to volatility.
Volume and Open Interest
True momentum requires participation:
Rising price + rising volume = healthy momentum
Rising price + falling volume = weak momentum
Rising Open Interest confirms leveraged participation
Role of Derivatives in Crypto Momentum
Futures and options markets significantly influence momentum patterns.
Key elements:
Funding rates reflect crowd bias
Liquidations accelerate momentum
Stop-loss cascades amplify moves
Large liquidation events often create forced momentum, leading to exaggerated candles known as “liquidation wicks.”
Momentum Across Market Cycles
Bull Market Momentum
Strong continuation patterns
Shallow pullbacks
Altcoins outperform Bitcoin
Narratives dominate fundamentals
Bear Market Momentum
Sharp relief rallies
Lower highs and lower lows
Momentum fades quickly
Volume dries up
Understanding the broader cycle is critical because the same momentum signal behaves differently depending on market conditions.
Risks of Momentum Trading in Crypto
Momentum trading is not without danger.
Major risks include:
Fake breakouts
Sudden reversals from whale activity
News-driven volatility
High leverage liquidation
Risk management is essential. Stop-loss placement, position sizing, and avoiding emotional entries are more important than indicator selection.
Best Practices for Trading Momentum in Crypto
Trade in the direction of the higher-time-frame trend
Use volume and Open Interest confirmation
Avoid chasing late-stage parabolic moves
Combine price action with momentum indicators
Respect volatility—reduce leverage during high uncertainty
Successful momentum traders focus not on predicting tops or bottoms but on participating in the middle of the move.
Conclusion
Momentum patterns in cryptocurrency markets are powerful, fast-moving, and emotionally charged. They arise from a unique blend of retail behavior, leverage, narrative influence, and structural market features. While momentum can generate outsized profits, it demands discipline, adaptability, and strong risk management.
By understanding breakout momentum, trend continuation, parabolic phases, divergence signals, and exhaustion patterns, traders can better navigate crypto’s volatile landscape. In a market where prices can double or halve in days, mastering momentum is not optional—it is essential.

Financial Freedom Through Euro–Dollar DynamicsThe Euro–Dollar Relationship: A Global Financial Barometer
The EUR/USD pair represents the exchange rate between the euro (used by the Eurozone) and the U.S. dollar (the world’s primary reserve currency). Together, these two economies account for a significant share of global GDP, trade, and investment flows. As a result, EUR/USD reflects more than currency strength—it mirrors global economic confidence, monetary policy divergence, and geopolitical stability.
When the U.S. economy outperforms Europe, capital flows toward dollar-denominated assets, strengthening the USD and pushing EUR/USD lower. Conversely, when the Eurozone shows resilience or the Federal Reserve adopts a dovish stance, the euro strengthens. For individuals seeking financial freedom, understanding these shifts helps identify where money is moving—and how to position alongside it.
Interest Rates: The Core Driver of Currency Wealth
At the heart of Euro–Dollar dynamics lie interest rates, set by the European Central Bank (ECB) and the U.S. Federal Reserve (Fed). Interest rate differentials determine where global investors park their money.
Higher U.S. rates attract capital into U.S. bonds and equities, strengthening the dollar.
Higher European rates improve euro demand and reduce dollar dominance.
For traders, this creates long-term trends that can last months or even years. Riding these trends—rather than chasing short-term noise—can generate consistent returns. For investors, understanding rate cycles helps in allocating capital between U.S. stocks, European equities, bonds, and currency-hedged instruments.
Financial freedom is rarely built through random trades; it is built by aligning with long-duration macro trends, and interest rate policy is one of the most reliable trend drivers.
Inflation, Purchasing Power, and Real Wealth
Inflation erodes purchasing power, silently damaging long-term financial security. The Euro–Dollar dynamic reflects how well each region controls inflation relative to growth.
If U.S. inflation is high and the Fed lags in response, the dollar may weaken.
If Europe faces energy-driven inflation shocks, the euro may depreciate.
For individuals, this matters because currency value affects real wealth. Income earned in a weakening currency loses global purchasing power, while assets held in a stronger currency preserve or enhance wealth.
Many financially independent individuals diversify income streams across currencies—earning in one currency while investing in another. Understanding EUR/USD trends helps protect savings from inflation and currency depreciation, a crucial but often overlooked step toward financial freedom.
Trading EUR/USD as a Tool for Income Independence
The Euro–Dollar pair is the most liquid currency pair in the world. High liquidity means tighter spreads, lower transaction costs, and smoother price action—ideal conditions for traders aiming to build consistent income streams.
From a financial freedom perspective:
Day traders benefit from predictable volatility during London–New York overlap.
Swing traders exploit macro themes like rate hikes, inflation data, and policy guidance.
Position traders ride multi-month trends driven by monetary cycles.
Unlike equities, forex markets operate nearly 24 hours a day, allowing flexibility for those balancing trading with jobs or businesses. While trading carries risk, disciplined EUR/USD trading—supported by macro understanding—can evolve into a scalable income source, supporting location-independent lifestyles.
Euro–Dollar Dynamics and Global Asset Allocation
Financial freedom is not only about earning more—it’s about allocating capital wisely. EUR/USD movements influence global asset performance:
A strong dollar often pressures emerging markets and commodities.
A weak dollar supports risk assets, global equities, and alternative investments.
Euro strength benefits European exporters and regional stock indices.
By tracking Euro–Dollar trends, investors can adjust portfolios proactively—reducing drawdowns and enhancing long-term returns. This macro-aware allocation reduces reliance on any single market or economy, making wealth more resilient.
Psychological Freedom Through Macro Understanding
One underrated aspect of financial freedom is psychological stability. Many retail investors panic during volatility because they lack context. Understanding Euro–Dollar dynamics provides that context.
When markets move sharply after central bank meetings, inflation reports, or geopolitical events, informed individuals recognize these moves as part of larger cycles—not random chaos. This clarity reduces emotional decision-making, improves discipline, and builds confidence—key traits of financially independent thinkers.
Business, Remittances, and Cross-Border Opportunities
For entrepreneurs, freelancers, and international workers, EUR/USD impacts:
Export and import costs
Overseas earnings
Profit margins on global contracts
Those who understand currency dynamics can time conversions, hedge exposure, or price services strategically. Over time, these small optimizations compound into significant financial advantages—another pathway to independence beyond traditional employment.
Risks and Responsible Use of Currency Dynamics
While Euro–Dollar dynamics offer opportunities, financial freedom requires risk awareness. Leverage misuse, overtrading, and ignoring macro shifts can quickly destroy capital. True freedom comes from risk-adjusted growth, not reckless speculation.
Successful participants treat EUR/USD as a strategic tool—not a gamble—combining technical analysis, macro data, and strict risk management.
Conclusion: Aligning With Global Money Flow
Financial freedom in the modern world is no longer confined to saving salaries or investing locally. It is about understanding how global money moves—and positioning oneself accordingly. The Euro–Dollar dynamic stands at the center of this global system, reflecting interest rates, inflation, economic confidence, and political stability.
By mastering EUR/USD dynamics, individuals gain more than trading profits or investment returns. They gain insight, flexibility, and control over their financial destiny. Whether through trading, investing, currency diversification, or global business, aligning with Euro–Dollar trends can transform money from a source of stress into a tool for long-term independence.
In essence, financial freedom is not about predicting every market move—it is about understanding the forces that shape them. And few forces are as powerful, persistent, and revealing as the Euro–Dollar relationship.

Inter-Market Edge: Mastering Cross-Asset TradesWhat Is Inter-Market Analysis?
Inter-market analysis studies the relationships between major asset classes, primarily:
Equities (stocks and indices)
Bonds (interest rates and yields)
Commodities (energy, metals, agriculture)
Currencies (forex pairs)
Volatility instruments (like VIX)
The core idea is simple: capital constantly rotates between asset classes based on economic conditions, monetary policy, inflation expectations, and risk sentiment. By tracking where money is flowing before it fully shows up in your trading instrument, you gain early insight.
Why Cross-Asset Trading Matters
Single-asset traders often react late. Cross-asset traders anticipate.
Key benefits include:
Early trend detection
Bond yields or currencies often move before equities.
Signal confirmation
A stock market breakout supported by falling bond yields and a weak currency is more reliable.
False signal filtering
If equities rise but bonds and commodities disagree, caution is warranted.
Superior risk management
Inter-market divergence frequently warns of trend exhaustion or reversals.
Broader opportunity set
When one market is range-bound, another may be trending strongly.
Core Inter-Market Relationships
To master cross-asset trades, traders must understand some foundational relationships.
1. Stocks and Bonds: The Risk Barometer
Rising bond prices (falling yields) usually indicate risk aversion.
Falling bond prices (rising yields) often signal economic optimism or inflation concerns.
Classic relationship
Stocks ↑ → Bonds ↓ (risk-on)
Stocks ↓ → Bonds ↑ (risk-off)
Trading edge
If bond yields start rising before equities rally, it often signals an upcoming stock market breakout. Conversely, falling yields during a stock rally can warn of weakness ahead.
2. Interest Rates and Equities
Central bank policy sits at the heart of inter-market analysis.
Low or falling rates support equity valuations and growth stocks.
Rising rates pressure high-valuation stocks, especially technology and small caps.
Cross-asset insight
Rate-sensitive sectors (banking, real estate, utilities) often move before broader indices. Watching rate futures can provide early sector rotation signals.
3. Currencies and Risk Sentiment
Currencies are not just exchange tools; they are risk indicators.
Safe-haven currencies: USD, JPY, CHF
Risk currencies: AUD, NZD, emerging market currencies
Key dynamics
Strong USD often pressures commodities and emerging market equities.
Weak domestic currency can boost exporters but increase inflation risk.
Trading edge
A strengthening USD alongside falling equities often confirms a risk-off environment. Conversely, a weakening USD with rising commodities supports a global risk-on trade.
4. Commodities and Inflation Expectations
Commodities reflect real-world demand and inflation trends.
Crude oil influences inflation, transport, and emerging markets.
Gold reflects real yields, inflation fears, and currency confidence.
Industrial metals signal economic growth.
Inter-market signal
Rising commodities with rising bond yields often indicate inflationary pressure, which can eventually hurt equity valuations.
5. Gold, Dollar, and Real Yields
Gold deserves special attention in cross-asset trading.
Gold rises when real yields fall.
Gold weakens when real yields rise, even if inflation is high.
Edge for traders
If gold rallies while equities rise and the dollar weakens, it often signals excess liquidity. If gold rises while equities fall, it reflects fear and capital preservation.
Volatility as a Cross-Asset Tool
Volatility indices, especially equity volatility, act as early warning systems.
Rising volatility during a price rally signals distribution.
Falling volatility during consolidation supports trend continuation.
Cross-asset traders watch volatility alongside bonds and currencies to judge whether risk appetite is genuine or fragile.
Practical Cross-Asset Trading Strategies
1. Confirmation Strategy
Before entering a trade, ask:
Do bonds agree?
Does the currency support the move?
Are commodities aligned with the macro narrative?
Example:
A stock index breakout supported by falling volatility and stable bond yields has higher probability.
2. Lead-Lag Strategy
Some markets move earlier than others:
Bonds often lead equities.
Currencies often lead commodities.
Commodities often lead inflation data.
Traders can position early in the lagging market once the leading market signals a shift.
3. Relative Strength Across Assets
Instead of predicting direction, compare strength between asset classes:
Equities vs bonds
Growth stocks vs value stocks
Commodities vs currencies
This helps identify capital rotation rather than guessing tops and bottoms.
4. Risk-On / Risk-Off Framework
Create a simple checklist:
Stocks ↑, yields ↑, volatility ↓ → Risk-on
Stocks ↓, yields ↓, volatility ↑ → Risk-off
Trading in alignment with the prevailing regime dramatically improves consistency.
Common Mistakes in Inter-Market Trading
Over-correlation bias: Relationships change over time.
Ignoring timeframes: Short-term trades may not follow long-term inter-market trends.
Confirmation paralysis: Waiting for every asset to align can lead to missed trades.
Macro blindness: News, policy, and global events matter in cross-asset trading.
Building the Inter-Market Mindset
Mastering cross-asset trades is less about predicting prices and more about understanding flows. Successful inter-market traders think like capital allocators, not just chart readers. They ask:
Where is money coming from?
Where is it going?
What fear or optimism is driving that movement?
By integrating equities, bonds, currencies, commodities, and volatility into one analytical framework, traders gain clarity in noisy markets.
Conclusion
The inter-market edge transforms trading from isolated decision-making into strategic positioning. In a world driven by global liquidity, central banks, inflation cycles, and geopolitical shifts, cross-asset awareness is no longer optional—it is essential.
Traders who master inter-market analysis don’t just react to price; they anticipate behavior, align with capital flows, and trade with context. That context is the real edge—quiet, powerful, and consistently profitable when applied with discipline.
If you want, I can also break this into headings for a blog, PDF notes, or turn it into a trading framework with examples from Indian markets 📈

The Commodity Super Cycle: Gold & Crude Oil in Focus1. Understanding the Commodity Super Cycle
A commodity super cycle refers to a long-term (10–30 years) period of rising commodity prices, driven by structural changes in the global economy rather than short-term speculation. Unlike normal commodity cycles, super cycles are fueled by massive demand shifts, supply constraints, geopolitical realignments, and monetary policy trends.
Historically, super cycles have emerged during periods of industrialization, reconstruction, or major technological change—such as post-World War II rebuilding or China’s rapid growth in the early 2000s. Today, the world appears to be entering a new super cycle, shaped by energy transition, geopolitical fragmentation, inflationary pressures, and rising global debt. In this environment, Gold and Crude Oil stand at the center of the narrative.
2. Why Gold and Crude Oil Matter in a Super Cycle
Gold and crude oil are not just commodities; they are macro indicators.
Gold reflects monetary stability, inflation expectations, currency confidence, and geopolitical risk.
Crude Oil reflects economic growth, energy security, industrial activity, and geopolitical power.
Together, they act as barometers of global stress and expansion. When both trend higher over a sustained period, it often signals deep structural shifts in the global economy.
3. Gold: The Monetary Anchor of the Super Cycle
Gold has always played a unique role as a store of value and hedge against uncertainty. In the current cycle, gold’s importance has increased due to several converging factors.
a) Inflation and Monetary Expansion
Following years of aggressive money printing by central banks, global economies are grappling with persistent inflation. Even when inflation moderates, real interest rates often remain negative, which historically supports higher gold prices. Investors turn to gold to preserve purchasing power when fiat currencies weaken.
b) Central Bank Accumulation
One of the strongest structural drivers for gold is record central bank buying, especially by emerging economies like China, India, Russia, and Middle Eastern nations. These countries are actively diversifying away from the US dollar, increasing gold reserves as a neutral, non-sanctionable asset.
c) Geopolitical Risk and De-Dollarization
Rising geopolitical tensions, sanctions, trade wars, and regional conflicts have reinforced gold’s role as a safe-haven asset. In a fragmented world economy, gold acts as financial insurance, increasing its long-term demand.
d) Supply Constraints
Gold mining faces challenges such as declining ore grades, rising extraction costs, environmental regulations, and limited new discoveries. This supply rigidity, combined with rising demand, strengthens gold’s super-cycle potential.
4. Crude Oil: The Energy Engine of the Super Cycle
Crude oil remains the lifeblood of the global economy, despite the push toward renewable energy. In a super cycle, oil prices are shaped by structural supply-demand imbalances rather than short-term shocks.
a) Chronic Underinvestment in Supply
Over the past decade, oil companies have reduced capital expenditure due to ESG pressures, price volatility, and energy transition narratives. This has led to insufficient investment in exploration and production, making supply less responsive to rising demand.
b) Geopolitical Supply Risks
Oil supply is highly sensitive to geopolitics. Sanctions on major producers, conflicts in the Middle East, OPEC+ production controls, and strategic reserve policies all contribute to structural tightness in oil markets.
c) Resilient Global Demand
Despite electric vehicle adoption and renewable energy growth, oil demand continues to rise, especially in emerging markets. Transportation, aviation, petrochemicals, and industrial sectors still depend heavily on crude oil, making demand more inelastic than often assumed.
d) Inflation Feedback Loop
Rising oil prices feed directly into transportation costs, manufacturing, and food prices, reinforcing inflation. This creates a self-sustaining cycle where higher energy prices support the broader commodity complex.
5. Gold vs Crude Oil: Correlation and Divergence
While both benefit from a super cycle, gold and crude oil behave differently:
Gold thrives during economic uncertainty, currency weakness, and falling real yields.
Crude oil thrives during economic expansion, supply disruptions, and inflationary growth.
Periods when both rise together typically signal stagflationary conditions—slow growth with high inflation. Such environments are particularly challenging for traditional equity and bond portfolios, increasing the appeal of commodities.
6. Investment and Trading Implications
The commodity super cycle reshapes portfolio construction and trading strategies.
a) Portfolio Hedging
Gold acts as a hedge against inflation, currency depreciation, and systemic risk, while oil provides exposure to global growth and energy scarcity. Together, they enhance portfolio resilience.
b) Equity Market Impact
Rising gold prices support mining stocks, while higher crude oil prices benefit energy producers, refiners, and oil-service companies. However, energy-intensive industries may face margin pressure.
c) Trading Volatility
Both commodities offer high volatility, making them attractive for futures, options, and swing trading. Super cycles often feature sharp corrections within a long-term uptrend, rewarding disciplined traders.
7. Risks to the Super Cycle Thesis
No super cycle is without risks. Key threats include:
A sharp global recession reducing demand
Rapid technological breakthroughs reducing oil dependency
Aggressive monetary tightening strengthening the US dollar
Policy interventions such as price caps or windfall taxes
However, these factors often cause temporary pullbacks rather than structural trend reversals.
8. The Road Ahead
The current global landscape—marked by inflationary pressures, geopolitical realignment, energy insecurity, and rising debt—creates fertile ground for a commodity super cycle. Gold and crude oil stand at the core of this transformation.
Gold represents trust, stability, and monetary insurance, while crude oil represents power, growth, and energy dominance. Together, they reflect a world transitioning from decades of deflationary stability to a more volatile, inflation-prone regime.
Conclusion
The commodity super cycle is not just about price appreciation; it is about structural change in how the global economy functions. Gold and crude oil are the twin pillars of this shift—one anchoring monetary confidence, the other driving industrial momentum. For investors and traders who understand their dynamics, this cycle offers long-term opportunity alongside short-term volatility.
In a world of uncertainty, commodities are no longer optional—they are essential.

Part 1 Ride The Big Moves Option Buyer vs Option Seller
Buyer pays premium, limited risk, unlimited profit.
Seller collects premium, limited profit, unlimited risk.
In real market volume, 80–90% of time sellers (institutions) dominate.
Expiry
Every option has a deadline (weekly, monthly).
On expiry day, option either:
ITM: Has value.
OTM: Becomes zero.

AI-Driven Economy: Transforming Global GrowthUnderstanding the AI-Driven Economy
An AI-driven economy refers to an economic system in which artificial intelligence technologies play a central role in production, decision-making, innovation, and value creation. These technologies include machine learning, natural language processing, computer vision, robotics, and generative AI. Unlike earlier technological revolutions that focused mainly on mechanization or digitization, AI enables machines to learn, adapt, and perform cognitive tasks traditionally reserved for humans.
This shift allows businesses and governments to process massive volumes of data, predict outcomes with greater accuracy, automate complex workflows, and create new products and services. As a result, AI is becoming a general-purpose technology, similar to electricity or the internet, with widespread economic implications.
Boosting Productivity and Efficiency
One of the most significant contributions of AI to global growth is its impact on productivity. AI systems can operate continuously, analyze data at scale, and optimize processes in real time. In manufacturing, AI-powered robotics improve precision, reduce defects, and minimize downtime. In logistics, AI optimizes supply chains by forecasting demand, managing inventory, and routing shipments efficiently.
Service industries also benefit greatly. Financial institutions use AI for fraud detection, risk assessment, and algorithmic trading. Healthcare providers leverage AI for diagnostics, personalized treatment plans, and drug discovery. These improvements reduce costs, enhance output, and allow human workers to focus on higher-value tasks, leading to sustained productivity growth across sectors.
Reshaping Labor Markets
The AI-driven economy is transforming labor markets in complex and often controversial ways. On one hand, AI automates repetitive and routine tasks, raising concerns about job displacement in sectors such as manufacturing, customer service, and data processing. On the other hand, AI creates new roles and opportunities in fields like data science, AI engineering, cybersecurity, and digital ethics.
More importantly, AI changes the nature of work itself. Demand is rising for skills such as problem-solving, creativity, emotional intelligence, and interdisciplinary thinking—capabilities that complement AI rather than compete with it. Countries and organizations that invest in reskilling and upskilling their workforce are better positioned to harness AI’s economic benefits while minimizing social disruption.
Driving Innovation and New Business Models
AI is a powerful catalyst for innovation. By enabling faster research, smarter experimentation, and deeper insights, AI shortens innovation cycles and lowers barriers to entry. Startups can use AI-as-a-service platforms to build advanced solutions without massive upfront investment, fostering entrepreneurship and competition.
New business models are emerging as well. Personalized digital services, subscription-based AI tools, autonomous platforms, and data-driven ecosystems are redefining how value is created and delivered. Generative AI, in particular, is transforming creative industries by enabling rapid content generation, design automation, and customized user experiences. These innovations expand markets and contribute to global economic dynamism.
Impact on Global Trade and Competitiveness
AI is reshaping global trade patterns and competitive dynamics. Countries that lead in AI research, data infrastructure, and talent development gain a significant strategic advantage. The United States, China, and parts of Europe are heavily investing in AI to strengthen their economic and geopolitical positions.
At the same time, AI enables companies to localize production through smart automation, reducing dependence on long global supply chains. This trend, sometimes called “re-shoring” or “near-shoring,” can alter traditional trade flows. However, AI also enhances cross-border digital trade by enabling seamless global services, remote work, and digital platforms that operate beyond physical boundaries.
Transforming Emerging and Developing Economies
For emerging and developing economies, the AI-driven economy presents both opportunities and challenges. AI can accelerate development by improving agricultural productivity, expanding access to healthcare and education, enhancing financial inclusion, and supporting smart infrastructure. For example, AI-powered mobile applications help farmers optimize crop yields, while AI-based credit scoring expands access to loans for underserved populations.
However, limited digital infrastructure, data availability, and skilled talent can widen the gap between AI-advanced and AI-lagging nations. Without strategic investment and international cooperation, the AI revolution risks exacerbating global inequality. Inclusive AI policies, technology transfer, and global partnerships are essential to ensure shared growth.
Ethical, Regulatory, and Governance Challenges
As AI becomes central to economic growth, ethical and regulatory considerations grow increasingly important. Issues such as data privacy, algorithmic bias, transparency, and accountability directly affect trust in AI systems. Poorly governed AI can lead to discrimination, misinformation, and economic instability.
Governments play a crucial role in shaping the AI-driven economy through regulation, public investment, and policy frameworks. Balanced regulation is essential—strong enough to protect consumers and workers, yet flexible enough to encourage innovation. International coordination is also necessary, as AI technologies and data flows often transcend national borders.
Long-Term Economic Growth and Sustainability
In the long run, AI has the potential to redefine economic growth itself. By enabling smarter resource management, AI supports sustainability goals such as energy efficiency, climate modeling, and environmental protection. AI-driven optimization can reduce waste, lower emissions, and improve resilience to climate risks.
Moreover, AI can help address structural challenges facing global economies, including aging populations and slowing productivity growth. By augmenting human capabilities and enabling new forms of value creation, AI offers a pathway to more resilient, adaptive, and sustainable economic systems.
Conclusion
The AI-driven economy is not a distant future—it is an unfolding reality that is already transforming global growth. From boosting productivity and innovation to reshaping labor markets and global trade, AI is redefining how economies function and compete. While challenges related to inequality, ethics, and regulation remain significant, the potential benefits of AI are immense.
Nations, businesses, and individuals that proactively invest in AI capabilities, human capital, and responsible governance will be best positioned to thrive in this new economic era. Ultimately, the AI-driven economy represents not just a technological shift, but a fundamental reimagining of global growth in the 21st century.

NTPC 1 Day Time Frame 📌 Current Price (approx): ₹367–₹368 on NSE (today’s trading)
📊 Daily Pivot Levels (Key Reference Area)
These are calculated from recent price action & help identify where price may stall or bounce:
Central Pivot / CPR: ~₹364–₹365 (major reference)
Resistance (Upside Levels):
R1: ~₹371
R2: ~₹375
R3: ~₹382+
Support (Downside Levels):
S1: ~₹360
S2: ~₹353
S3: ~₹349
(Standard pivot model)
Daily EMA/SMA key zones:
20-day EMA ~₹347
50-day SMA ~₹339
100/200 day ~₹336-338
(These averages act as dynamic support/resistance)
🚀 Price Action Levels
📌 Immediate Resistance
First upside test: ₹370–₹372
Secondary upside: ₹375–₹378
Breakout zone: above ₹380 (short-term bullish continuation)
📉 Immediate Support
First support: ₹360–₹362
Next support: ₹353–₹355
Deeper support: ₹348–₹350
If price holds above pivot (~364–365) → short-term bullish bias. If it breaks below S1 (~360) → watch S2/S3 zones for stronger supports.
📈 Trend Context (Daily)
✔ Current price is trading above key medium-term moving averages (20/50/100/200 day), signalling bullish trend on daily charts.
✔ RSI levels and momentum indicators generally are neutral to slightly bullish — suggesting strength near current price zone but watch for overbought conditions.
How to use these levels
🔹 Bullish view (long positions):
– Entry if price breaks and holds above R1 (~₹371)
– Targets near R2 (~₹375) and R3 (~₹382+)
– Stop-loss below pivot (~₹364)
🔹 Bearish view (short positions or pullback):
– Look for rejection near R1/R2
– First target near S1 (~₹360)
– Deeper bearish target near S2 (~₹353)

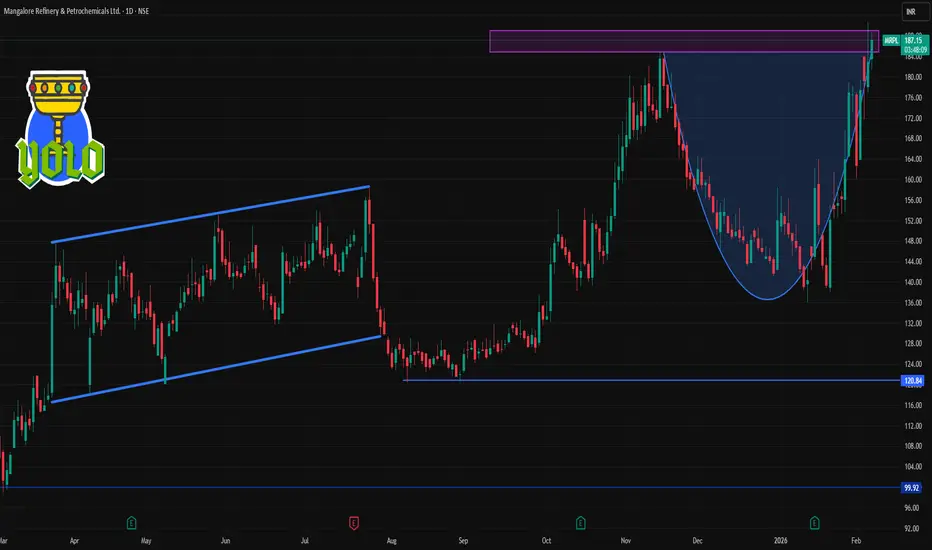
MRPL 1 Day Time Frame 📊 Latest Price Context (daily):
• The stock has recently been trading around ₹184–188 on NSE/BSE on the current session.
⭐ Daily Pivot Levels (Classic / Standard)
(used by many traders for intraday bias)
Level ₹ Price
R3 (Upper resistance) ~197.27
R2 ~190.63
R1 (Immediate resistance) ~184.97
Pivot Point (PP) ~178.33
S1 (Immediate support) ~172.67
S2 ~166.03
S3 ~160.37
👉 Interpretation:
Above Pivot (178–180) → bullish bias intraday.
Below Pivot → bearish / correction bias.
Resistance clusters near 185–191, with strong upper resistance around 197.
Immediate supports around 173 and 166 zones.
🔁 Alternate Daily Levels (Trendlyne)
(corroborated by another pivot source)
R1: ~₹185
R2: ~₹191
S1: ~₹172
S2: ~₹171 / ~₹168 (minor)
👉 Very similar structure: range ~172–185 for the day, with next larger moves beyond these points.
📌 Short Summary for 1-Day Trading Bias
Bullish if:
MRPL holds above daily pivot ~178–180
Break / close above ~185 could trigger further upside toward ~190–197
Bearish if:
Break below ~172 support
Next support zones: ~166 → ~160 area
Part 2 Technical Analysis VS. Institutional Option TradingStrike Price
The fixed price at which you can buy/sell.
Example: Nifty 22,000 CE = option to buy Nifty at 22,000.
Premium
The price of the option contract.
Paid by the buyer, received by the seller (writer).

DAILY FOREX SCAN Session – 25 05 02 26Scanning multiple forex pairs to filter high-quality trade setups. No trades are forced—only structure-based opportunities.
Note: There may be a delay in this video due to upload processing time.
Disclaimer: FX trading involves high leverage and substantial risk, and losses can exceed your initial investment. This content is for educational purposes only and should not be considered financial advice. Trade at your own risk.

Part 1 Technical Analysis VS. Institutional Option Trading What Are Options?
Options are contracts that give you the right but not the obligation to buy or sell an asset at a fixed price before a certain date.
They are derivative instruments — their value comes from the underlying asset (index, stock, commodity, currency).
Options are mostly used for hedging, speculation, and income generation.
Two Types of Options
Call Option (CE): Right to buy at a chosen price.
Put Option (PE): Right to sell at a chosen price.

GMDC 1 Day Time Frame from NSE data:
📊 Daily Pivot & Key Levels (1D Timeframe)
📌 Daily Pivot Point (PP): ₹606.73 – This is the central bias level. Above this suggests short-term bullish control; below may signal weakness.
💥 Resistance Levels (Upside)
R1: ₹627.46 – first major resistance above the pivot
R2: ₹640.38 – medium-term barrier
R3: ₹661.11 – stronger supply zone / higher target
🛡️ Support Levels (Downside)
S1: ₹593.81 – immediate daily support
S2: ₹573.08 – deeper pullback level
S3: ₹560.16 – stronger lower support area
✔ How to use these levels (Daily view):
📈 Bullish conditions:
If price sustains above Pivot (₹606.73) → bias turns bullish
Stronger breakout confirmation if price closes above R1/R2 with volume
📉 Bearish conditions:
If price breaks below S1 (₹593.81) → watch for next supports (S2/S3)
Failure at resistance zones can lead to pullbacks
💡 Summary Daily Chart Levels (1D)
Level Price (Approx)
R3 661
R2 640
R1 627
Pivot 606
S1 594
S2 573
S3 560
(Levels rounded for clarity)

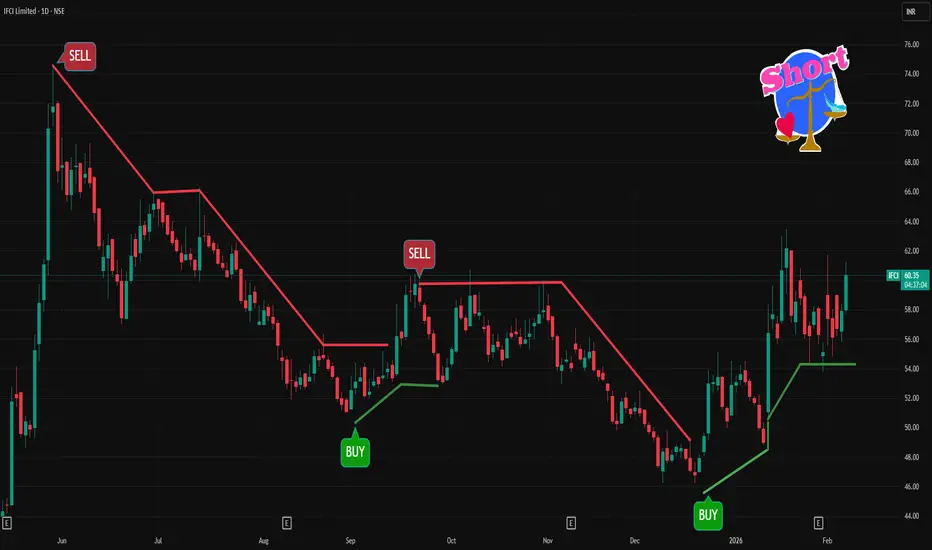
IFCI 1 Day Time Frame 📊 Current Live Price (Approx)
• IFCI trading around ₹57-₹60 range today on NSE/BSE (price fluctuates intraday).
✅ 1-Day Pivot & Key Levels
These are calculated based on recent price action and used by traders for intraday/short-term decisions:
Daily Pivot (PP): ~ ₹56.33 – ₹56.93
Resistance Levels:
R1: ~ ₹57.86 – ₹58.45
R2: ~ ₹59.06 – ₹60.14
R3: ~ ₹60.98 – ₹61.55
Support Levels:
S1: ~ ₹54.61 – ₹55.80
S2: ~ ₹53.08 – ₹53.68
S3: ~ ₹49.83 – ₹49.83 (deeper support)
📌 Ranges vary slightly by pivot calculation method (Classic, Fibonacci, Camarilla), but the zones above reflect current intraday technical consensus.
📌 How Traders Use These Levels (Daily View)
Bullish view:
• A sustained break above R1/R2 (~₹58-₹60) suggests strength and possible move toward R3 (~₹61+).
• Above pivot (~₹56-₹57) indicates bullish bias for the day.
Bearish view:
• A break below S1 (~₹54.6-₹55) can lead toward S2 (~₹53) and lower support.
• Below pivot signals downside pressure first.
🧠 Important Notes
• These levels are intraday technical references, not fundamental buy/sell calls.
• Markets and prices change minute-to-minute — use live quotes from your broker or trading platform.
• Combine pivot zones with volume, candlestick patterns, and trend indicators for better signals.
$WLFI CRASH ALERT: TRUMP's Crypto - Dump to $0.07 or Pump to ATH⚠️ $WLFI CRASH ALERT: TRUMP's Crypto at Critical Zone - Dump to $0.07 or Pump to ATH?
World Liberty Financial ($WLFI), President Donald Trump's Crypto Project Continues Trading in a Clear Bearish Structure on the Daily TF. $WLFI Now Down 78% from ATH $0.4780, Now Trading at $0.1306.
Bullish Scenario:
If Price Holds $0.113 – $0.125 Support, Expect A Relief Bounce Toward $0.18 – $0.20 (+40%) Resistance (Still Within Bearish Channel).
Breakout Confirmation:
Break Above $0.20 With High Volume + HTF Candle Close → Opens Path Toward NEW ATH Targets Around $1.00
Bearish Scenario:
Breakdown Below $0.113 Support → Expect Another 40% Drop From Breakdown Level.
Downside Target: $0.07
Risk Warning:
Never Trade Blindly. Always Trade With Confirmations And Strict Stop Loss.
Educational Purpose Only – Not Financial Advice

DAILY FOREX SCAN Session – 24 04 02 26Scanning multiple forex pairs to filter high-quality trade setups. No trades are forced—only structure-based opportunities.
Note: There may be a delay in this video due to upload processing time.
Disclaimer: FX trading involves high leverage and substantial risk, and losses can exceed your initial investment. This content is for educational purposes only and should not be considered financial advice. Trade at your own risk.

NIFTY- Intraday Levels - 5th Feb 2026If NIFTY sustain above 25776 then above this bullish then 25990/26011/18/28 then 26053/70/80/92 above this more bullish then around 26300 then 26359/75 or 26431/51/59 this is make or brake range if comes to this level above this wait
If NIFTY sustain below 25656 below this bearish it has potential to drop to 24984 intermediate levels are marked on chart
Consider some buffer points in above levels.
My view :-
Even though day closing seems good, speculating on Nifty’s immediate movement is particularly challenging right now due to the high-stakes trade negotiations. While the news of reduced tariffs (cut to 18%) has already triggered a massive relief rally, the market remains hypersensitive. Positive confirmation of further favorable terms could propel us to positive movement tomorrow , but any friction or 'hidden clauses' that aren't in India's favor could lead to a sharp negative reversal .
Furthermore, Friday’s session looks prone to a ' Sell-on-Rise ' setup. Historically, big institutional players are reluctant to carry heavy long positions into the weekend when major news is still fluid. To avoid the risk of a "weekend surprise" or a gap-down opening on Monday, we may see profit-booking and a lack of aggressive buying at higher levels. Traders should exercise extreme caution and avoid chasing new highs until the volatility from this news cycle fully settles
Please do your due diligence before trading or investment.
**Disclaimer -
I am not a SEBI registered analyst or advisor. I does not represent or endorse the accuracy or reliability of any information, conversation, or content. Stock trading is inherently risky and the users agree to assume complete and full responsibility for the outcomes of all trading decisions that they make, including but not limited to loss of capital. None of these communications should be construed as an offer to buy or sell securities, nor advice to do so. The users understands and acknowledges that there is a very high risk involved in trading securities. By using this information, the user agrees that use of this information is entirely at their own risk.
Thank you.

Oil India – SMC-Based Trading Outlook (Daily)According to the Smart Money Concepts (SMC) framework, Oil India has delivered a clear bullish Break of Structure (BOS) above ₹494.05, which earlier acted as a strong supply zone. The decisive close above this level confirms that demand has absorbed supply, shifting market control to buyers.
With the BOS confirmed, price has expanded sharply towards the ₹508–₹510 zone, validating bullish intent
Bullish Continuation Scenario (Primary)
BOS Level: ₹494.05 (now flipped into support)
Immediate Upside Target: ₹579
Extended Swing Target: ₹740 (as marked on the chart)
After the impulsive move, a healthy pullback towards the 50% retracement zone (₹495–₹500) would be considered structurally bullish and may offer a high-probability re-entry opportunity for trend continuation.
Alternate Bullish Setup (Support-Based)
If price retraces deeper, the demand zone near ₹448.25 remains a strong institutional support area.
A bullish reversal signal or momentum confirmation from this zone can present a secondary buying opportunity with favorable risk–reward.
Bearish / Risk Scenario
-Failure to hold above ₹448.25 would weaken the bullish structure.
In such a case:
-Breakdown below ₹448.25 → opens downside risk towards ₹420
-This would shift the bias to bearish-to-sideways, with ₹420 acting as a critical decision zone (breakdown vs reversal).
Bullish
-BOS above ₹494.05 → Target ₹579
-Swing extension → ₹740
-Re-entry zone → ₹495–₹500
-Alternate buy → ₹448.25 (on bullish confirmation)
Bearish
-Breakdown below ₹448.25 → ₹420
-Below ₹420 → structure turns weak/sideways
Disclaimer: aliceblueonline.com/legal-documentation/disclaimer/
