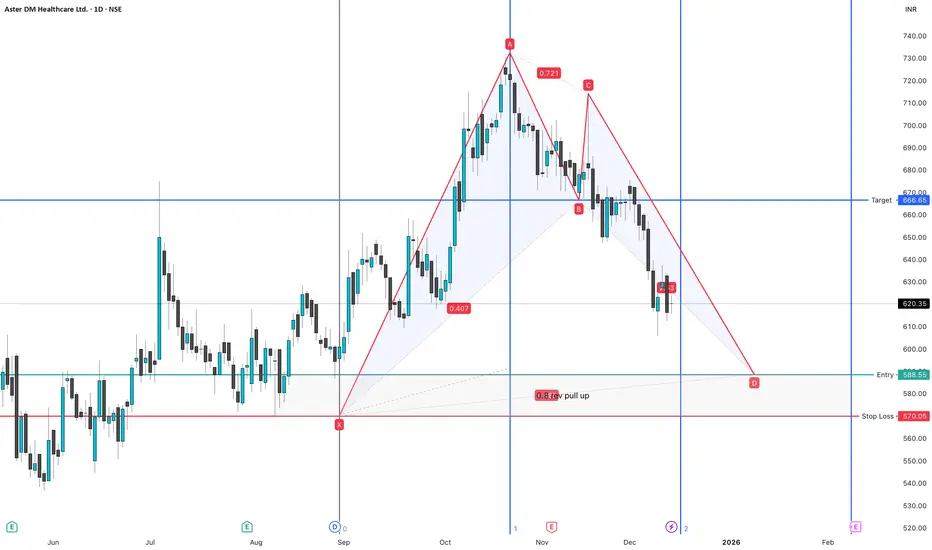
ASTERDM Bull 0.8 rev - BAT pattern , 1 day frameASTERDM Bull 0.8 rev - BAT pattern , 1 day frame
order block on bottom , rsi below 30 mostly goes up set stop loss and arget
Harmonic Patterns
PCR Trading Strategies Option trading strategies are structured combinations of buying and/or selling options—calls and puts—sometimes along with the underlying asset, to achieve specific risk–reward objectives. Unlike simple stock trading, options allow traders to profit from price movement, time decay, volatility changes, and range-bound markets. The choice of strategy depends on market outlook, volatility, capital availability, and risk tolerance.
Option strategies can broadly be classified into directional strategies, non-directional strategies, volatility-based strategies, and hedging strategies.

Candle Patterns How to Use Candlestick Patterns Effectively
Confirm with Trend and Volume: Candlestick patterns are more reliable when combined with trend analysis and volume confirmation. For example, a bullish engulfing pattern is stronger if trading volume is higher than average.
Use Multiple Time Frames: Analyze patterns across multiple time frames for better context. A pattern on a daily chart may carry more weight than one on a 5-minute chart.
Combine with Technical Indicators: Using RSI, MACD, or moving averages alongside candlestick patterns improves decision-making and reduces false signals.
Risk Management: Candlestick patterns provide potential signals, not guarantees. Always use stop-loss orders and proper position sizing.
Practice and Observation: Recognizing patterns takes practice. Backtesting historical charts helps identify the effectiveness of patterns in different market conditions.

Premium Chart Patterns Common Mistakes to Avoid
Misidentifying patterns due to imperfect symmetry.
Ignoring volume confirmation.
Overtrading on minor patterns instead of premium patterns.
Neglecting risk management.
Confusing continuation patterns for reversals and vice versa.

Volatility Index Trading: Understanding and Strategies1. Introduction to the Volatility Index
A volatility index, commonly known as the VIX, is often referred to as the “fear gauge” of the market. It measures the expected price fluctuation of a stock market index over a specific period, usually 30 days. For instance, the most widely recognized VIX is the CBOE Volatility Index, which tracks the implied volatility of the S&P 500 index options.
Implied volatility is derived from option prices and reflects the market’s expectations of future market movements rather than historical price changes. When markets are calm, the VIX tends to be low, suggesting minimal expected price swings. Conversely, during periods of market stress, uncertainty, or geopolitical tension, the VIX often spikes, signaling heightened investor fear.
The concept of trading the volatility index appeals to investors because it provides opportunities to profit in both rising and falling markets, especially during high volatility periods when traditional strategies may struggle.
2. How Volatility Index Trading Works
Unlike conventional assets, the volatility index is not directly tradable. Traders cannot buy or sell the VIX itself; instead, they use derivative instruments such as futures, options, and exchange-traded products (ETPs) based on the VIX.
VIX Futures: These are contracts that speculate on the future value of the VIX. Each futures contract has an expiration date, and traders can profit from changes in the VIX level. The futures market allows for hedging and speculation in anticipation of market turbulence.
VIX Options: Similar to options on stocks or indices, VIX options give traders the right, but not the obligation, to buy or sell VIX futures at a predetermined strike price. Options offer flexibility to construct sophisticated strategies, including spreads and hedges against market downturns.
Exchange-Traded Products (ETPs): ETPs, such as VIX ETFs and ETNs, provide exposure to the volatility index without directly trading futures. These instruments are popular among retail investors due to their accessibility and simplified trading mechanics.
3. Characteristics of Volatility Trading
Volatility trading has unique characteristics that differentiate it from traditional asset trading:
Inverse Correlation with Equities: Typically, the VIX rises when stock markets fall and decreases when markets are bullish. This negative correlation allows traders to use the VIX as a hedge against market downturns.
Mean-Reverting Nature: The VIX generally exhibits mean-reverting behavior, meaning extreme spikes or dips tend to normalize over time. Traders often use this feature to design strategies that anticipate the index returning to its average level.
High Sensitivity to Market News: Economic data releases, central bank policies, geopolitical conflicts, and corporate earnings can trigger rapid VIX movements. Traders must stay informed to capture opportunities effectively.
Time Decay in Derivatives: Since VIX derivatives are tied to futures contracts, the value of options and ETPs is affected by contango (when future prices are higher than the spot) or backwardation (when future prices are lower). Understanding this is crucial for timing trades.
4. Common VIX Trading Strategies
Volatility index trading requires specialized strategies, as it behaves differently from equities. Here are several popular approaches:
a) Hedging Strategies
Investors use VIX instruments to protect their portfolios from sudden market declines. By taking a long position in VIX futures or ETFs, traders can offset losses in equities during market crashes. This is particularly effective for institutional investors holding large stock positions.
b) Directional Trading
Traders can take positions based on anticipated market volatility:
Long Volatility: Buy VIX futures or options expecting an increase in market volatility, often during economic uncertainty or political events.
Short Volatility: Sell VIX derivatives anticipating low volatility or market stability, profiting from premium decay.
c) Spread Strategies
Traders often use calendar spreads and straddles to exploit VIX volatility patterns:
Calendar Spread: Buying a longer-dated VIX future while selling a shorter-dated one to benefit from convergence or divergence in contract prices.
Straddle/Strangle: Buying options with the same strike (straddle) or different strikes (strangle) to profit from significant volatility swings, regardless of direction.
d) Mean Reversion Plays
Since the VIX is mean-reverting, traders may buy when the index is unusually low and sell when it spikes excessively. Technical analysis indicators like Bollinger Bands or moving averages are commonly applied to identify entry and exit points.
5. Advantages of VIX Trading
Diversification: VIX derivatives allow investors to diversify portfolios beyond traditional asset classes.
Risk Management: Provides an effective hedge against market downturns.
Profit in Bear Markets: Unlike long-only equity strategies, VIX trading offers profit potential even when markets decline.
Leverage Opportunities: Futures and options allow for amplified returns, although with increased risk.
6. Risks in Volatility Index Trading
Despite its benefits, trading the VIX carries significant risks:
Complexity: Derivatives on volatility are highly complex and require deep understanding of futures markets and options pricing.
Time Decay and Roll Costs: Long-term VIX strategies may incur costs due to contango and options’ theta decay.
Rapid Price Swings: The VIX can spike dramatically in minutes due to news or market panic, leading to sudden losses.
Liquidity Issues: Some VIX derivatives may have lower liquidity compared to underlying equity markets, affecting trade execution.
7. Tools and Analysis Techniques
Successful VIX trading relies on a combination of technical analysis, fundamental insights, and sentiment monitoring:
Technical Indicators: Moving averages, Bollinger Bands, RSI, and Fibonacci levels help identify mean-reversion points and breakout signals.
Macro Analysis: Monitoring interest rates, inflation, central bank announcements, and global events provides context for expected volatility.
Market Sentiment: Tracking option volumes, put-call ratios, and equity flows gives insight into fear or complacency levels among investors.
8. Practical Considerations
Before entering VIX trading, investors should:
Understand Derivative Mechanics: Ensure familiarity with futures contracts, option greeks, and leverage.
Set Risk Management Rules: Use stop-losses, position sizing, and diversification to manage extreme market swings.
Stay Updated: Monitor economic calendars, geopolitical news, and market sentiment indicators.
Start Small: Begin with limited positions in ETFs or options before scaling to larger futures trades.
9. Conclusion
Volatility index trading represents a sophisticated approach to financial markets, offering opportunities to hedge risk, diversify portfolios, and profit from market uncertainty. While the VIX does not trade like conventional assets, futures, options, and ETPs provide avenues for speculation and risk management. Its unique characteristics, such as negative correlation with equities, mean-reversion tendencies, and sensitivity to macro events, make it both an attractive and challenging instrument.
Traders must combine technical and fundamental analysis with disciplined risk management to navigate VIX trading effectively. Those who master it gain a powerful tool to capitalize on market volatility and protect their investments during periods of uncertainty.
In essence, VIX trading is not just a speculative activity—it is a strategic approach to understanding and navigating the psychology of the markets, turning fear into opportunity.

Energy Trading in the Era of GeopoliticsPower, Strategy, and Global Influence
Energy trading has always been a vital component of the global economy, but in the modern era, it has become inseparably linked with geopolitics. Oil, natural gas, coal, uranium, and increasingly renewable energy resources are no longer just commodities exchanged on markets; they are strategic assets that shape alliances, trigger conflicts, and redefine global power structures. In the geopolitics era, energy trading sits at the crossroads of economics, diplomacy, security, and technological transformation.
1. Energy as a Strategic Commodity
Energy is the lifeblood of modern economies. Industrial production, transportation, military operations, and digital infrastructure all depend on reliable energy supplies. Because of this, countries that control energy resources or key transit routes gain disproportionate influence on the global stage. Energy trading is therefore not only about price discovery and supply-demand dynamics but also about national security and strategic leverage.
Oil-rich nations, gas exporters, and countries controlling chokepoints such as the Strait of Hormuz, Suez Canal, or key pipeline routes can influence global markets simply through policy decisions or geopolitical signaling. A supply disruption, even a perceived one, can send shockwaves across financial markets, highlighting how deeply energy trading is embedded in geopolitics.
2. Geopolitical Conflicts and Energy Markets
Wars, sanctions, and diplomatic standoffs directly affect energy trading. Conflicts in energy-producing regions often lead to supply disruptions, price volatility, and shifts in trade flows. Sanctions imposed on energy exporters can restrict supply, force rerouting of trade, or encourage alternative payment systems and currencies.
For example, geopolitical tensions between major powers often result in energy being used as a tool of pressure. Exporters may weaponize supply by reducing output or redirecting exports, while importers seek to diversify sources to reduce dependency. As a result, energy trading desks today must factor in political risk alongside traditional market indicators.
3. Energy Trading as a Tool of Diplomacy
Energy trade agreements frequently serve diplomatic purposes. Long-term oil and gas contracts can cement alliances, while joint energy projects such as pipelines, LNG terminals, or power grids can bind countries together economically and politically. Energy diplomacy allows nations to project influence without direct military engagement.
In the geopolitics era, energy trading often becomes a bargaining chip in negotiations on unrelated issues such as defense cooperation, trade agreements, or regional stability. Preferential pricing, investment access, or supply guarantees are used to strengthen strategic partnerships.
4. Rise of Energy Nationalism
Energy nationalism has re-emerged as a dominant theme. Governments increasingly seek to control domestic energy resources, regulate exports, and protect strategic industries. National oil companies and state-owned utilities play a major role in global energy trading, often prioritizing political objectives over pure profitability.
This trend affects global markets by reducing transparency and increasing uncertainty. Policy decisions such as export bans, windfall taxes, or price caps can distort market signals, making energy trading more complex and politically sensitive.
5. Energy Security and Supply Diversification
In a geopolitically unstable world, energy security has become a top priority for importing nations. Energy trading strategies now emphasize diversification of suppliers, routes, and energy types. Liquefied natural gas (LNG) trading has expanded rapidly because it offers flexibility compared to fixed pipelines.
Countries invest heavily in strategic petroleum reserves, long-term contracts, and alternative energy sources to shield themselves from geopolitical shocks. This shift reshapes global energy trading patterns, reducing reliance on single suppliers and encouraging regional energy hubs.
6. Financial Markets and Energy Geopolitics
Energy trading is deeply connected to financial markets. Futures, options, swaps, and derivatives allow market participants to hedge geopolitical risks, but they also amplify volatility when uncertainty rises. Political statements, sanctions announcements, or military escalations can move energy prices within minutes.
Speculative capital flows into energy markets during geopolitical crises, sometimes exaggerating price movements. As a result, energy trading desks must integrate geopolitical intelligence with technical and fundamental analysis.
7. Transition to Renewable Energy and New Geopolitics
The global shift toward renewable energy is reshaping energy geopolitics rather than eliminating it. While renewables reduce dependence on fossil fuel exporters, they create new dependencies on critical minerals such as lithium, cobalt, nickel, and rare earth elements. Countries controlling these resources gain strategic importance.
Energy trading in renewables involves power purchase agreements, carbon markets, and green certificates, all influenced by government policies and international climate commitments. The geopolitics of energy is evolving from oil and gas dominance to competition over clean energy technology and supply chains.
8. Carbon Markets and Political Influence
Carbon trading has become a new frontier in energy geopolitics. Emissions trading systems and carbon pricing mechanisms are shaped by political negotiations and international agreements. Countries with strict carbon regulations can influence global trade patterns by imposing carbon border taxes, affecting energy-intensive exports.
Energy traders must now consider not only fuel prices but also carbon costs, regulatory risks, and climate diplomacy. This adds another layer of geopolitical complexity to energy markets.
9. Energy Trading and Emerging Economies
Emerging economies play an increasingly important role in energy geopolitics. Rapid industrialization and urbanization drive energy demand, giving these countries greater influence in global markets. Their energy trading decisions can shift global supply-demand balances.
At the same time, emerging economies often face vulnerability to price shocks and geopolitical disruptions. Their participation in energy trading reflects a balancing act between securing affordable energy and navigating international political pressures.
10. Future Outlook: A Multipolar Energy World
The geopolitics era is characterized by a multipolar world where no single country dominates energy markets completely. Energy trading will remain volatile, shaped by shifting alliances, technological innovation, and climate policies. Traders, policymakers, and investors must adapt to a landscape where political risk is as important as economic fundamentals.
In the future, successful energy trading will require a deep understanding of geopolitics, cross-border regulations, and strategic behavior of nations. Energy will continue to be a source of power, influence, and conflict, ensuring that geopolitics remains at the heart of global energy markets.
Conclusion
Energy trading in the era of geopolitics is far more than a commercial activity. It is a strategic arena where economics, politics, and security intersect. From oil and gas to renewables and carbon markets, energy trading reflects the shifting balance of global power. As geopolitical tensions persist and the energy transition accelerates, understanding the political dimensions of energy trading is no longer optional—it is essential for navigating the future of global markets.

Technology and Innovation in Trading1. Evolution of Trading Technology
From Open Outcry to Electronic Trading
Earlier, trading occurred through open outcry systems, where traders physically gathered at exchanges to buy and sell assets. This method was slow, prone to human error, and limited participation. The introduction of electronic trading platforms revolutionized markets by allowing orders to be placed digitally, improving speed and accuracy.
Rise of Online Trading Platforms
The emergence of the internet enabled online trading platforms, giving retail investors direct access to markets. Platforms such as terminal-based systems and broker apps democratized trading, reducing dependency on intermediaries and lowering transaction costs.
2. Algorithmic Trading (Algo Trading)
What Is Algorithmic Trading?
Algorithmic trading uses computer programs to execute trades automatically based on predefined rules such as price, volume, time, or technical indicators. These algorithms can process vast amounts of data faster than humans.
Benefits of Algo Trading
Speed: Executes trades in milliseconds
Accuracy: Eliminates emotional bias
Efficiency: Handles large order sizes with minimal market impact
Consistency: Follows rules strictly without fatigue
Types of Trading Algorithms
Trend-following algorithms
Mean reversion strategies
Statistical arbitrage
Execution algorithms (VWAP, TWAP)
Algo trading is now widely used by hedge funds, investment banks, and proprietary trading firms.
3. High-Frequency Trading (HFT)
High-frequency trading is an advanced form of algorithmic trading that relies on ultra-low latency systems and high-speed data connections. HFT firms make profits from tiny price inefficiencies by executing thousands of trades per second.
Key Innovations Behind HFT
Co-location services (servers placed near exchange servers)
Fiber-optic and microwave data transmission
Low-latency hardware and software optimization
While HFT improves market liquidity, it has also raised concerns about market fairness and volatility.
4. Artificial Intelligence and Machine Learning in Trading
Role of AI in Trading
Artificial Intelligence (AI) and Machine Learning (ML) enable systems to learn from historical data, identify complex patterns, and adapt strategies dynamically.
Applications of AI and ML
Predictive price modeling
Pattern recognition in charts
Sentiment analysis from news and social media
Risk management and portfolio optimization
Unlike traditional algorithms, AI-based systems improve over time, making them highly valuable in uncertain and fast-changing markets.
5. Big Data and Data Analytics
Explosion of Market Data
Modern trading relies on big data, including:
Tick-by-tick price data
Order book data
Economic indicators
Corporate fundamentals
News, earnings calls, and social media sentiment
Importance of Data Analytics
Advanced analytics tools help traders:
Identify hidden market trends
Measure volatility and correlations
Optimize entry and exit points
Improve backtesting accuracy
Big data analytics has become a cornerstone of institutional trading strategies.
6. Blockchain Technology and Trading
Blockchain in Financial Markets
Blockchain introduces decentralization, transparency, and immutability into trading systems. It enables peer-to-peer transactions without traditional intermediaries.
Innovations Enabled by Blockchain
Cryptocurrency trading
Decentralized exchanges (DEXs)
Smart contracts for automated settlement
Tokenization of assets (stocks, bonds, real estate)
Blockchain reduces settlement time, lowers costs, and enhances trust, especially in cross-border trading.
7. Cloud Computing and Trading Infrastructure
Cloud computing has transformed trading infrastructure by providing scalable, flexible, and cost-efficient computing resources.
Benefits of Cloud-Based Trading Systems
Real-time data access from anywhere
Faster deployment of trading strategies
Reduced hardware and maintenance costs
Enhanced disaster recovery and data security
Both retail traders and institutions increasingly rely on cloud-based analytics and execution platforms.
8. Mobile Trading and Fintech Innovation
Rise of Mobile Trading
Smartphones have enabled anytime, anywhere trading, increasing market participation. Mobile trading apps offer advanced charting, real-time alerts, and instant execution.
Fintech Disruption
Fintech innovations have introduced:
Zero-commission trading
Fractional investing
Robo-advisors
Integrated trading and banking solutions
These innovations have lowered entry barriers and increased financial inclusion.
9. Risk Management and Technology
Technology-Driven Risk Control
Modern trading systems integrate real-time risk management tools, including:
Automated stop-loss execution
Margin monitoring systems
Stress testing and scenario analysis
Exposure and drawdown limits
Technology helps traders identify risks early and take corrective actions before losses escalate.
10. Regulatory Technology (RegTech)
RegTech uses technology to ensure compliance with complex trading regulations. It enables:
Automated reporting
Trade surveillance
Fraud detection
Market abuse monitoring
As markets grow more complex, RegTech plays a critical role in maintaining transparency and investor protection.
11. Impact on Retail Traders
Technology has empowered retail traders by providing:
Advanced charting and indicators
Low-cost execution
Access to global markets
Educational tools and simulators
However, it also demands discipline and continuous learning, as sophisticated tools can amplify both profits and losses.
12. Challenges and Risks of Technological Trading
Despite its benefits, technology-driven trading comes with risks:
System failures and glitches
Over-optimization of strategies
Cybersecurity threats
Over-reliance on automation
Successful traders combine technology with sound judgment and robust risk management.
Conclusion
Technology and innovation have fundamentally transformed trading into a fast-paced, data-driven, and highly competitive activity. From algorithmic execution and AI-driven insights to blockchain-based settlement and mobile trading platforms, innovation continues to redefine how markets function. While technology enhances efficiency, accessibility, and profitability, it also increases complexity and risk. The future of trading belongs to those who can adapt, learn, and responsibly leverage technology while maintaining discipline and strategic clarity. In an increasingly digital financial world, technology is no longer a support tool—it is the backbone of modern trading.

Inflation Nightmare Continues1. Understanding the Inflation Nightmare
Inflation refers to a sustained rise in the general price level of goods and services, reducing the purchasing power of money. When inflation remains high for a prolonged period and becomes difficult to control, it turns into an “inflation nightmare.” This nightmare is characterized by persistent cost pressures, declining real incomes, policy dilemmas, and economic uncertainty. In many economies, inflation has stopped being a short-term shock and has become a structural problem, affecting households, businesses, and governments alike.
2. Persistent Rise in Cost of Living
One of the most visible effects of continuing inflation is the relentless rise in the cost of living. Prices of essential items such as food, fuel, housing, healthcare, and education continue to increase faster than income growth. Middle-class and lower-income households suffer the most, as a larger portion of their earnings goes toward necessities. Even salaried individuals with stable jobs find it increasingly difficult to maintain their previous standard of living.
3. Erosion of Purchasing Power
High inflation steadily erodes purchasing power. Money saved today buys fewer goods and services tomorrow. Fixed-income groups such as pensioners, retirees, and low-wage workers are hit hardest because their incomes do not adjust quickly to rising prices. Over time, this erosion discourages savings and pushes people toward risky investments just to preserve wealth.
4. Food Inflation and Supply-Side Pressures
Food inflation plays a central role in prolonging the inflation nightmare. Factors such as climate change, erratic monsoons, droughts, floods, rising fertilizer costs, and supply chain disruptions push food prices higher. Since food constitutes a significant share of household expenditure, especially in developing economies, even moderate food inflation causes severe social and political stress.
5. Energy Prices and Fuel Shock
Energy prices remain a major driver of inflation. Rising crude oil, natural gas, and electricity costs increase transportation, manufacturing, and logistics expenses. These higher input costs are passed on to consumers, creating second-round inflation effects. Fuel inflation also affects public transport fares and freight costs, amplifying price pressures across the economy.
6. Global Factors Fueling Inflation
The inflation nightmare is not limited to one country; it is global in nature. Geopolitical conflicts, trade disruptions, sanctions, and de-globalization trends have increased the cost of imports and reduced supply efficiency. Currency depreciation in emerging markets further worsens inflation by making imported goods more expensive, particularly energy and technology-related products.
7. Wage-Price Spiral Risk
As inflation persists, workers demand higher wages to cope with rising living costs. While wage hikes are necessary for survival, they can lead to a wage-price spiral. Businesses facing higher wage bills raise product prices, which in turn triggers fresh wage demands. This self-reinforcing cycle makes inflation harder to control and prolongs the nightmare.
8. Impact on Businesses and Profit Margins
Businesses face rising input costs, higher borrowing rates, and uncertain demand. Small and medium enterprises (SMEs) are particularly vulnerable because they have limited pricing power and thinner margins. Many companies are forced to either reduce output, compromise on quality, or pass costs onto consumers, further fueling inflationary pressures.
9. Central Bank Policy Dilemma
Central banks play a critical role in fighting inflation, but persistent inflation puts them in a policy dilemma. Raising interest rates helps control inflation but slows economic growth, increases unemployment, and raises borrowing costs. Keeping rates low supports growth but risks allowing inflation to spiral out of control. This delicate balance makes policy decisions more complex and politically sensitive.
10. High Interest Rates and Borrowing Stress
To curb inflation, central banks often increase interest rates. While this helps cool demand, it also raises EMIs on home loans, personal loans, and business credit. Households delay spending, and companies postpone expansion plans. High interest rates can eventually lead to economic slowdown or even recession, deepening public anxiety.
11. Government Fiscal Challenges
Inflation increases government expenditure on subsidies, welfare schemes, and interest payments on debt. At the same time, governments face pressure to reduce taxes or provide relief to citizens. Balancing fiscal discipline with social support becomes increasingly difficult, especially for developing economies with limited resources.
12. Rising Inequality
Persistent inflation worsens income and wealth inequality. Wealthier individuals often hold assets like real estate, equities, or commodities that appreciate with inflation, while poorer households rely on cash incomes and savings that lose value. As a result, the gap between rich and poor widens, leading to social tension and dissatisfaction.
13. Decline in Consumer Confidence
When inflation remains high, consumer confidence weakens. People become cautious, postpone discretionary spending, and focus only on essentials. Reduced consumption affects business revenues, slows economic growth, and increases the risk of stagflation—a situation where high inflation coexists with low growth.
14. Impact on Financial Markets
Inflation uncertainty creates volatility in financial markets. Equity markets struggle as higher interest rates reduce corporate earnings valuations. Bond prices fall as yields rise. Investors constantly rebalance portfolios to hedge against inflation, often favoring commodities, gold, or inflation-protected assets, which further shifts capital flows.
15. Long-Term Economic Damage
If the inflation nightmare continues unchecked, it can cause long-term economic damage. Investment slows, productivity growth weakens, and innovation suffers. Economic planning becomes difficult for both households and businesses, reducing overall efficiency and confidence in the system.
16. Psychological and Social Stress
Beyond economics, inflation creates psychological stress. Constant worry about rising expenses affects mental health, family stability, and social harmony. Public frustration often manifests in protests, political pressure, and demands for policy changes, increasing social instability.
17. The Road Ahead
Ending the inflation nightmare requires coordinated efforts. Structural reforms, supply-side improvements, stable monetary policy, fiscal discipline, and global cooperation are essential. Short-term relief measures must be balanced with long-term solutions to ensure sustainable price stability without sacrificing growth.
18. Conclusion
The continuation of the inflation nightmare is one of the most pressing challenges facing modern economies. It affects every layer of society—from households and businesses to governments and financial markets. Persistent inflation erodes purchasing power, fuels inequality, distorts investment decisions, and creates policy dilemmas. Addressing it requires patience, credibility, and well-coordinated economic strategies. Until inflation is firmly under control, the nightmare remains far from over.

BTC/USD 1 Day Time Frame Live intraday BTC/USD price (1‑day timeframe): ~$90,368 USD (with a high near ~$92,705 and low near ~$89,560 today) — updated in real‑time.
Real‑time exchange aggregator sites also show similar live ranges:
• BTC ranges roughly $89,500 – $92,700 (24h low/high) on major exchanges.
• Live price data from CoinMarketCap & CoinGecko shows ~$90,100 – $92,300 in recent pricing.
📊 Daily (1D) Key Levels — BTC/USD
Support Levels (bullish buffers where price may bounce):
S1: ~$90,200 – $90,300 — near current trading zone and pivot support.
S2: ~$87,600 – $88,000 — secondary support zone from recent range structure.
S3: ~$85,500 – $86,000 — stronger support if sellers push deeper.
Resistance Levels (sell pressure zones / breakout targets):
R1: ~$94,800 – $95,000 — first upside resistance from pivot targets.
R2: ~$97,000 – $97,500 — medium‑term resistance from recent range highs.
Psychological / higher area: ~$100,000 round number. Traders watch this as a big breakout level if BTC climbs above R2. (Observed market behavior)
📈 Daily Price Range (Current 24h)
Approximate intraday price band:
Low: ~$89,500
High: ~$92,700
This defines today’s 1‑day candle range — useful for intraday support/resistance decisions.

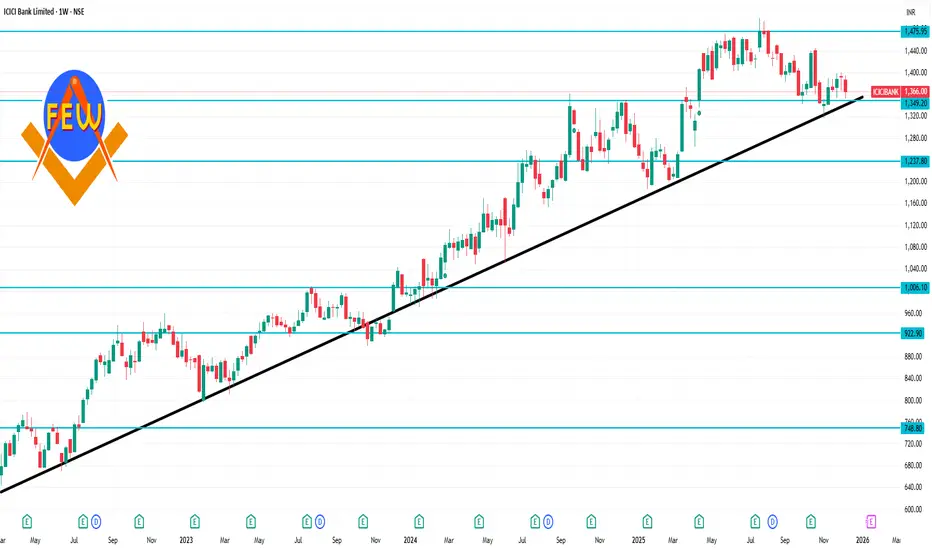
ICICIBANK 1 Week Time Frame 📌 Current Price Snapshot
ICICIBANK ~ ₹1,366 – ₹1,390 (approx) on NSE (recent trading range).
📈 Weekly Pivot Levels (Key Levels for the Week)
(These are calculated using the previous week’s high, low, and close)
Level Type Value
Weekly Pivot (CP) ₹1,337
Weekly Resistance 1 (R1) ₹1,357
Weekly Resistance 2 (R2) ₹1,371
Weekly Resistance 3 (R3) ₹1,391
Weekly Support 1 (S1) ₹1,323
Weekly Support 2 (S2) ₹1,303
Weekly Support 3 (S3) ₹1,289
Central Pivot Range (CPR):
Top CPR: ₹1,340
Bottom CPR: ₹1,334
(CPR is often a good intraday/weekly trend indicator: above CPR = bullish, below = bearish)
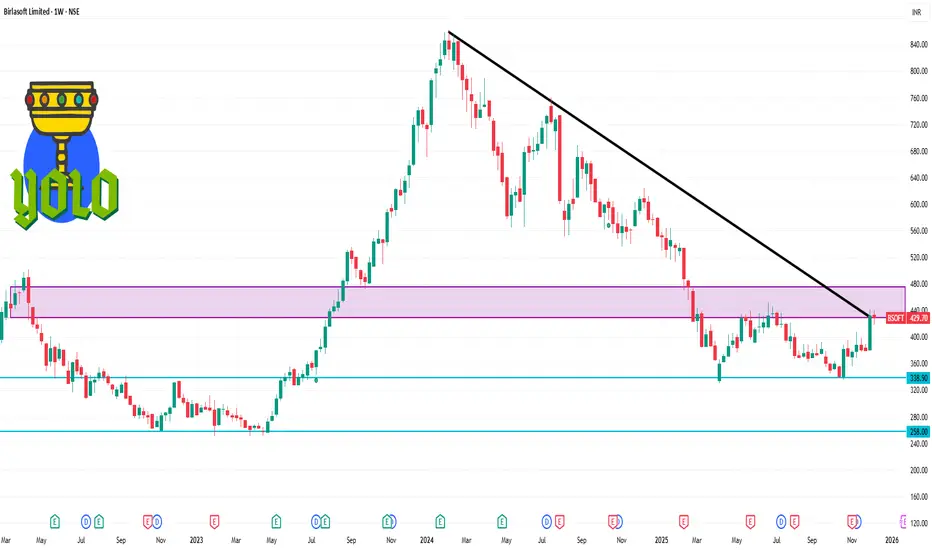
BSOFT 1 Week Time Frame 📌 Current Price Context
• Birlasoft is trading around ₹428–₹430 on NSE (Dec 12 2025).
• On a 1-week basis recently the price moved slightly down (~-0.7%).
📊 Short-Term Levels (1 Week / Swing Trading)
⚡ Immediate Support Levels
These are price zones where buyers may step in if the stock pulls back:
₹425–₹420 — first support zone (near current price cushion).
₹408–₹402 — deeper support zone if weakness extends.
~₹395 — third support level for risk-off moves.
If the price closes below ₹420 weekly, the short-term bias can turn bearish and more downside (toward ₹402–₹395) may unfold.
🚀 Resistance Levels to Watch
These are levels where the stock may struggle to break above:
₹430–₹434 — near current short-term resistance cluster.
₹438–₹443 — next resistance band above.
A clear weekly close above ₹434–₹438 would improve short-term bullish momentum.
📈 Technical Pattern Notes
Some charting interpretations from community and analysts suggest:
A double-bottom base around ₹330 with a neckline near ₹445–₹450, which is a bullish reversal pattern on higher timeframes. A breakout above ~₹450 could signal stronger upside continuation.
$BTC: Technical Breakdown (High-Probability Bearish Setup)CRYPTOCAP:BTC : Technical Breakdown (High-Probability Bearish Setup)
Market Structure Shift
Bitcoin has Already lost $107000 major bullish support and is sustaining below it, confirming a bearish market phase.
The Head & Shoulders distribution pattern is fully validated.
Head & Shoulders Measurement
As per classical H&S rules, the 162% extension target of the pattern has already been achieved on the downside, indicating:
🔹 Pattern completion
🔹 Cycle top likely formed
🔹 Transition from bull to bear phase
Fibonacci Retracement (Macro Bear Framework)
Measured from bear-market low → cycle top, Fibonacci levels project:
0.382 Fib: ~$56,700
0.5 Fib: ~$44,000 → key bear market acceptance zone
0.618 Fib: ~$35,000 → strongest macro support / worst-case scenario
Current price action still reflects a healthy macro retracement, not capitulation.
Liquidity & Imbalance
Despite the bearish structure, a Fair Value Gap (FVG) remains unmitigated in the $98,000–$100,000 range.
This level may act as a liquidity magnet before the next impulsive leg down.
Bias & Scenarios
Primary bias: Bearish
Relief rally possibility: $98K–$100K (FVG fill)
Next downside leg: $70K–$60K, then deeper Fib supports
Conclusion
With H&S 162% target completed and structure broken, BTC remains bearish by technical definition.
Trade only with confirmation, manage risk, and respect all valid scenarios.
NFa & DYOR

GILLETE BAT 0.8 revGILLETE BAT 0.8 rev on order block which make more pull up, consolidate and order block cover happen by that 0.8 zoon

NIFTY- Intraday Levels - 15th December 2025If NIFTY sustain above 26058/70/88 above this bullish then around 26109 strong level above more bullish above this wait more levels marked on chart
If NIFTY sustain below 26034 below this bearish then 25991/85/71 below this more bearish then 25949/38 strong level and last hope 25889/84/63 day closing below this will be considered bearish , below this wait more levels marked on chart
My view :-
"My viewpoint, offered purely for analytical consideration, The trading thesis is: Nifty (bearish tactical approach: sell on rise)
16th dec Expiry is expected to be buy on dip probably last chance to exit long position for this month.
This analysis is highly speculative and is not guaranteed to be accurate; therefore, the implementation of stringent risk controls is non-negotiable for mitigating trade risk."
Consider some buffer points in above levels.
Please do your due diligence before trading or investment.
**Disclaimer -
I am not a SEBI registered analyst or advisor. I does not represent or endorse the accuracy or reliability of any information, conversation, or content. Stock trading is inherently risky and the users agree to assume complete and full responsibility for the outcomes of all trading decisions that they make, including but not limited to loss of capital. None of these communications should be construed as an offer to buy or sell securities, nor advice to do so. The users understands and acknowledges that there is a very high risk involved in trading securities. By using this information, the user agrees that use of this information is entirely at their own risk.
Thank you.

Part 2 Candle Stick Patterns Greeks in Options
Option Greeks measure the sensitivity of options to various factors.
a. Delta
Measures change in premium when underlying moves.
b. Gamma
Measures change in delta.
c. Theta
Measures time decay—how quickly premium reduces.
d. Vega
Measures impact of volatility.
e. Rho
Measures impact of interest rate changes.
Beginners primarily track Delta and Theta.

Nifty bullish movement in 1 hour time frameit looks like up trend may be continue, the reversal trend take support at retracement level of 0.618 to major trend and 1.618 to minor trend
and this show that up trend may continue,look bullish

Part 2 Support and ResistanceImportant Option Trading Terms
a. In-The-Money (ITM)
Options with intrinsic value.
b. At-The-Money (ATM)
Strike price near the current market price.
c. Out-of-The-Money (OTM)
Options with no intrinsic value—cheaper but riskier.
d. Expiry
Last trading day of the option contract.
India has:
Weekly expiry (Index)
Monthly expiry (Stocks & Index)
e. Lot Size
You trade options in a fixed quantity called lot size.

Candle Patterns Candle Patterns and Volume Profile
Volume profile defines where most trading activity occurs.
Key zones:
VAL (Value Area Low) → Strong buy zone
VAH (Value Area High) → Strong sell zone
POC (Point of Control) → Strong rejection or acceptance
High Volume Node (HVN) → Reversal zones
Low Volume Node (LVN) → Breakout zones
Combine candle patterns:
Example setups:
Bullish Engulfing at VAL
Shooting Star at VAH
Pin Bar at LVN breakout
Inside Bar at HVN compression
This combination gives professional-level accuracy.

Premium Chart Patterns Rules for Trading Chart Patterns
Wait for confirmation
Don’t assume a breakout. Always wait for a close beyond the breakout level.
Use volume confirmation
High volume strengthens signals.
Trade only strong patterns
Avoid weak, uneven, unclear structures.
Always check market trend
Pattern reliability increases in the direction of trend.
Use stop-loss
Set SL below support (bullish) or above resistance (bearish).
Measure target using pattern height
Many patterns provide measurable targets.
Combine with indicators
RSI, EMA, MACD improve accuracy.

Part 12 Trading Master Class Buyers vs Sellers
Every option contract has two sides:
Option Buyer
Pays a premium.
Has limited risk (only premium loss).
Has unlimited profit potential.
Needs significant price movement to make money.
Option Seller/Writer
Receives the premium.
Has limited profit (premium received).
Has high or unlimited risk.
Benefits when price stays stable or moves slightly.
Most professional traders prefer selling options because time works in their favour.

Part 11 Trading Master Class Types of Options
There are two basic types:
a) Call Option (CE)
A Call Option gives the right to buy the underlying at a fixed strike price.
Traders buy calls when they expect the price to go up.
Example: Nifty trading at 22,000 → You buy 22,200 CE expecting upside.
b) Put Option (PE)
A Put Option gives the right to sell at a fixed strike price.
Traders buy puts when they expect the price to fall.
Example: Nifty trading at 22,000 → You buy 21,800 PE expecting downside.

Introduction to Derivatives and Options1. Derivatives Trading Strategies
Derivatives can be traded using a variety of strategies depending on market expectations, risk tolerance, and investment objectives.
A. Hedging Strategies
Hedging is a risk management technique used to protect against adverse price movements in the underlying asset.
Futures Hedging:
A trader holding a physical asset (like wheat, crude oil, or shares) can hedge by taking a futures position in the opposite direction. For example, a farmer expecting to sell wheat in three months can sell wheat futures now to lock in the price, reducing the risk of price decline.
Portfolio Hedging with Index Futures:
Institutional investors can hedge against market-wide risk using index futures. For instance, holding a portfolio of Nifty 50 stocks, an investor may sell Nifty futures to protect against a market downturn.
Interest Rate Hedging with Swaps:
Companies with floating-rate loans may use interest rate swaps to exchange variable payments for fixed payments, thus reducing exposure to interest rate fluctuations.
B. Speculative Strategies
Speculators use derivatives to profit from price movements in underlying assets without necessarily owning them.
Long and Short Futures:
Traders can go long (buy) if they expect prices to rise or short (sell) if they expect prices to fall. For example, a trader anticipating a rise in crude oil prices buys crude futures to benefit from price appreciation.
Spread Trading:
Spread strategies involve taking offsetting positions in related derivatives to profit from relative price movements. Common spreads include:
Calendar spreads: Buying a long-dated contract while selling a short-dated contract.
Inter-commodity spreads: Trading price differences between related commodities, like gold vs. silver.
Leverage and Margin Trading:
Derivatives often allow high leverage, enabling traders to control large positions with smaller capital. While leverage increases profit potential, it also amplifies risk.
C. Arbitrage Strategies
Arbitrage exploits price inefficiencies between markets or instruments to earn risk-free or low-risk profits.
Cash-and-Carry Arbitrage:
Traders buy the underlying asset and sell futures simultaneously if futures are overpriced relative to spot prices.
Index Arbitrage:
Exploits differences between index futures and the actual underlying stocks in the index.
Inter-market Arbitrage:
Identifying price discrepancies across different exchanges for the same asset.
2. Option Trading Strategies
Options trading strategies can be divided into basic strategies for beginners and advanced strategies for professional traders.
A. Basic Option Strategies
Long Call:
Buy a call option expecting the underlying asset to rise.
Risk: Limited to premium paid.
Reward: Unlimited potential profit.
Long Put:
Buy a put option expecting the underlying asset to fall.
Risk: Limited to premium paid.
Reward: Gains increase as the asset price declines.
Covered Call:
Holding the underlying stock and selling a call option on it.
Objective: Earn premium income while holding the stock.
Risk: Stock may rise above strike price; profit is capped.
Protective Put:
Buy a put option while holding the underlying asset.
Objective: Insure against a price drop.
Cost: Premium paid for the put.
B. Advanced Option Strategies
Spreads
Spreads involve buying and selling options of the same type (calls or puts) with different strike prices or expirations to limit risk and optimize returns.
Bull Call Spread:
Buy a call at a lower strike and sell a call at a higher strike.
Profitable if the underlying price rises moderately.
Lower cost than a simple long call.
Bear Put Spread:
Buy a put at a higher strike and sell a put at a lower strike.
Profitable if the underlying price falls moderately.
Calendar Spread:
Buy a long-term option and sell a short-term option at the same strike.
Profits from time decay differences.
Straddles and Strangles
These are volatility strategies designed to profit from significant price movements, regardless of direction.
Straddle:
Buy both a call and put at the same strike price.
Profitable if the asset moves sharply up or down.
Strangle:
Buy a call and put with different strike prices.
Cheaper than straddle but requires larger price movement for profit.
Butterfly and Condor Spreads
Butterfly Spread: Combines buying and selling multiple options to profit from minimal price movement.
Iron Condor: Uses both call and put spreads to generate income in low-volatility markets.
Synthetic Positions
Synthetic Long Stock: Buy a call and sell a put at the same strike.
Synthetic Short Stock: Sell a call and buy a put.
Purpose: Mimics stock positions using options, often at lower capital outlay.
3. Risk Management in Derivatives and Options Trading
Risk management is crucial in derivatives trading due to leverage and market volatility.
Stop Loss Orders: Automate exits to limit losses.
Position Sizing: Control exposure relative to capital.
Hedging: Use options or futures to reduce risk on existing positions.
Volatility Assessment: Traders must evaluate implied volatility for option pricing and strategy selection.
4. Practical Applications
Institutional Investors: Use derivatives for hedging portfolios, managing interest rate risk, and currency exposure.
Retail Traders: Utilize options strategies for speculative bets, income generation, and hedging personal investments.
Corporate Usage: Companies hedge commodity prices, interest rates, and foreign currency exposure to stabilize cash flows.
Conclusion
Derivatives and options trading strategies offer a wide array of tools for hedging, speculation, arbitrage, and income generation. While derivatives provide leverage and flexibility, options add non-linear payoff structures that can be tailored for risk and return preferences.
Understanding each strategy, market conditions, and risk-reward dynamics is critical for successful trading. Beginners should start with basic strategies and limited exposure, while advanced traders can explore complex spreads and volatility trades to maximize returns and manage risk effectively.

Investing in Shares: A Comprehensive Overview1. Understanding Shares
Shares, also called stocks or equities, are financial instruments that represent ownership in a corporation. Each share entitles the holder to a fraction of the company's profits, typically distributed as dividends, and gives them voting rights in certain corporate decisions, depending on the type of share held. Shares are issued by companies to raise capital for business expansion, research, or debt repayment. In return, investors hope to earn returns through price appreciation and dividends.
There are two primary types of shares:
Common Shares: These represent ordinary ownership. Shareholders have voting rights and may receive dividends, but they are last in line to claim company assets in case of liquidation.
Preferred Shares: These provide a fixed dividend and have a higher claim on assets than common shares. However, preferred shareholders usually lack voting rights.
2. Why Invest in Shares
Investing in shares can offer several benefits:
Potential for Capital Growth: Shares have the potential to appreciate in value over time, allowing investors to sell them at a higher price than the purchase price.
Dividend Income: Companies often distribute a portion of profits as dividends, providing a steady income stream.
Ownership in a Company: Shareholders have a stake in the company, including the right to vote on major corporate matters.
Hedge Against Inflation: Historically, equities have outperformed inflation, helping preserve the purchasing power of money.
Liquidity: Shares traded on stock exchanges can be bought and sold easily, offering high liquidity compared to other investments like real estate.
3. How Share Prices Are Determined
The price of a share is influenced by a combination of factors:
Company Performance: Profits, revenue growth, and business strategies directly impact investor perception and share price.
Market Sentiment: Investors’ collective emotions, confidence, and speculation can drive prices up or down.
Economic Indicators: Interest rates, inflation, and GDP growth affect share valuations.
Industry Trends: Changes in technology, consumer preferences, and competition influence sector performance.
Global Events: Political instability, trade wars, and global economic conditions can significantly impact share prices.
4. Methods of Investing in Shares
There are different ways to invest in shares, depending on risk tolerance, knowledge, and financial goals:
Direct Investment: Purchasing shares of individual companies through stock exchanges using a brokerage account. Investors need to research companies, analyze financials, and monitor market trends.
Mutual Funds: Equity mutual funds pool money from multiple investors to invest in a diversified portfolio of shares. This reduces risk compared to investing in a single stock.
Exchange-Traded Funds (ETFs): ETFs track the performance of an index or sector and can be traded like individual shares. They offer diversification and low cost.
Dividend Reinvestment Plans (DRIPs): Investors reinvest dividends to purchase more shares, enabling compounding growth over time.
Systematic Investment Plans (SIPs): Investing fixed amounts periodically in equity mutual funds to benefit from rupee cost averaging.
5. Analyzing Shares
Before investing, it is crucial to analyze shares using two main approaches:
Fundamental Analysis: This involves evaluating a company’s financial statements, revenue growth, profit margins, debt levels, management quality, and industry position. Key metrics include Price-to-Earnings (P/E) ratio, Earnings Per Share (EPS), Return on Equity (ROE), and dividend yield. Fundamental analysis helps investors determine a company’s intrinsic value and decide whether the stock is overvalued or undervalued.
Technical Analysis: This focuses on historical price movements, trading volumes, and chart patterns to predict future price trends. Tools like moving averages, support and resistance levels, and momentum indicators are commonly used by traders. Technical analysis is particularly popular for short-term trading strategies.
6. Risk and Reward in Share Investing
Investing in shares involves a trade-off between risk and reward:
Market Risk: Stock prices can fluctuate due to overall market movements or economic conditions.
Company-Specific Risk: Poor management, product failures, or regulatory issues can negatively impact a company’s stock.
Liquidity Risk: Some stocks may be difficult to sell quickly without affecting the price.
Volatility: Share prices can experience rapid ups and downs, especially in emerging markets or high-growth sectors.
Mitigating Risk: Diversification, long-term investment horizons, and informed decision-making reduce risk exposure.
The potential for high returns is higher than traditional investments like fixed deposits or bonds, but so is the risk. Historical data suggests that equities outperform most asset classes over long periods, making them suitable for wealth creation.
7. Strategies for Share Investing
Successful investors adopt strategies based on goals and risk appetite:
Buy and Hold: Investors purchase quality stocks and hold them long-term to benefit from compounding and price appreciation.
Value Investing: Investing in undervalued stocks based on fundamental analysis, a strategy popularized by Warren Buffett.
Growth Investing: Focusing on companies with high growth potential, even if they appear expensive, expecting significant capital appreciation.
Dividend Investing: Prioritizing shares with consistent and high dividend payouts for stable income.
Swing Trading: Short- to medium-term trading based on technical patterns to profit from price fluctuations.
Index Investing: Investing in market indices via ETFs or index funds to replicate overall market performance with minimal effort.
8. The Role of Psychology in Share Investing
Behavioral finance highlights that emotions influence investment decisions. Common psychological pitfalls include:
Herd Mentality: Following the crowd without independent analysis.
Overconfidence: Overestimating one's knowledge or market predictions.
Fear and Greed: Emotional reactions during market volatility can lead to panic selling or excessive risk-taking.
Loss Aversion: Reluctance to sell underperforming stocks, which can magnify losses.
Successful investors maintain discipline, set clear investment goals, and stick to their strategy regardless of short-term market noise.
9. Taxation and Regulatory Considerations
Investing in shares is subject to taxation and regulatory compliance:
Capital Gains Tax: Profits from selling shares may attract short-term or long-term capital gains tax depending on the holding period.
Dividend Distribution Tax: Dividends received are taxed in some jurisdictions.
Regulations: Stock markets are regulated by government authorities (like SEBI in India) to ensure transparency, prevent fraud, and protect investors.
Awareness of these factors helps investors plan their investments efficiently.
10. Conclusion
Investing in shares is both an art and a science, blending financial analysis, market understanding, and behavioral discipline. It offers the potential to grow wealth, generate income, and participate in the growth story of companies. However, it requires knowledge, patience, and risk management. Investors should conduct thorough research, diversify portfolios, and remain focused on long-term objectives to navigate market volatility successfully.
By understanding the fundamentals, adopting effective strategies, and maintaining emotional discipline, investing in shares can become a powerful tool for achieving financial freedom and building lasting wealth. In a world where economic growth is increasingly linked to corporate success, shares remain one of the most accessible and rewarding avenues for individual investors to participate in that growth journey.
