A Complete Guide to Professional Trading MasteryTrade Like a Pro
Trading like a professional is not about making quick money or taking random bets in the market. It is a disciplined, structured, and highly skill-based approach that combines knowledge, psychology, risk management, and consistency. Professional traders treat trading as a business, not a gamble. They focus on long-term survival and steady growth rather than short-term excitement. This guide explains what it truly means to trade like a pro and how retail traders can develop a professional mindset and process.
Understanding the Professional Trader’s Mindset
The first and most important difference between amateur and professional traders is mindset. Professionals accept that losses are a normal part of trading. They do not aim to win every trade; instead, they focus on executing their strategy correctly. A pro trader thinks in probabilities, not certainties. Each trade is just one of many in a long series. Emotional reactions such as fear, greed, and revenge trading are controlled through discipline and experience. This calm and objective mindset allows professionals to make rational decisions even during high market volatility.
Trading as a Business, Not a Hobby
Professional traders operate like business owners. They have a well-defined trading plan, performance metrics, risk rules, and regular reviews. Every trade has a reason, an entry point, a stop-loss, and a target. Just like a business tracks profits and expenses, traders track wins, losses, drawdowns, and expectancy. Without a structured approach, trading becomes impulsive and unsustainable. Treating trading as a business ensures accountability and long-term focus.
Importance of a Solid Trading Plan
A trading plan is the backbone of professional trading. It outlines which markets to trade, which time frames to use, what setups are allowed, and how much capital to risk per trade. Professionals do not change their plan based on emotions or market noise. They follow predefined rules and only refine their plan after proper analysis. A clear plan removes confusion and prevents overtrading, which is one of the biggest mistakes among retail traders.
Risk Management: The Core of Professional Trading
Risk management is what separates professionals from beginners. Pro traders focus more on how much they can lose rather than how much they can gain. They typically risk only a small percentage of their capital on each trade, often 1–2%. This ensures that even a series of losses does not wipe out their account. Stop-loss orders are mandatory, not optional. By controlling risk, professionals stay in the game long enough to benefit from profitable opportunities.
Mastering Market Structure and Price Action
Professional traders understand how markets move. They study market structure, trends, support and resistance, supply and demand, and price behavior. Instead of relying on too many indicators, they focus on clean charts and price action. This helps them read market sentiment and identify high-probability setups. Understanding how institutions operate and where liquidity lies gives professionals an edge over random retail participation.
Choosing the Right Strategy and Sticking to It
There is no single best strategy in trading. Professionals choose a strategy that suits their personality, time availability, and risk tolerance. Some prefer intraday trading, while others focus on swing or positional trading. What matters is consistency. A professional trader does not jump from one strategy to another after a few losses. They trust their tested system and allow probabilities to play out over time.
The Role of Discipline and Consistency
Discipline is the foundation of professional success. Pro traders follow their rules even when emotions push them to act differently. They avoid overtrading, impulsive entries, and emotional exits. Consistency in execution leads to consistency in results. Even a profitable strategy will fail if applied inconsistently. Professionals understand that discipline is more important than intelligence in trading.
Psychology: Controlling Emotions Under Pressure
Trading psychology plays a critical role in professional performance. Fear can cause traders to exit too early, while greed can lead to holding losing trades. Professionals work continuously on emotional control. They develop routines, take breaks, and avoid trading when emotionally disturbed. Many professionals journal their emotions along with trade details to identify psychological patterns and improve decision-making.
Continuous Learning and Market Adaptation
Markets are dynamic and constantly evolving. Professional traders never stop learning. They analyze past trades, study market changes, and adapt strategies when needed. However, adaptation is based on data and experience, not impulse. Professionals stay updated with macroeconomic factors, global events, and sector trends that influence market behavior. Continuous improvement keeps them relevant and competitive.
Patience and Long-Term Vision
Patience is a rare but essential trait in professional trading. Pros wait for the right setup instead of forcing trades. They understand that opportunities come and go, and missing a trade is better than entering a bad one. Their focus is on long-term capital growth, not daily excitement. This long-term vision allows them to survive drawdowns and benefit from compounding returns over time.
Conclusion: Becoming a Professional Trader
Trading like a pro is a journey, not a destination. It requires dedication, discipline, emotional strength, and continuous self-improvement. Professional traders are not perfect, but they are consistent, prepared, and controlled. By treating trading as a business, managing risk effectively, mastering psychology, and following a structured plan, any serious trader can move closer to professional-level performance. Success in trading is not about predicting the market—it is about managing yourself within it.
Harmonic Patterns

Interest Rates: Meaning, Mechanism, and Their ImpactsIntroduction
Interest rates are one of the most important concepts in economics and finance. They influence how individuals save and spend, how businesses invest and expand, and how governments manage economic growth and inflation. In simple terms, an interest rate is the cost of borrowing money or the reward for saving money, expressed as a percentage of the principal amount. Despite this simple definition, interest rates play a complex and powerful role in shaping financial markets and the overall economy.
What Are Interest Rates?
An interest rate is the percentage charged by a lender to a borrower for the use of money over a specific period. For example, if a bank lends ₹1,00,000 at an annual interest rate of 10%, the borrower must pay ₹10,000 as interest over one year, in addition to repaying the principal.
On the other hand, when individuals deposit money in banks or invest in fixed-income instruments, the interest rate represents the return they earn on their savings.
Types of Interest Rates
Interest rates can be classified in several ways:
Nominal Interest Rate
This is the stated rate of interest without adjusting for inflation. Most loan agreements and deposit schemes quote nominal rates.
Real Interest Rate
The real interest rate accounts for inflation and reflects the true purchasing power of money.
Real Interest Rate = Nominal Rate – Inflation Rate
Fixed Interest Rate
A fixed rate remains constant throughout the loan or investment period, offering certainty and stability.
Floating (Variable) Interest Rate
A floating rate changes over time based on a benchmark such as a central bank policy rate or market reference rate.
Short-term and Long-term Interest Rates
Short-term rates apply to instruments like treasury bills, while long-term rates apply to bonds, home loans, and infrastructure financing.
How Interest Rates Are Determined
Interest rates are influenced by a combination of market forces and policy decisions:
Supply and Demand for Money: When demand for loans is high and supply is limited, interest rates tend to rise.
Inflation Expectations: Higher expected inflation leads lenders to demand higher interest rates to protect purchasing power.
Risk Factors: Borrowers with higher credit risk are charged higher interest rates.
Central Bank Policies: Central banks play a dominant role by setting policy rates that influence overall market rates.
Role of Central Banks
Central banks, such as the Reserve Bank of India (RBI) or the US Federal Reserve, use interest rates as a key monetary policy tool. By adjusting policy rates, central banks aim to control inflation, support economic growth, and maintain financial stability.
When Inflation Is High: Central banks increase interest rates to reduce borrowing and spending.
When Growth Is Slow: Central banks cut interest rates to encourage borrowing, investment, and consumption.
These decisions influence bank lending rates, bond yields, and even stock market valuations.
Impact of Interest Rates on the Economy
Interest rates affect almost every aspect of the economy:
Consumers: Lower rates make loans cheaper, encouraging spending on homes, cars, and durable goods. Higher rates increase loan EMIs, reducing disposable income.
Businesses: Low interest rates reduce the cost of capital, encouraging expansion and investment. High rates discourage borrowing and may slow growth.
Government: Interest rates affect the cost of government borrowing and fiscal deficits.
Financial Markets: Bond prices move inversely to interest rates, while stock markets often react sensitively to rate changes.
Interest Rates and Inflation
Interest rates and inflation are closely linked. When inflation rises, central banks usually increase interest rates to reduce excess demand in the economy. Higher interest rates slow down borrowing and spending, which helps control price increases. Conversely, low inflation or deflation often leads to lower interest rates to stimulate economic activity.
Interest Rates in Personal Finance
For individuals, understanding interest rates is essential for effective financial planning:
Loans: Home loans, personal loans, and credit cards are directly impacted by interest rate levels.
Savings and Investments: Fixed deposits, bonds, and savings accounts offer returns based on prevailing interest rates.
Compounding Effect: Over time, interest compounding can significantly increase savings or debt, making early planning crucial.
Global Interest Rate Environment
In a globalized economy, interest rates in one country can influence others. Capital flows tend to move toward countries offering higher interest rates, impacting exchange rates and foreign investment. Global events, such as financial crises or changes in major central bank policies, can lead to synchronized interest rate movements worldwide.
Conclusion
Interest rates are a fundamental pillar of the financial system. They influence borrowing, saving, investing, inflation, and economic growth. Whether you are a student of economics, an investor, a trader, or an ordinary consumer, understanding how interest rates work helps in making informed financial decisions. As economies evolve and global financial conditions change, interest rates will continue to remain a powerful tool shaping both individual financial outcomes and the broader economic landscape.

Swing Trading vs Positional Trading A Profit-Based Comparison for Market Participants
In financial markets, traders adopt different styles depending on their risk appetite, capital size, time availability, and profit expectations. Among the most popular non-intraday approaches are swing trading and positional trading. Both strategies aim to capture price movements beyond a single trading session, yet they differ significantly in holding period, profit potential, risk exposure, and psychological demands. Understanding how profits are generated in swing trading versus positional trading is essential for choosing the right approach and aligning it with personal financial goals.
Understanding Swing Trading and Its Profit Structure
Swing trading focuses on capturing short- to medium-term price swings, typically lasting from a few days to a few weeks. The objective is to profit from momentum, technical breakouts, pullbacks, or reversals within an ongoing trend.
Profit Characteristics of Swing Trading:
Swing traders target frequent but smaller profit opportunities
Typical profit per trade ranges from 2% to 10% depending on volatility
Profits are compounded through multiple trades in a month
Works well in both trending and range-bound markets
Swing trading profits rely heavily on technical analysis, such as support and resistance levels, chart patterns, moving averages, RSI, MACD, and volume analysis. Because trades are shorter, capital is recycled quickly, allowing traders to reinvest profits multiple times.
However, swing trading profits are not guaranteed. Frequent trading increases transaction costs, and incorrect timing can lead to quick stop-loss hits. Profitability depends on discipline, consistency, and strict risk management.
Understanding Positional Trading and Its Profit Structure
Positional trading is a longer-term approach, where traders hold positions from several weeks to months, and sometimes even years. The goal is to benefit from major price trends driven by macroeconomic factors, earnings growth, sectoral shifts, or structural market changes.
Profit Characteristics of Positional Trading:
Targets large price moves, often 15% to 50% or more
Lower trade frequency but higher profit per trade
Relies on trend strength and patience
Less affected by short-term market noise
Positional trading profits often come from trend continuation, supported by fundamental analysis, long-term technical structures, and economic cycles. Because trades are held longer, transaction costs are lower, and emotional pressure from daily price fluctuations is reduced.
The downside is that capital remains locked for extended periods, and profits may take time to materialize. Market reversals, policy changes, or unexpected global events can impact long-term profitability.
Profit Frequency vs Profit Size
One of the most important distinctions between swing trading and positional trading profits lies in frequency versus magnitude.
Swing trading generates profits more frequently, but each trade delivers relatively smaller gains.
Positional trading generates profits less frequently, but each successful trade can produce significantly higher returns.
For example, a swing trader might earn 3–4% per trade but execute 6–10 trades per month, while a positional trader may earn 30% over six months from a single well-chosen position. Over time, both methods can be profitable, but the path to profits differs significantly.
Risk and Drawdown Impact on Profits
Risk plays a crucial role in determining net profits.
Swing Trading Risks:
Higher exposure to short-term volatility
Frequent stop-loss triggers
Emotional stress due to constant monitoring
Overtrading can reduce net profits
Swing traders typically maintain tight stop-losses, limiting losses to 1–2% per trade. While this protects capital, repeated small losses can temporarily reduce profitability if market conditions are unfavorable.
Positional Trading Risks:
Exposure to overnight and macroeconomic risks
Larger drawdowns during corrections
Requires wider stop-loss levels
Capital remains exposed for longer durations
Although positional traders experience fewer trades, drawdowns can be deeper. However, successful positional trades often compensate for multiple small losses, resulting in strong long-term profitability.
Capital Utilization and Compounding Profits
Swing trading allows faster capital rotation, enabling traders to compound profits more quickly if they maintain consistency. This makes swing trading attractive for traders with smaller capital who want to grow their accounts actively.
Positional trading, on the other hand, emphasizes capital preservation and trend-based wealth creation. Compounding occurs over longer periods, making it suitable for traders with larger capital bases and a long-term outlook.
In practical terms:
Swing trading suits traders aiming for monthly income generation
Positional trading suits traders aiming for long-term capital appreciation
Market Conditions and Profit Reliability
Market conditions strongly influence profitability.
Swing trading performs best in volatile or range-bound markets
Positional trading performs best in strong trending markets
During sideways markets, positional traders may struggle to generate profits, while swing traders can exploit repeated price oscillations. Conversely, in strong bull or bear markets, positional traders tend to outperform swing traders by riding long trends without frequent exits.
Psychological Factors and Profit Consistency
Profitability is not just technical—it is psychological.
Swing trading demands constant attention, quick decision-making, and emotional control. Profits can be inconsistent if discipline is lacking.
Positional trading requires patience, conviction, and trust in analysis. Profits are delayed but often more stable over time. Traders who panic during short-term corrections may exit too early, reducing profit potential.
Which Strategy Is More Profitable?
There is no universal answer. Profitability depends on:
Trader personality
Time commitment
Risk tolerance
Market knowledge
Capital size
Swing trading can outperform positional trading in active markets and for disciplined traders who manage risk effectively. Positional trading can outperform swing trading over longer horizons by capturing structural market moves with fewer decisions.
Conclusion
Swing trading and positional trading offer distinct profit pathways. Swing trading emphasizes speed, frequency, and short-term momentum, making it suitable for active traders seeking regular opportunities. Positional trading emphasizes patience, trend conviction, and long-term gains, making it ideal for traders focused on wealth creation rather than daily action.
Ultimately, the most profitable approach is the one that aligns with your temperament, time availability, and financial goals. Many experienced market participants combine both styles—using swing trades for active income while holding positional trades for long-term growth. Consistency, risk management, and discipline remain the true drivers of profit, regardless of the strategy chosen.

Trade Gold and Crypto: Profitable Dual-Asset TradingTrading gold and cryptocurrencies has become one of the most popular strategies among modern traders. These two asset classes represent opposite ends of the financial spectrum: gold is a traditional safe-haven asset with centuries of trust, while crypto is a high-growth, high-volatility digital asset born from technological innovation. Understanding how to trade both effectively allows traders to balance stability with opportunity, manage risk better, and adapt to changing global market conditions.
Understanding Gold Trading
Gold has always been a symbol of value, wealth, and security. In financial markets, gold is primarily traded as a hedge against inflation, currency weakness, geopolitical risk, and economic uncertainty. When confidence in paper currencies or equity markets declines, gold often rises.
Gold can be traded in several ways:
Spot Gold (XAU/USD) in forex markets
Gold Futures on commodity exchanges
Gold ETFs like SPDR Gold Shares
Physical Gold, though less practical for active trading
Gold prices are influenced by factors such as:
US dollar strength (gold usually moves inversely)
Interest rates and bond yields
Inflation data
Central bank buying or selling
Geopolitical tensions and crises
Because gold moves more slowly compared to crypto, it is favored by swing traders, position traders, and conservative investors. Its price action respects technical levels well, making it suitable for chart-based trading strategies.
Understanding Crypto Trading
Cryptocurrencies such as Bitcoin, Ethereum, and altcoins represent a new financial ecosystem based on blockchain technology. Crypto trading offers high volatility, rapid price movements, and strong trending phases, making it attractive for aggressive traders.
Crypto assets are traded via:
Spot trading on exchanges
Futures and perpetual contracts
Options
Decentralized exchanges (DEXs)
Key drivers of crypto prices include:
Market sentiment and speculation
Adoption by institutions and governments
Regulatory news
Technology upgrades and network activity
Liquidity and whale movements
Unlike gold, crypto markets operate 24/7, offering continuous opportunities but also requiring strong discipline. Crypto trading suits day traders, scalpers, and momentum traders who can handle fast price swings.
Key Differences Between Gold and Crypto Trading
Gold and crypto behave very differently in market conditions:
Stability vs Volatility: Gold is relatively stable; crypto is highly volatile.
Market Hours: Gold trades during global market sessions; crypto trades nonstop.
Regulation: Gold is heavily regulated; crypto regulation varies by country.
Risk Profile: Gold is low to moderate risk; crypto is high risk, high reward.
Historical Trust: Gold has thousands of years of credibility; crypto is still evolving.
Understanding these differences is crucial when trading both assets together.
Why Trade Gold and Crypto Together?
Trading both gold and crypto provides diversification across time-tested and future-focused assets. When equity markets crash or inflation spikes, gold often performs well. When liquidity is abundant and risk appetite is high, crypto tends to outperform.
This dual-asset approach allows traders to:
Balance risk and reward
Trade in all market cycles
Hedge positions across asset classes
Reduce emotional overtrading by shifting focus
For example, during global uncertainty, traders may reduce crypto exposure and increase gold positions. During bullish risk-on environments, crypto trading may dominate while gold consolidates.
Trading Strategies for Gold
Some common gold trading strategies include:
Trend Following
Gold often trends cleanly on higher timeframes. Traders use moving averages, trendlines, and breakout levels to ride sustained moves.
Support and Resistance Trading
Gold respects key price zones. Buying near strong support and selling near resistance works well in range-bound conditions.
News-Based Trading
Events such as US inflation data, Federal Reserve decisions, and geopolitical developments often cause sharp gold moves.
Hedging Strategy
Traders use gold to hedge equity or currency exposure during volatile periods.
Trading Strategies for Crypto
Crypto trading strategies are usually faster and more aggressive:
Momentum Trading
Traders enter strong breakouts with high volume, riding rapid price expansions.
Scalping and Day Trading
Small, frequent trades using short timeframes are common due to volatility.
Swing Trading
Capturing multi-day or multi-week trends, especially in Bitcoin and Ethereum.
Narrative and News Trading
Crypto reacts strongly to ETF approvals, regulation news, and ecosystem upgrades.
Risk Management in Gold and Crypto Trading
Risk management is more important than strategy, especially when trading crypto.
Key principles include:
Never risk more than a small percentage of capital per trade
Always use stop-loss orders
Avoid over-leveraging, particularly in crypto futures
Adjust position size based on volatility
Separate long-term investments from trading capital
Gold allows higher position sizing due to lower volatility, while crypto positions should be smaller to manage risk effectively.
Psychological Discipline
Gold trading tests patience, as moves can be slow and methodical. Crypto trading tests emotional control, as sudden spikes and crashes can trigger fear and greed.
Successful traders:
Stick to predefined trading plans
Avoid chasing pumps or panic selling
Accept losses as part of trading
Remain consistent across both asset classes
Combining gold and crypto trading helps develop balanced trading psychology—calm decision-making from gold trading and sharp execution from crypto trading.
Long-Term Outlook
Gold is likely to remain relevant as long as inflation, debt, and geopolitical risks exist. Central banks continue to accumulate gold, reinforcing its long-term value.
Crypto represents the future of digital finance, decentralized systems, and alternative monetary structures. While volatility will remain high, adoption continues to grow.
Traders who understand both assets gain a strategic edge, positioning themselves to benefit from traditional market safety and modern financial innovation.
Conclusion
Trading gold and crypto together is not about choosing one over the other—it is about mastering balance. Gold offers stability, protection, and reliability, while crypto delivers speed, opportunity, and growth potential. By understanding their unique behaviors, applying suitable strategies, and maintaining strong risk management, traders can navigate any market environment with confidence.
In a world where financial markets evolve rapidly, the ability to trade both gold and crypto effectively is a powerful skill—bridging the past, present, and future of global trading.

XAUUSD (Gold) 15TF Technical Outlook - 22/12/2025 XAU/USD (Gold) maintains a strong bullish structure, with price trading near 4415–4420 and holding firmly above all major moving averages, confirming trend continuation. The primary BUY zone lies at 4410–4408, which is the key pivot, EMA cluster, and decision level for intraday and positional bulls. As long as price sustains above this buy zone, upside momentum remains intact, opening targets toward 4425, 4440, and the extended resistance area of 4460–4480.
On the bearish side, short-term selling pressure or profit booking may emerge near 4425–4440, but this remains corrective in nature. The key BEAR trigger level is below 4400, and stronger bearish confirmation appears only if gold breaks and sustains below 4385–4380, where the bullish structure weakens. A decisive breakdown below these levels could drag price toward 4360–4350, while a complete trend reversal is expected only below 4300. Overall, the market favors buy-on-dips above 4408, with bears gaining control strictly below 4380.

NIFTY- Intraday Levels - 23rd December 2025*Expiry day* If NIFTY sustain above 26179/26207/225/32 above this bullish then if opens gapup or has to break in a big spike then only we can hope to see above level above this wait more levels marked on chart
If NIFTY sustain below 26159 below this bearish then 26117/09 or 26091 below this more bearish then 26031/26011 below this wait more levels marked on chart
Consider some buffer points in above levels.
Please do your due diligence before trading or investment.
**Disclaimer -
I am not a SEBI registered analyst or advisor. I does not represent or endorse the accuracy or reliability of any information, conversation, or content. Stock trading is inherently risky and the users agree to assume complete and full responsibility for the outcomes of all trading decisions that they make, including but not limited to loss of capital. None of these communications should be construed as an offer to buy or sell securities, nor advice to do so. The users understands and acknowledges that there is a very high risk involved in trading securities. By using this information, the user agrees that use of this information is entirely at their own risk.
Thank you.

Option Trading Strategies Why Options Are Popular
Options are favored because they:
require less capital
offer flexible strategies
allow profit in any market direction
provide hedging against losses
support weekly/monthly income
They transform trading from simple buying and selling to strategic decision-making.

POWRX/USDT (Crypto Setup)
POWRX/USDT is showing bullish continuation strength, indicating a potential upside breakout. A Buy Stop is placed at 0.08373, confirming entry only after price acceptance above resistance. The first upside objective is 0.08463, followed by an extended target at 0.08573, where partial or full profit booking can be considered. The trade remains valid as long as price holds above the defined risk level, with a stop loss at 0.08237 to protect capital in case of a failed breakout. This setup aligns with momentum-based continuation and favors disciplined risk management.
⚠️ Disclaimer:
This analysis is for educational and informational purposes only and does not constitute financial advice. Crypto markets are highly volatile and involve substantial risk. Please do your own research (DYOR) and consult a financial advisor if needed. The author is not responsible for any profit or loss arising from the use of this information.

BSE LTD Intraday 22 Dec 2025— +80 Points Bull Setup (BTR)HURRY! Another high-probability intraday trade completed successfully in BSE LTD.
No complexity. No overthinking. Only one rule — Follow BTR Indicator.
🔍 Trade Snapshot
• Stock: BSE LTD
• Date: 22/12/2025
• Timeframe: Intraday
• Indicator Used: BTR Indicator ONLY
🟢 Trade Execution
✔ BTR Indicator generated a clear BUY signal
✔ Entry provided exactly at 2700
✔ Strong bullish momentum followed immediately
🟢 BUY ENTRY: 2700
🎯 Exit Discipline
📌 Follow the system — not emotions
📌 Exit planned and executed as per BTR logic
🔴 INTRADAY EXIT: 2780
📈 TOTAL PROFIT: +80 POINTS
🧠 Strategy Rule (Very Important)
❌ No extra indicators
❌ No noise
❌ No prediction
✅ Only BTR Indicator
✅ Follow the signal
✅ Book profit when system says EXIT
🧠 Strategy Rule (Very Important)
❌ No extra indicators
❌ No noise
❌ No prediction
✅ Only BTR Indicator
✅ Follow the signal
✅ Book profit when system says EXIT
📊 Follow for more high-accuracy intraday setups
💬 Comment if you want to trade using BTR Indicator

Part 11 Trading Master Class Why Trade Options?
1. Leverage
A small premium controls a larger value of the underlying asset.
Example:
₹10,000 stock lot value vs. ₹500 premium.
2. Hedging
Used like insurance.
Example:
A portfolio hedge using puts protects from downturns.
3. Income Generation
Selling options, like covered calls and cash-secured puts, generates steady premium income.
4. Speculation
Traders can bet on:
direction
volatility
time decay
with limited capital.

Part 10 Trade Like Institutions The Premium and How It Works
To acquire an option, the buyer pays a premium to the seller (writer).
Premium is determined by:
underlying price
strike price
time to expiration
volatility
interest rates
For buyers:
Maximum loss = premium paid
Potential profit = high, theoretically unlimited for calls
For sellers (writers):
Maximum profit = premium received
Potential loss = very large or unlimited
This imbalance is why selling options requires margin and expertise.

Part 9 Trading Master Class1. Call Options
A call option gives the holder the right to buy an asset at a fixed strike price before expiry.
Call buyers profit when prices rise.
For example, if a stock is ₹1,000 and you buy a call with a strike of ₹1,050, expecting prices to climb.
If at expiry the price exceeds ₹1,050, the call becomes profitable.
2. Put Options
A put option gives the holder the right to sell an asset at a fixed strike price before expiry.
Put buyers profit when prices fall.
Example: A stock trading at ₹1,000, you buy a put at ₹950 expecting decline.
If the stock falls below ₹950, the put becomes valuable.
Call = bullish
Put = bearish

Part 8 Trading Master Class What Are Options?
Options are financial contracts that give the buyer the right, but not the obligation, to buy or sell an asset at a predetermined price within a specified time. Unlike stocks, where ownership is direct, options merely provide conditional access to ownership. This feature allows traders to profit from price movements without tying up large capital.
The predetermined price is known as the strike price, and the final expiry date is known as the expiration date.
The underlying assets can include:
Stocks
Exchange-traded funds (ETFs)
Stock indices like NIFTY or S&P 500
Commodities like gold, oil
Currencies

ABSLAMC 1 Day Time Frame 📍 Current Price (approx): ~ ₹760–₹770 (prices vary during the trading session; last reported close ~₹760–₹780 range).
📊 1‑Day (Intraday) Pivot & Key Levels
Daily Pivot (Reference Level):
• Pivot Point: ~ ₹741.4–₹742
Resistance Levels (Upside):
• R1: ~ ₹751.8–₹752
• R2: ~ ₹768–₹769
• R3: ~ ₹778–₹780
Support Levels (Downside):
• S1: ~ ₹724.8–₹725
• S2: ~ ₹714–₹715
• S3: ~ ₹697–₹700
📌 How to Use These 1‑Day Levels
Bullish / Upside View:
Above pivot (~₹742): Upside momentum likely; first target near R1 ~₹752.
Break above R2 (~₹768) can see extension to R3 (~₹778–₹780).
Bearish / Downside View:
Below pivot (~₹742): Price weakness; watch S1 (~₹725) and S2 (~₹714) as key support zones.
Breakdown below S2 could lead toward S3 (~₹697).

PFC 1 Day Time Frame 📊 Daily Pivot Levels
Pivot Point (Daily): ~₹343.00–₹343.30
Central Pivot (CPR):
• Top: ₹343.60
• Mid: ₹343.00
• Bottom: ₹342.40
📈 Resistance Levels (Daily)
R1: ~₹344–₹346
R2: ~₹347–₹348
R3: ~₹350–₹351
📉 Support Levels (Daily)
S1: ~₹338–₹341 (minor support)
S2: ~₹335–₹337
S3: ~₹332–₹334
🔍 Intraday Range to Watch
Near‑term range: ₹337–₹354, with crucial rejection/resume zones at ~₹337 (support) and ~₹352–₹354 (upper resistance).
📌 How to Use These Levels
Bullish breakout: Sustained close above the pivot ~₹343 with volume could target R1 → R2 (~₹347–₹350).
Bearish continuation: Failure below S1 (~₹338–₹341) increases odds of a drop toward S2/S3 (~₹335 / ₹332).
Pivot flips: Pivot pivots often act as support if price stays above, and as resistance if below.

A Complete Guide to High-Speed Intraday TradingScalping Bank Nifty is one of the most popular intraday trading approaches in the Indian stock market. Bank Nifty, being a highly volatile index comprising major banking stocks, offers frequent price movements that attract short-term traders. Scalping focuses on capturing small but consistent profits by entering and exiting trades within minutes, sometimes even seconds. This strategy demands discipline, speed, and a deep understanding of market behavior.
Understanding Bank Nifty Scalping
Bank Nifty scalping is a form of intraday trading where traders aim to profit from small price fluctuations during market hours. Unlike positional or swing trading, scalping does not rely on large trends. Instead, it capitalizes on momentum bursts, liquidity zones, and short-term imbalances between buyers and sellers. Because Bank Nifty has high volume and tight bid-ask spreads, it is well-suited for this approach.
Scalpers usually trade Bank Nifty futures or options, especially weekly options, due to their liquidity and fast price movements. The goal is not to catch the entire move but to take a small portion repeatedly throughout the day.
Why Bank Nifty Is Ideal for Scalping
Bank Nifty stands out for scalping due to its volatility and responsiveness to market news, interest rate expectations, and global cues. Banking stocks react quickly to changes in bond yields, RBI announcements, and global financial trends. This creates sharp intraday moves, which are ideal for scalpers.
Another reason is liquidity. High liquidity ensures smooth order execution with minimal slippage, which is crucial when trades last only a few minutes. Scalping depends heavily on precision, and Bank Nifty provides that environment better than many other indices.
Time Frames Used in Bank Nifty Scalping
Scalpers typically use very small time frames such as 1-minute, 3-minute, or 5-minute charts. These charts help identify quick entry and exit points. Higher time frames like 15-minute or 30-minute charts are often used only to understand the broader intraday trend or key support and resistance levels.
The opening hour of the market (9:15 AM to 10:30 AM) is especially important for Bank Nifty scalping, as volatility and volume are usually highest during this period. The last hour of trading can also offer good scalping opportunities.
Key Indicators for Bank Nifty Scalping
Scalping relies on a limited number of fast-reacting indicators rather than complex setups. Commonly used indicators include moving averages such as 9 EMA and 20 EMA, which help identify short-term trend direction. When price stays above these averages, scalpers look for buy setups; when below, sell setups are preferred.
Other popular tools include VWAP (Volume Weighted Average Price), which acts as an intraday equilibrium level. Price behavior around VWAP often provides high-probability scalping trades. Oscillators like RSI or Stochastic are also used to spot short-term overbought or oversold conditions, but they must be interpreted carefully in fast markets.
Support and Resistance in Scalping
Support and resistance levels play a critical role in Bank Nifty scalping. These levels can be derived from previous day high and low, opening range, pivot points, or round numbers. Scalpers look for quick reversals or breakouts at these zones.
For example, if Bank Nifty approaches a strong resistance level with weakening momentum, a short scalp may be planned with a tight stop-loss. Conversely, a clean breakout with volume can offer a momentum scalp in the direction of the breakout.
Role of Price Action
Price action is the backbone of successful scalping. Candlestick patterns such as inside bars, pin bars, and strong momentum candles help scalpers read market intent. Instead of predicting, scalpers react to what price is doing in real time.
In Bank Nifty, fake breakouts and sudden spikes are common. Reading price action helps traders avoid traps and align with institutional moves. Scalping is less about being right and more about managing risk while following price behavior.
Risk Management in Bank Nifty Scalping
Risk management is the most important aspect of scalping. Since scalpers take multiple trades in a single session, even small losses can accumulate quickly if not controlled. A strict stop-loss is non-negotiable. Most scalpers risk a very small portion of their capital on each trade.
Risk-reward ratios in scalping are usually modest, such as 1:1 or 1:1.5, but consistency matters more than large wins. Overtrading, revenge trading, and increasing position size after losses are common mistakes that must be avoided.
Psychology and Discipline
Scalping Bank Nifty is mentally demanding. Traders must make quick decisions and accept frequent small losses as part of the process. Emotional control is essential, as hesitation or fear can lead to missed entries or poor exits.
Discipline in following a predefined trading plan separates successful scalpers from unsuccessful ones. Patience is required to wait for high-probability setups, even though opportunities appear frequently. Scalping is not about trading all the time, but about trading the right moments.
Common Mistakes to Avoid
One common mistake is trading without a clear setup. Because Bank Nifty moves fast, beginners often enter trades impulsively. Another mistake is ignoring market conditions. On low-volatility or range-bound days, scalping becomes more challenging and requires adjusted expectations.
Using excessive leverage is also risky. While leverage can amplify profits, it can magnify losses even faster. Successful scalpers focus on longevity and capital protection rather than chasing quick money.
Conclusion
Scalping Bank Nifty is a powerful intraday trading strategy for those who understand market structure, price action, and risk management. It offers frequent opportunities but demands high discipline, focus, and emotional control. With the right mindset, proper tools, and consistent practice, traders can develop a structured approach to Bank Nifty scalping.
However, scalping is not suitable for everyone. It requires screen time, quick execution, and the ability to handle pressure. For traders willing to invest time in learning and refining their skills, Bank Nifty scalping can become a consistent and rewarding trading style in the Indian stock market.

Meme Stocks in the Indian Market: Hype, Psychology, and Trading What Are Meme Stocks?
Meme stocks are equities that experience sharp price movements primarily due to hype and mass participation rather than changes in business fundamentals. These stocks gain popularity through platforms such as Twitter (X), Telegram channels, YouTube, WhatsApp groups, Reddit-style forums, and trading communities. The narrative around a meme stock is often simple and emotionally appealing: “This stock will go to the moon,” “Shorts will be trapped,” or “Big operators are accumulating.” Such narratives spread rapidly, creating a self-reinforcing cycle of buying pressure.
In India, meme stocks often emerge from small-cap and mid-cap segments where liquidity is limited and price manipulation is easier. A sudden surge in volume, combined with social media promotion, can push prices sharply upward within days or even hours.
Why Meme Stocks Thrive in India
Several structural and behavioral factors make the Indian market fertile ground for meme stocks:
Retail Investor Boom
India has seen an explosion in new demat accounts over the last few years. Many first-time investors enter markets with limited financial education and are attracted to fast-moving stocks promising quick profits.
Low-Cost Trading Platforms
Discount brokerages and mobile trading apps have reduced entry barriers. Easy access encourages frequent trading, speculation, and herd behavior.
Social Media Influence
Telegram tips, YouTube “multibagger” videos, and Twitter threads play a massive role in shaping opinions. Stocks trending online often see immediate price action.
Small Float Stocks
Many Indian meme stocks have low public shareholding. Even modest buying pressure can result in significant price spikes.
Lack of Short Selling Culture
Unlike US markets, short selling participation by retail traders in India is limited. This changes the dynamics of meme stocks—price rises are often driven by momentum buying rather than short squeezes alone.
Characteristics of Indian Meme Stocks
Indian meme stocks typically display a recognizable set of features. They show sudden volume spikes without major news, hit upper circuits repeatedly, and attract aggressive participation from retail traders. Valuations often disconnect from earnings, balance sheets, and sector realities. Promoters or operators may remain silent while prices move sharply, adding to mystery and speculation.
Another key trait is extreme volatility. A stock can double or triple within weeks, followed by equally sharp corrections. This makes meme stocks attractive for traders but dangerous for long-term investors who mistake hype for value.
Role of Operators and Smart Money
In India, meme stocks are often associated with operator-driven activity. Operators accumulate shares quietly, then use narratives and social media amplification to attract retail buying. Once liquidity increases and prices peak, distribution begins. Retail investors who enter late often get trapped when the stock hits lower circuits during the exit phase.
This does not mean every fast-rising stock is manipulated, but meme stocks are especially vulnerable to such cycles. Understanding this dynamic is crucial for anyone trading them.
Trading Meme Stocks: Opportunities and Risks
For skilled traders, meme stocks can offer significant short-term opportunities. Momentum trading, breakout strategies, and volume-based setups can work well if risk is tightly controlled. Traders focus more on price action, circuit behavior, and order flow rather than financial statements.
However, the risks are equally high. Liquidity can vanish suddenly, leaving traders unable to exit positions. Regulatory actions, surveillance measures, or sudden sentiment shifts can cause steep falls. Emotional decision-making—fear of missing out (FOMO) during rallies and panic during crashes—often leads to losses.
Risk management is non-negotiable when dealing with meme stocks. Position sizing, predefined stop-losses, and strict discipline are essential tools for survival.
Meme Stocks vs Fundamental Investing
One of the biggest mistakes retail participants make is confusing meme stocks with genuine multibagger opportunities. A fundamentally strong company may also become popular online, but its long-term value is supported by earnings growth, cash flows, and competitive advantage. Meme stocks, on the other hand, rely heavily on attention and sentiment.
In the Indian context, many investors buy meme stocks with a long-term mindset, hoping for life-changing returns, only to face sharp drawdowns when hype fades. Distinguishing between narrative-driven price action and business-driven growth is a critical skill.
Regulatory Perspective in India
Indian market regulators closely monitor unusual price and volume movements. Stocks showing abnormal activity may be placed under surveillance measures such as ASM (Additional Surveillance Measure) or GSM (Graded Surveillance Measure). These mechanisms increase margin requirements, restrict intraday trading, or impose price bands, which often cool down meme-driven rallies.
While regulation aims to protect investors, it can also accelerate corrections in meme stocks, catching unprepared traders off guard.
Psychological Aspect of Meme Stock Trading
Meme stocks are a live demonstration of behavioral finance. Greed, fear, herd mentality, and confirmation bias dominate decision-making. Traders often seek information that confirms bullish views while ignoring risks. Social validation—seeing others post profits—amplifies confidence and reduces caution.
Successful traders approach meme stocks with emotional detachment. They treat them as short-term instruments, not beliefs or communities.
Future of Meme Stocks in India
Meme stocks are unlikely to disappear from Indian markets. As long as social media, easy trading access, and retail participation continue to grow, hype-driven stocks will remain part of market cycles. However, awareness is also increasing. Many traders are becoming more educated, selective, and risk-conscious.
Over time, the market may see fewer extreme bubbles, but rapid momentum-driven moves will still occur, especially during bullish phases.
Conclusion
Meme stocks in the Indian market represent a powerful blend of technology, psychology, and market structure. They offer high-risk, high-reward opportunities but demand a disciplined and informed approach. For traders, meme stocks can be vehicles for momentum-based strategies if risk is controlled. For investors, they serve as a reminder that popularity does not equal value.
Understanding meme stocks is not about chasing hype—it is about recognizing market behavior, managing emotions, and respecting risk. In the long run, survival and consistency matter far more than viral gains.

Algorithmic Trading for Retail InvestorsA Complete Beginner-to-Advanced Guide
Algorithmic trading, often called algo trading, is no longer limited to hedge funds and large institutions. With advancements in technology, affordable platforms, and access to market data, retail investors can now design, test, and deploy trading algorithms from their homes. Algorithmic trading involves using predefined rules, coded into software, to automatically execute trades based on market conditions. These rules can be based on price, volume, timing, technical indicators, or even news and sentiment data.
What Is Algorithmic Trading?
At its core, algorithmic trading is about automation and discipline. Instead of manually placing trades based on emotions or guesswork, an algorithm follows a structured set of instructions. For example, an algorithm may be programmed to buy a stock when its 20-day moving average crosses above its 50-day moving average and sell when the opposite occurs. Once deployed, the system monitors the market continuously and executes trades instantly when conditions are met.
For retail investors, this removes emotional bias, reduces execution delays, and allows consistent application of a strategy across different market conditions.
Why Algorithmic Trading Is Attractive for Retail Investors
One of the biggest advantages of algo trading is emotion-free decision-making. Fear and greed are common reasons retail traders fail. Algorithms strictly follow logic and predefined rules, preventing impulsive decisions during market volatility.
Another key benefit is speed and efficiency. Algorithms can analyze thousands of data points and place trades in milliseconds—something impossible for manual traders. Even for non-high-frequency strategies, this speed ensures better entry and exit prices.
Algo trading also enables backtesting, which allows retail investors to test strategies on historical data before risking real money. This helps identify strengths, weaknesses, drawdowns, and profitability potential.
Finally, algorithms offer scalability. A single trader can run multiple strategies across different stocks, indices, commodities, or cryptocurrencies simultaneously.
Common Algorithmic Trading Strategies for Retail Investors
Retail-friendly algorithmic strategies are usually simpler and focus on consistency rather than ultra-high speed.
Trend-following strategies are among the most popular. These include moving average crossovers, breakout strategies, and momentum-based systems. They aim to capture sustained price movements rather than predict tops or bottoms.
Mean reversion strategies assume prices revert to their average over time. Algorithms identify overbought or oversold conditions using indicators like RSI or Bollinger Bands and trade accordingly.
Arbitrage strategies, though more competitive today, attempt to exploit small price differences between related instruments, such as cash and futures or correlated stocks.
Intraday time-based strategies are also popular among retail investors. These algorithms trade at specific times—such as market open or close—when volatility and liquidity are higher.
Technology Stack Required for Retail Algo Trading
To start algorithmic trading, retail investors need a basic technology setup. This includes:
Market data (real-time or historical)
Trading platform or broker API
Programming environment
Backtesting engine
Execution and risk management module
Programming languages like Python are widely used due to their simplicity and powerful libraries such as Pandas, NumPy, TA-Lib, and Backtrader. Some platforms also offer no-code or low-code solutions where strategies can be built using visual interfaces.
Broker APIs allow algorithms to place orders automatically. In India, many brokers now support API trading, making algo trading more accessible than ever.
Backtesting and Strategy Validation
Backtesting is one of the most critical steps in algorithmic trading. It involves applying your strategy to historical data to evaluate how it would have performed in the past. Retail investors must be cautious of overfitting, where a strategy performs well on historical data but fails in live markets.
A robust backtest should include:
Transaction costs and slippage
Realistic execution assumptions
Multiple market cycles
Out-of-sample testing
Paper trading or simulated trading is often used after backtesting to test the algorithm in real-time market conditions without risking capital.
Risk Management in Algorithmic Trading
Risk management is what separates sustainable algo traders from gamblers. Algorithms should always include predefined risk controls such as:
Maximum loss per trade
Daily loss limits
Position sizing rules
Stop-loss and take-profit levels
Retail investors should avoid deploying algorithms with aggressive leverage or unrealistic return expectations. Consistency and capital preservation are more important than high returns.
Challenges Faced by Retail Algo Traders
Despite its advantages, algorithmic trading is not without challenges. Technical failures such as internet outages, API errors, or software bugs can cause unexpected losses. Market conditions also change, and a strategy that worked in the past may stop performing.
Another major challenge is competition. Institutional players have access to superior infrastructure and data. Retail investors must focus on niche strategies, longer timeframes, or less crowded markets to stay competitive.
Regulatory compliance is also important. Retail investors must ensure their trading activities comply with exchange and broker regulations.
Psychology and Discipline in Algo Trading
Even though trading decisions are automated, psychology still plays a role. Retail investors often interfere with algorithms during drawdowns, turning off systems prematurely or changing rules frequently. Successful algo traders trust their data, follow predefined evaluation periods, and make changes based on evidence—not emotions.
Future of Algorithmic Trading for Retail Investors
The future of algorithmic trading is increasingly retail-friendly. Cloud computing, AI-driven analytics, machine learning models, and broker-supported APIs are lowering entry barriers. Retail investors are also gaining access to alternative data such as sentiment analysis and macroeconomic indicators.
However, success will continue to depend on education, discipline, and risk control, not on complex algorithms alone.
Conclusion
Algorithmic trading offers retail investors a powerful way to participate in financial markets with discipline, speed, and consistency. While it does not guarantee profits, it provides a structured framework that reduces emotional decision-making and enhances efficiency. By starting with simple strategies, focusing on robust backtesting, and prioritizing risk management, retail investors can gradually build sustainable algorithmic trading systems. In an increasingly automated market, learning algorithmic trading is no longer optional—it is a valuable skill that can redefine how retail investors trade and invest.

NIFTY- Intraday Levels - 22nd December 2025Not confident on levels today... I think if it opens gapup and comes around 26150 some profit booking may come. If it opens above then this may not be valid.
If NIFTY sustain above 26021 above this bullish then around 26121/35/79 above this more bullish 26231/55 above this wait more levels marked on chart
If NIFTY sustain below 25930 below this bearish then 25764 below this more bearish then 25884/74 below this wait more levels marked on chart
Consider some buffer points in above levels.
Please do your due diligence before trading or investment.
**Disclaimer -
I am not a SEBI registered analyst or advisor. I does not represent or endorse the accuracy or reliability of any information, conversation, or content. Stock trading is inherently risky and the users agree to assume complete and full responsibility for the outcomes of all trading decisions that they make, including but not limited to loss of capital. None of these communications should be construed as an offer to buy or sell securities, nor advice to do so. The users understands and acknowledges that there is a very high risk involved in trading securities. By using this information, the user agrees that use of this information is entirely at their own risk.
Thank you.

#Nifty Weekly 22-12-25 to 26-12-25#Nifty Weekly 22-12-25 to 26-12-25
Nifty managed to close above the trendline which is holding the current downtrend.
If Nifty sustains above 26100, XABCD activates and targets are 26250/26400 on upside.
Short level is only below 25780.
View: Sideways to bullish.

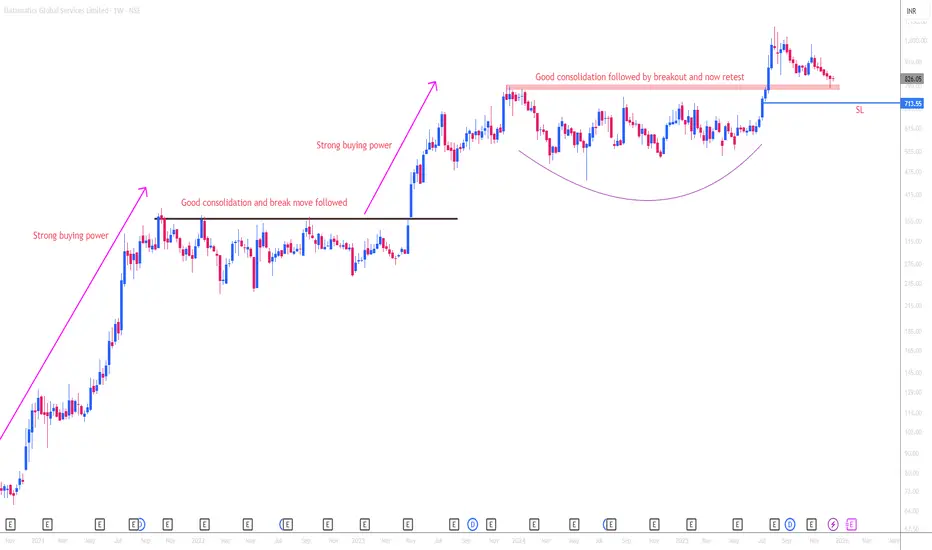
DATAMATCIS GLOBAL SERVICE LIMITED ANALYSISTHIS IS MY CHART OF THE WEEK PICK
FOR LEARNING PURPOSE
DATAMATICS GLOBAL SERVICE LTD- The current price of DATAMATICS is 826.05 rupees
I am going to buy this stock because of the reasons as follows-
1. It's retesting the zone which acted as a good resistance in 2023. Before it acted as resistance and now it should act as some support.
2. This stock has seen some great buying since 2021. It has consolidated in between and continued it's run.
It has got time correction which was required.
3. It is showing better relative strength as it stood strong in volatile times including last few weeks.
4. The risk and reward is favourable.
5. The stock is one of the outperformers in this market. The structure is great as of now. It has also outperformed it's sector.
6. Another good part- The overall sector has shown some decent strength and have good momentum.
I am expecting more from this in coming weeks.
I will buy it with minimum target of 35-40% and then will trail after that.
My SL is at 713.55 rupees.
I will be managing my risk.
Part 7 Tading Mater Class Option Trading vs Stock Trading
Compared to stock trading, option trading is more versatile but also more demanding. Stock trading typically benefits from long-term price appreciation, whereas options are time-bound instruments. Options can outperform stocks in short-term, volatile, or sideways markets, but they require accurate timing and discipline.

Part 6 Learn Institutional Trading Risks in Option Trading
While options offer unique advantages, they also carry risks:
Time Decay: Options lose value as expiration approaches, especially for buyers.
Complexity: Advanced strategies require deep understanding and precise execution.
Unlimited Loss Potential: Some option selling strategies can result in very large losses.
Liquidity Risk: Not all options have sufficient trading volume.
