Part 2 Intraday Trading Master ClassNon-Directional (Range-Bound) Strategies
These strategies profit when the market does not move much.
Short Straddle Strategy
Concept: Sell Call + Sell Put at same strike.
Profit: Premium received
Risk: Unlimited
Best Market Condition: Low volatility, sideways market
Use Case:
When expecting very low movement, typically before event expiry.
Warning:
High-risk strategy, requires strict risk management.
Harmonic Patterns

Part 1 Intraday Trading Master Class Covered Call Strategy (Moderately Bullish)
Concept: Hold shares and sell a call option.
Profit: Limited
Risk: Stock downside risk remains
Best Market Condition: Mild uptrend or sideways
Use Case:
Ideal for long-term investors to earn regular income.

XAUUSD | 15M | SMC PerspectivePrice has delivered a strong bearish displacement, confirming short-term market structure shift to the downside. The recent impulse left behind a clean bearish order block / supply zone, which is now acting as premium territory.
Current price is reacting from discount and may attempt a pullback into the marked supply zone for mitigation. That zone is the key decision area.
Plan:
Expect a retracement into supply
Look for LTF confirmation only inside the zone
Rejection from supply should open the path toward the liquidity pool near 4257, which aligns with prior lows and equal lows resting liquidity
Bias: Bearish
Execution rule: Entry will be taken only if LTF aligns with HTF bearish expectation

Short-Term Trading vs. Long-Term Trading1. Time Horizon
Short-Term Trading:
Focuses on quick market moves. Trades last from a few minutes to a few days or weeks. The goal is to profit from immediate price fluctuations.
Long-Term Trading:
Built on patience. Positions are held for months, years, or even decades to benefit from long-term growth and compounding.
2. Core Objective
Short-Term Trading:
Capture small but frequent profits by exploiting volatility, momentum, and short-lived opportunities.
Long-Term Trading:
Build wealth steadily by participating in the long-term growth of businesses, sectors, or economies.
3. Analysis Style
Short-Term Trading:
Heavily dependent on technical analysis
Uses charts, patterns, indicators, volume, and price action
News and sentiment play a major role
Long-Term Trading:
Primarily driven by fundamental analysis
Focuses on earnings, growth potential, balance sheets, management quality, and industry trends
4. Market Noise vs. Market Value
Short-Term Trading:
Thrives on market noise. Small price movements and emotional reactions create trading opportunities.
Long-Term Trading:
Ignores daily noise. Concentrates on intrinsic value and long-term business strength.
5. Risk and Reward Profile
Short-Term Trading:
Higher risk per trade due to volatility
Risk is actively controlled through stop-losses
Frequent wins and losses
Long-Term Trading:
Lower day-to-day risk perception
Exposed to economic cycles and structural changes
Fewer decisions, but higher conviction required
6. Capital and Leverage
Short-Term Trading:
Often uses leverage to amplify small moves
Requires strict money management to avoid large drawdowns
Long-Term Trading:
Generally unleveraged
Capital grows through appreciation, dividends, and compounding
7. Emotional and Psychological Demand
Short-Term Trading:
Mentally intense and emotionally challenging
Requires fast decision-making and strong emotional control
Fear and greed must be managed daily
Long-Term Trading:
Emotionally calmer but tests patience
Requires discipline during market crashes and rallies
Conviction matters more than speed
8. Time Commitment
Short-Term Trading:
High time involvement
Needs constant monitoring during market hours
Can feel like a full-time profession
Long-Term Trading:
Low time involvement
Periodic review and rebalancing
Suitable for people with limited daily time
9. Cost and Tax Impact
Short-Term Trading:
Higher brokerage, transaction costs, and taxes
Profits can be reduced if costs are not controlled
Long-Term Trading:
Lower transaction frequency
Often more tax-efficient
Better net returns over time
10. Learning Curve
Short-Term Trading:
Steep learning curve
Requires backtesting, journaling, and continuous improvement
Long-Term Trading:
Gradual learning process
Emphasis on understanding businesses and macro trends
11. Lifestyle Compatibility
Short-Term Trading:
Best suited for active individuals who enjoy fast-paced environments
Requires focus, routine, and discipline
Long-Term Trading:
Ideal for those seeking financial growth alongside career or business
Less stress, more freedom
12. Wealth Creation Potential
Short-Term Trading:
Income-oriented approach
Success depends on consistency and risk control
Long-Term Trading:
Wealth-oriented approach
Compounding is the biggest advantage
13. Who Should Choose What?
Choose Short-Term Trading if you:
Enjoy active market participation
Can manage stress and emotions
Have time to monitor markets daily
Choose Long-Term Trading if you:
Believe in patience and compounding
Prefer stability over excitement
Want to grow wealth with minimal daily involvement
Final Takeaway
Short-term trading is about skill, speed, and discipline.
Long-term trading is about patience, conviction, and compounding.

Positional Trading vs. Swing Trading in the Indian MarketUnderstanding Positional Trading
Positional trading is a medium- to long-term trading style where traders hold positions for several weeks to a few months. The goal is to benefit from a larger directional move driven by strong trends, fundamental changes, or long-term technical breakouts.
In the Indian market, positional traders often focus on:
Strong sectoral themes (banking, IT, pharma, PSU, metals)
Macroeconomic trends (interest rates, inflation, GDP growth)
Company fundamentals (earnings growth, balance sheet strength)
Long-term technical structures on weekly or monthly charts
For example, a positional trader may buy a banking stock when interest rate cuts are expected and hold it for three to six months as the sector re-rates.
Key Characteristics of Positional Trading:
Holding period: Weeks to months
Charts used: Daily, weekly, monthly
Trade frequency: Low
Stop loss: Wider
Target size: Large
Stress level: Comparatively low
Positional traders are less affected by daily market noise. Short-term volatility caused by global cues or intraday news does not usually force them out of trades unless the broader trend changes.
Understanding Swing Trading
Swing trading is a short- to medium-term strategy where traders aim to capture price swings within a trend. Positions are usually held from a few days to a few weeks. Swing traders actively trade market fluctuations and are more sensitive to technical signals.
In the Indian market, swing trading is extremely popular because:
Volatility is high, especially in mid-cap and small-cap stocks
Weekly option expiry cycles create frequent momentum
Retail participation leads to sharp price swings
Technical patterns work well on short time frames
Swing traders typically rely on:
Support and resistance levels
Chart patterns (flags, triangles, double tops/bottoms)
Indicators like RSI, MACD, moving averages
Volume and price action
For instance, a swing trader may buy a stock near a strong support level after a pullback and exit within 5–10 days once resistance is reached.
Key Characteristics of Swing Trading:
Holding period: 2 days to 2–3 weeks
Charts used: Hourly, 4-hour, daily
Trade frequency: Moderate to high
Stop loss: Tight
Target size: Moderate
Stress level: Higher than positional trading
Swing trading requires regular monitoring of positions and quick decision-making.
Time Commitment and Lifestyle Differences
One of the biggest differences between positional and swing trading in India is time involvement.
Positional trading is suitable for working professionals, business owners, or investors who cannot watch markets daily. Once a trade is planned, only periodic review is required.
Swing trading demands more screen time. Traders must track price movements, adjust stop losses, and respond to market changes, especially around events like RBI policy announcements or global market moves.
If you can spend only limited time on markets, positional trading is often more practical.
Risk Management and Capital Requirements
Risk management plays a crucial role in both styles, but it is applied differently.
Positional Trading Risk Profile:
Wider stop losses due to long-term volatility
Lower position size per trade
Fewer trades reduce transaction costs
Overnight and weekend gap risk exists
Swing Trading Risk Profile:
Tighter stop losses
Higher position turnover
More brokerage and taxes due to frequent trading
Lower gap risk due to shorter holding period
In the Indian context, where sudden news (budget announcements, election results, global market shocks) can cause gaps, positional traders must be mentally prepared for drawdowns.
Role of Fundamentals vs. Technicals
Positional traders give higher importance to fundamentals combined with technicals. They often enter trades only when both align.
Swing traders rely primarily on technical analysis. Fundamentals are secondary and mainly used to avoid weak stocks.
For example, a swing trader may trade a technically strong stock even if long-term fundamentals are average, whereas a positional trader may avoid it.
Impact of Indian Market Structure
The Indian market has some unique features that influence both styles:
Weekly and monthly F&O expiry increases short-term volatility (benefits swing traders)
High retail participation leads to emotional price swings
Sector rotation is frequent, creating positional opportunities
Global dependency (US markets, crude oil, dollar index) affects both styles differently
Swing traders often benefit from expiry-related momentum, while positional traders benefit from broader economic and sectoral trends.
Psychology and Discipline
Psychology is where many traders fail.
Positional trading psychology requires patience, conviction, and the ability to sit through temporary drawdowns.
Swing trading psychology demands quick execution, emotional control, and acceptance of frequent small losses.
In India, where social media tips and news-driven trading are common, swing traders are more prone to overtrading, while positional traders risk holding losing positions for too long.
Which Is Better for Indian Traders?
There is no universally “better” approach. The choice depends on:
Your time availability
Risk tolerance
Capital size
Personality and patience level
Market experience
Positional trading is better if you:
Prefer low-frequency trades
Have limited screen time
Believe in macro and sectoral trends
Can handle longer drawdowns
Swing trading is better if you:
Can actively monitor markets
Enjoy technical analysis
Prefer faster results
Are comfortable with frequent decision-making
Many successful Indian traders use a hybrid approach, combining positional trades in strong sectors with swing trades for short-term opportunities.
Conclusion
In the Indian market, both positional trading and swing trading offer excellent opportunities when applied correctly. Positional trading focuses on capturing big trends with patience and discipline, while swing trading aims to profit from short-term price movements with active involvement. Understanding your personality, market conditions, and risk management skills is more important than choosing one style over the other. Ultimately, consistency, discipline, and continuous learning determine success—regardless of whether you are a positional trader or a swing trader.
Divergence Secrets Long Put Strategy (Bearish)
Concept: Buy a put option expecting the price to fall.
Maximum Loss: Premium paid
Maximum Profit: Large (limited by zero price)
Best Market Condition: Strong downtrend
Use Case:
Used during market crashes, breakdowns, or negative news events.

XAUUSD GOLD Analysis on (16 Dec 2025)#XAUUSD UPDATEDE
Current price - 4287
Buy Limited - 4252-4236(Strong buy zone)
If price stay above 4218 then next target ,4300,4350 and 4380 and below that 4198
Plan;If price break 4252-4236 area,and stay above 4255,we will place buy order in gold with target of 4300,4350 and 4380 & stop loss should be placed at 4218

Option Trading Strategies Directional Option Trading Strategies
Directional strategies are used when the trader has a clear bullish or bearish view on the underlying asset.
Long Call Strategy (Bullish)
Concept: Buy a call option expecting the price to rise.
Maximum Loss: Premium paid
Maximum Profit: Unlimited
Best Market Condition: Strong uptrend
Use Case:
When you expect sharp upside movement with high momentum.
Risk:
If price does not move fast enough, time decay erodes option value.

ICICIBANK 1 Day Time Frame 📊 Current Live Price (approx): ₹1,364–1,365 on NSE as of this session.
🟢 Daily Pivot & Intraday Levels
(from pivot analysis)
Pivot Points (Standard / Daily):
Pivot: ~1363.8
Resistance 1 (R1): ~1371
Resistance 2 (R2): ~1377
Resistance 3 (R3): ~1385
Support Levels:
Support 1 (S1): ~1357
Support 2 (S2): ~1350
Support 3 (S3): ~1343
👉 Price staying above pivot ~1364 suggests slight short‑term strength; a break above R1 ~1371 could see extension toward ~1378–1385. Sustained breaks below S1/S2 may trigger momentum toward ~1350 or lower.

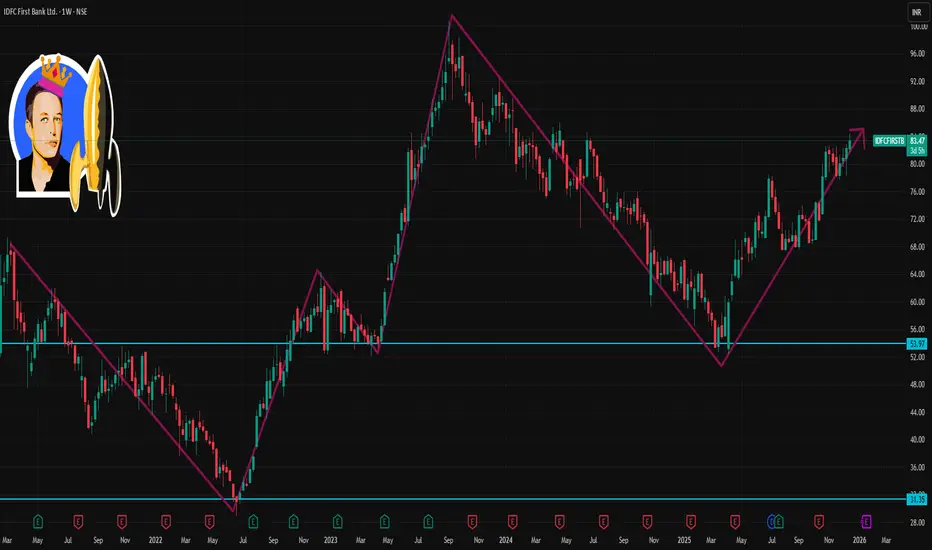
IDFCFIRSTB 1 Week Time Frame 📊 Weekly Support & Resistance Levels
Weekly Resistance Levels
R1: ~₹83.96 — immediate weekly resistance (key breakout level)
R2: ~₹85.63 — next major resistance
R3: ~₹88.44 — extended upside if trend is strong
Weekly Support Levels
S1: ~₹79.48 — first strong weekly support
S2: ~₹76.67 — secondary support zone
S3: ~₹75.00 — deeper support if weakness accelerates
Weekly Pivot (approx central point)
Around ₹81.15–₹81.72 based on weekly pivot analysis
📌 Key Reference Price Context
The stock is currently trading around ₹83‑₹84 on the NSE (Dec 16, 2025).
52‑week range is roughly ₹52.46 low to ~₹84.4 high; price is near its yearly peak.
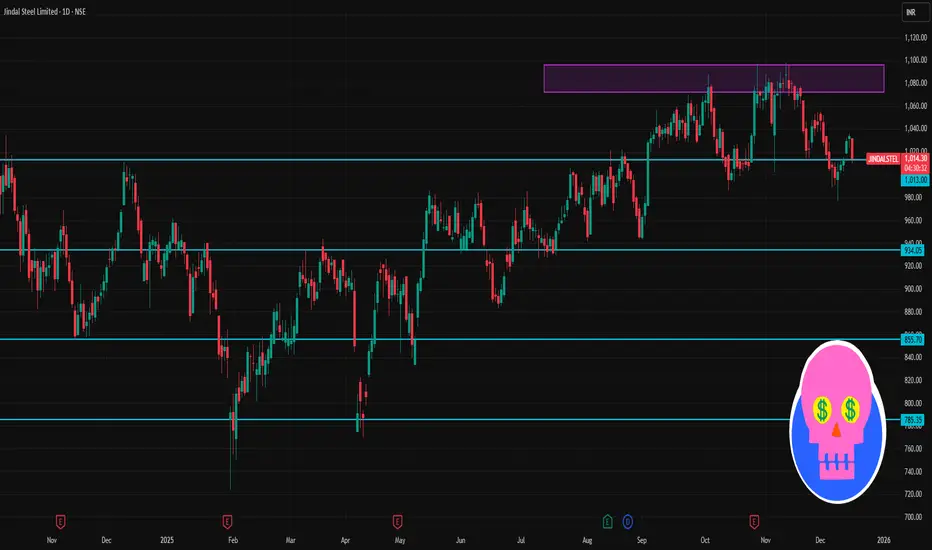
JINDALSTEL 1 Day Time Frame 📊 Daily Pivot & Key Levels
Pivot Point (Reference): ~₹1,010–₹1,010.27
(This is the central level where direction bias flips intraday.)
🔼 Resistance Levels
R1: ~₹1,017.9 – ₹1,018 📈
R2: ~₹1,022.9 – ₹1,041 📈
R3: ~₹1,030.6 – ₹1,049.9 📈
(Breaking and holding above these can signal bullish strength.)
🔽 Support Levels
S1: ~₹1,005.2 – ₹1,006.2 📉
S2: ~₹997.5 – ₹1,012 📉
S3: ~₹992.5 – ₹1,006 📉
(These act as downside cushions — watch for bounces or breakdowns.)
📈 Short‑Term Bias & Indicators
Moving Averages: Near current price, shorter and medium SMAs/EMAs are tight — indicating potential range trading unless breakout occurs.
RSI: Around neutral (~49), not strongly overbought/oversold.
📊 How Traders Use These
Bullish Scenario: Price sustaining above Pivot → target R1 ➜ R2 ➜ R3.
Bearish Scenario: Price breaking below Pivot → test S1 ➜ S2 ➜ S3.
Range Trades: Buy near supports with stop just below; sell near resistance with stop just above.
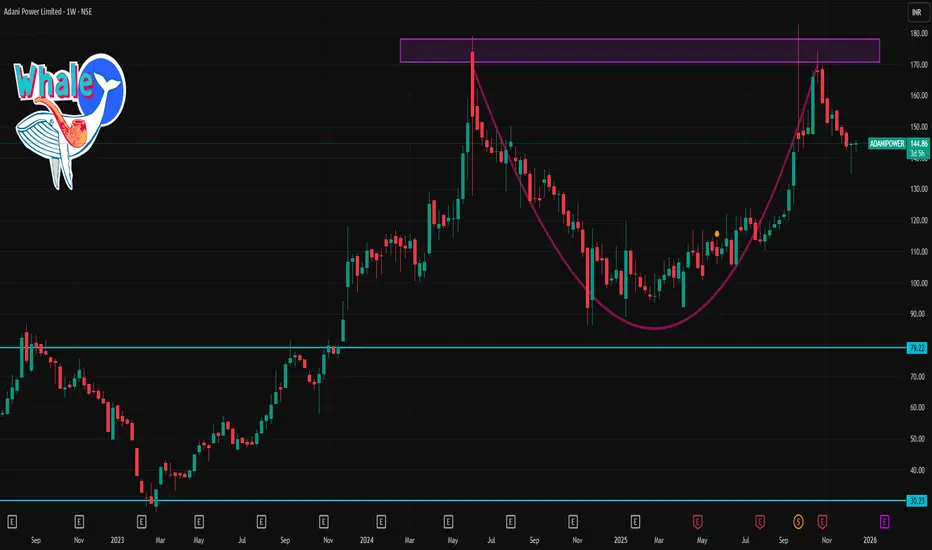
ADANIPOWER 1 Week Time Frame 📊 Current price context
• Share price is around ₹144–₹146 per share (as of latest session).
📈 Resistance Levels (Upside)
These are prices where the stock may face selling pressure or pause before further upmove:
1. ~₹147–₹149 — near short-term resistance cluster.
2. ~₹150–₹153 — pivot/fib resistance from short-term charts.
3. ~₹160–₹165/₹170 — higher target zone if bullish momentum strengthens.
➡️ If the price breaks above ₹150–₹153 with good volume, next upside could test ₹160+ over the week.
📉 Support Levels (Downside)
These are price zones that might act as demand zones if declines occur:
1. ~₹142–₹143 — immediate support from recent pivot levels.
2. ~₹140–₹139 — deeper support if weakness persists.
3. ₹135–₹134 (Lower) — secondary support seen in broader fib/pivot analysis.
➡️ A close below ₹142–₹140 could open the path toward ₹135+ on short-term weakness.
ASIANPAINT 1 Day Time Frame 📊 Current Trading Context (latest session data)
The stock today has traded between ₹2,746 and ₹2,797.
Latest price around ₹2,780–₹2,788 (price fluctuating intraday).
📈 Intraday Technical Levels (Daily Pivot-Style)
Resistance Levels (Upside):
R1: ₹2,792 – ₹2,793
R2: ₹2,820 – ₹2,821
R3: ₹2,844 – ₹2,846
(These are key zones where upside can stall)
Support Levels (Downside):
S1: ₹2,741 – ₹2,742
S2: ₹2,718 – ₹2,720
S3: ₹2,690 – ₹2,692
(These are key zones where price might find a floor)
📌 How to Use These Levels Today
Bullish scenario:
✔ Sustained move above ₹2,792–₹2,793 may target ₹2,820 and then ₹2,844.
Bearish scenario:
✔ Failure below ₹2,742 may push towards ₹2,720 and then ₹2,690.
Neutral / range:
✔ Between ₹2,742 and ₹2,792, expect sideways chop unless volume breaks out.

HDFCBANK 1 Day Time Frame 📌 Current Price Snapshot (recent data)
Approx. current price: ~₹995–₹1,002 on NSE intraday trading.
Day range seen recently: ~₹992–₹1,004.
📊 Daily Pivot / Support & Resistance Levels
🧮 Daily Pivot:
Pivot Point (PP): ~₹997-₹1,001
📈 Resistance Levels
R1: ~₹1,004-₹1,006
R2: ~₹1,007-₹1,011
R3: ~₹1,011-₹1,020 (stronger resistance near 1,020)
📉 Support Levels
S1: ~₹998-₹992
S2: ~₹994-₹986
S3: ~₹982-₹977
🧠 What This Means Now
The stock is currently trading near the pivot zone (~₹997-₹1,001) — a key short-term decision area.
Staying above pivot + R1 indicates short-term bullish bias; trading below pivot + S1 suggests bearish pressure.

Option Trading Strategies for Smart Market Participation1. What Are Option Trading Strategies?
Option trading strategies are planned combinations of call and put options.
They are designed to control risk, reduce cost, and improve probability.
Each strategy matches a specific market condition—bullish, bearish, neutral, or volatile.
The goal is not prediction, but risk-adjusted profitability.
2. Core Building Blocks of Options
Call Option: Profits when price moves upward.
Put Option: Profits when price moves downward.
Strike Price: Pre-decided buy/sell price.
Expiry Date: Time limit for the option.
Premium: Cost paid or received for the option.
3. Bullish Option Strategies (Rising Market)
Long Call
Buy a call option when expecting strong upside.
Risk is limited to premium; profit potential is unlimited.
Bull Call Spread
Buy lower strike call, sell higher strike call.
Lower cost and controlled risk with limited profit.
Cash-Secured Put
Sell put to earn premium while planning to buy stock at lower price.
4. Bearish Option Strategies (Falling Market)
Long Put
Buy put when expecting sharp downside.
Limited risk with high profit potential.
Bear Put Spread
Buy higher strike put, sell lower strike put.
Ideal for moderate downtrend with reduced cost.
Call Credit Spread
Sell call spread to benefit from falling or stagnant prices.
5. Sideways Market Strategies (Range-Bound Market)
Covered Call
Hold stock and sell call for regular income.
Iron Condor
Sell out-of-the-money call and put spreads.
Profits from low volatility and time decay.
Short Strangle (Advanced)
Sell OTM call and put when market is stable.
6. Volatility-Based Strategies (Big Move Expected)
Long Straddle
Buy call and put at same strike.
Profits from strong movement in any direction.
Long Strangle
Buy OTM call and put; cheaper than straddle.
Calendar Spread
Profit from changes in volatility and time decay.
7. Option Selling Strategies (Time Decay Advantage)
Sellers benefit from Theta (time decay).
Credit Spreads offer limited risk with consistent income.
High probability strategies when market remains stable.
Requires strong risk management and margin control.
8. Role of Option Greeks in Strategies
Delta: Measures price sensitivity.
Theta: Measures time decay (favors sellers).
Vega: Measures volatility impact.
Gamma: Measures speed of Delta change.
Greeks help select, manage, and adjust strategies.
9. Risk Management in Option Trading
Always use defined-risk strategies.
Risk only 1–2% of capital per trade.
Avoid naked selling without protection.
Set predefined exit rules.
Adjust positions instead of panicking.
10. Capital Allocation & Position Sizing
Diversify across multiple strategies and expiries.
Avoid all-in trades.
Keep cash reserve for adjustments.
Focus on consistency, not jackpots.
11. Psychological Discipline in Options
Small frequent losses are normal.
Avoid revenge trading.
Follow strategy logic, not emotions.
Patience and discipline beat prediction skills.
12. Adapting Strategies to Market Conditions
High volatility → Prefer option selling after spike.
Low volatility → Buy options or calendar spreads.
Trending market → Directional spreads.
Sideways market → Income strategies.
13. Beginner vs Professional Approach
Beginners should start with spreads and hedged strategies.
Professionals focus on probability, risk-reward, and consistency.
Strategy selection matters more than market prediction.
14. Key Advantages of Option Trading Strategies
Limited and defined risk.
Profit in any market condition.
Lower capital requirement.
Multiple ways to adjust losing trades.
Income generation opportunity.
15. Final Conclusion
Option trading strategies are not about complexity—they are about structure, discipline, and probability. When used correctly, they allow traders to control risk, adapt to market behavior, and build consistent returns over time. Success in options comes from understanding strategy logic, respecting risk, and maintaining emotional discipline. Master these elements, and option trading becomes a powerful weapon in your trading journey.

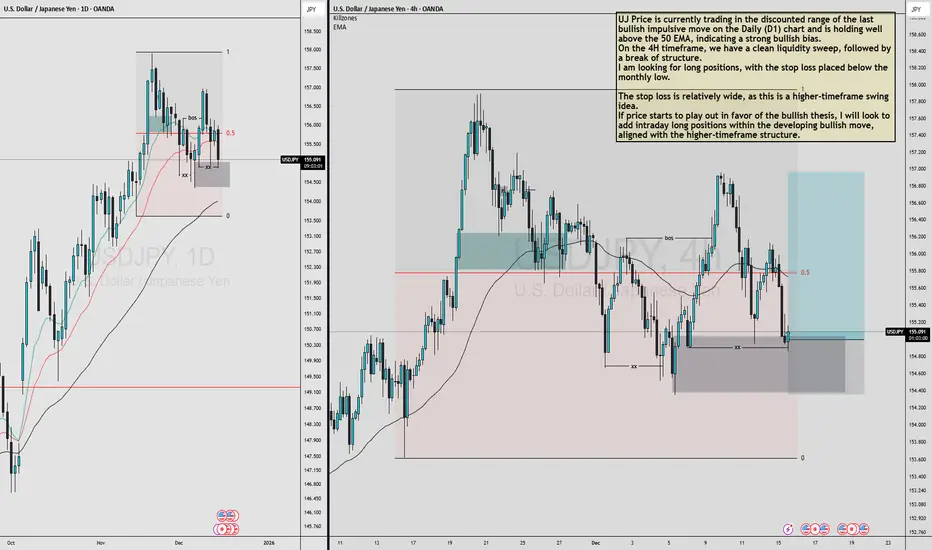
USDJPY MULTI TIMEFRAME ANALYSIS UJ Price is currently trading in the discounted range of the last bullish impulsive move on the Daily (D1) chart and is holding well above the 50 EMA, indicating a strong bullish bias.
On the 4H timeframe, we have a clean liquidity sweep, followed by a break of structure.
I am looking for long positions, with the stop loss placed below the monthly low.
The stop loss is relatively wide, as this is a higher-timeframe swing idea.
If price starts to play out in favor of the bullish thesis, I will look to add intraday long positions within the developing bullish move, aligned with the higher-timeframe structure.
Candle Patterns 🔹 What Are Candlestick Patterns?
Candlestick patterns are formed by one or more candles on a price chart. Each candle shows:
Open price
High price
Low price
Close price
Candlestick patterns reflect the battle between buyers and sellers within a specific time frame.
🔸 Structure of a Candlestick
Body – Distance between open and close
Wick / Shadow – High and low prices
Bullish Candle – Close > Open
Bearish Candle – Close < Open

Chart Patterns 🔸 What Are Chart Patterns?
Chart patterns are formed by price movements over time. They represent market structure and help traders anticipate breakouts, breakdowns, or reversals.
🔹 Types of Chart Patterns
1️⃣ Reversal Chart Patterns
2️⃣ Continuation Chart Patterns
3️⃣ Neutral Chart Patterns
4️⃣ Bilateral Chart Patterns
🔹 Key Components of Chart Patterns
✔ Trendlines
✔ Support and resistance
✔ Volume confirmation
✔ Breakout strength

Part 2 Candle Stick PatternsOption Expiry Types
Options expire on:
Weekly expiry (popular for indices like NIFTY)
Monthly expiry
Quarterly expiry
As expiry nears:
Premium decay accelerates
Volatility spikes
Price movements become sharper

Part 2 Support and Resistance Option Premium
The option premium is the price paid by the buyer to the seller (writer) of the option.
Premium consists of:
Intrinsic Value – Real value if exercised now
Time Value – Value based on time remaining until expiry
As expiry approaches, time value decreases, a phenomenon known as time decay (Theta).

Part 1 Support and Resistance Put Option Explained
A Put Option gives the buyer the right to sell the underlying asset at a fixed price before or on expiry.
Example:
If NIFTY is trading at 22,000 and you buy a 21,800 Put Option, you expect the market to move down.
If NIFTY falls to 21,500 → You profit
If NIFTY stays above 21,800 → Option may expire worthless
Maximum loss = Premium paid
Profit potential = High but limited
Put options are used when traders are bearish or want to protect their portfolio from downside risk.

Part 12 Trading Master Class Call Option Explained
A Call Option gives the buyer the right to buy the underlying asset at a fixed price (strike price) before or on expiry.
Example:
If NIFTY is trading at 22,000 and you buy a 22,200 Call Option, you expect the market to move up.
If NIFTY goes to 22,400 → You profit
If NIFTY stays below 22,200 → Option may expire worthless
Maximum loss = Premium paid
Profit potential = Unlimited
Call options are generally used when traders are bullish on the market.

Part 11 Trading Master ClassWhat Is an Option?
An option is a derivative contract whose value is derived from an underlying asset such as:
Stocks
Indices
Commodities
Currencies
Each option contract is defined by:
Underlying asset
Strike price
Expiry date
Option premium
There are two main types of options:
Call Option
Put Option
