XAUUSD MULTI TIMEFRAME ANALYSIS Watching Gold for potential longs. Last two days have bounced nicely off the 10–20 EMAs, and even though the weekly bias is still bearish, price looks like it wants to push toward last week’s high (which isn’t cleared yet). On the 1H, the setup is clean — sweep, BOS, and an FVG, with Asian session giving a pullback into the zone. The only concern is Gold is still stuck in a choppy range, and this setup performs way better in trending conditions. If the market genuinely wants to take the previous weekly high, this should play out. Waiting to see how it unfolds.
Setup Quality ⭐⭐⭐⭐
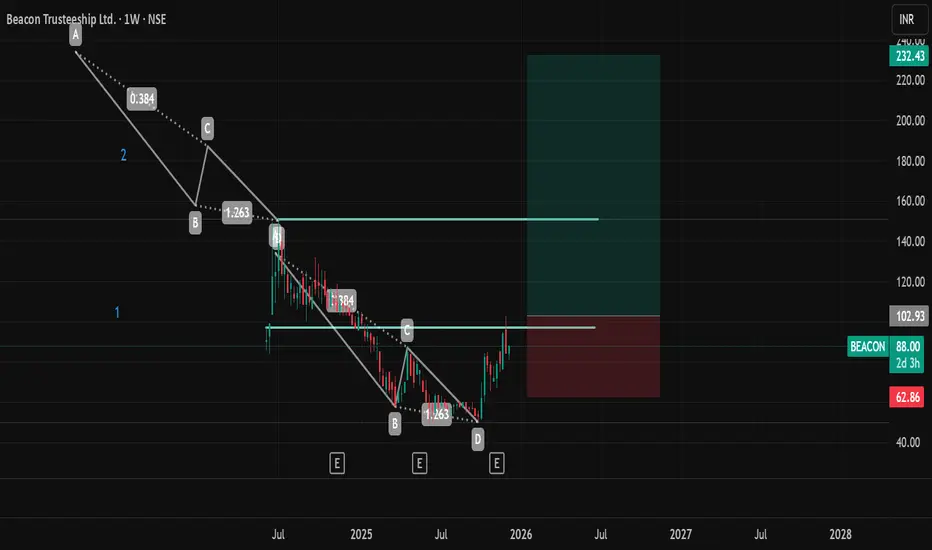
Harmonic Patterns

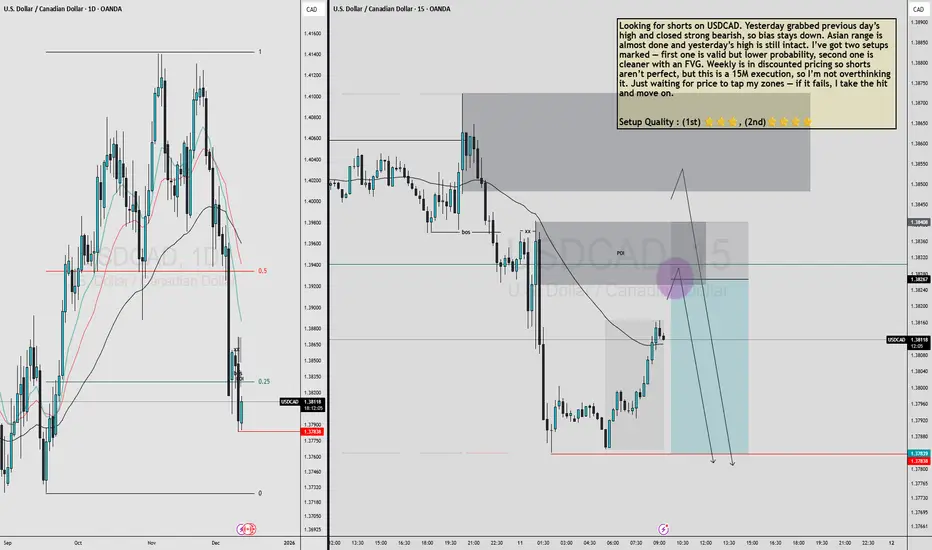
USDCAD MULTI TIMEFRAME ANALYSIS Looking for shorts on USDCAD. Yesterday grabbed previous day’s high and closed strong bearish, so bias stays down. Asian range is almost done and yesterday’s high is still intact. I’ve got two setups marked — first one is valid but lower probability, second one is cleaner with an FVG. Weekly is in discounted pricing so shorts aren’t perfect, but this is a 15M execution, so I’m not overthinking it. Just waiting for price to tap my zones — if it fails, I take the hit and move on.
Setup Quality : (1st) ⭐⭐⭐, (2nd)⭐⭐⭐⭐
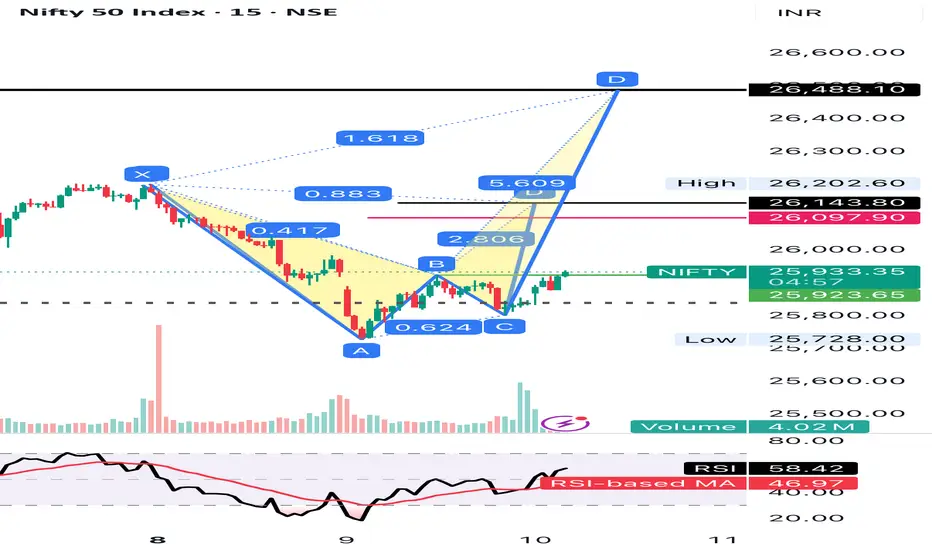
NIFTY- Intraday Levels - 11th December 2025If NIFTY sustain above 25758/61 then 25777/83 above this bullish then around 25814/26/31 above more bullish around 25895/25923 above this wait more levels marked on chart
If NIFTY sustain below 25728/16/11 below this bearish then 25666/54/49 support below this more bearish more levels marked on chart
Consider some buffer points in above levels.
Please do your due diligence before trading or investment.
**Disclaimer -
I am not a SEBI registered analyst or advisor. I does not represent or endorse the accuracy or reliability of any information, conversation, or content. Stock trading is inherently risky and the users agree to assume complete and full responsibility for the outcomes of all trading decisions that they make, including but not limited to loss of capital. None of these communications should be construed as an offer to buy or sell securities, nor advice to do so. The users understands and acknowledges that there is a very high risk involved in trading securities. By using this information, the user agrees that use of this information is entirely at their own risk.
Thank you.

$LUNA Finally Catching a breath After Brutal Red Days VIE:LUNA Finally Catching a breath After Brutal Red Days 😮💨
From Bloodbath to Bounce:
🔴 -99.88% massacre (RIP portfolios)
🟢 Now +286% relief at $0.23 From $0.06415 within 21 Days
▶️Major Downtrend line overhead
Major resistance at $0.30-0.38 ahead.
Potential bottom formation or dead cat bounce?
Recovery or bull trap? Time will tell 🤔
EXTREMELY HIGH RISK asset - trade with caution
Not financial advice | DYOR

$BONK Technical Analysis Update by CryptopatelSIX:BONK Technical Analysis Update by Cryptopatel
Current Structure:
SIX:BONK has broken key support at $0.00001 and is currently retesting the level.
Red zone: $0.000010 – $0.00001125.
Price below this zone = bearish, high probability of testing Bullish Order Block between $0.00000450 – $0.00000350, which is the prime accumulation area.
Retracement Outlook:
If SIX:BONK fails to reclaim $0.00001, expect 50%–70% retracement in the next few weeks.
Bullish Flip:
Key breakout required: $0.00001250.
Closing above this Red box signals super bullish momentum, potential 200%–400% upside.
Trade Watch:
Red zone $0.000010–$0.00001125 = critical level to enter trades.
Monitor price reaction at Bullish Order Block for optimal accumulation.
Summary:
Below $0.00001 → Bearish / accumulation phase
Above $0.00001250 → Super bullish breakout
TA Edge: Discipline on zones + clear breakout confirmation = key to maximizing gains.
NFA & DYOR

Part 2 Intraday Trading Master Class Risk-Management Tips
Even the best strategy fails without discipline. Here’s the real game:
Avoid unlimited risk strategies early in your journey.
Never sell naked options without proper hedging.
Always size positions correctly—use only what you can afford to lose.
Monitor volatility (VIX, IV) before entering.
Know your exit even before you enter a trade.

360 ONE – Daily Chart Analysis & Bullish Projection360 ONE is approaching a major breakout zone after forming a strong higher-low structure. The price has repeatedly held important support levels and is now pushing toward a multi-month resistance, indicating strong buildup for a swing breakout.
Key Levels From the Chart
Buy Above / Early Swing Entry
₹1,194
– This is the resistance breakout zone
– A daily close above this triggers a fresh momentum leg
– Strong volume confirmation preferred
Support / Stop-Loss Zone
₹1,110 – ₹1,113
– This is the nearest structural support
– Rejection candles have formed here earlier
– Breakdown below this invalidates the bullish setup
Upside Targets
Primary Target
₹1,296 – ₹1,300
– First major resistance after breakout
– Aligns with previous supply zone
– Ideal for partial booking
Swing Target
₹1,600
– Full extension target
– Matches the broader structure measured-move
– Achievable if market remains supportive and momentum sustains
Trade Plan Summary
Buy Above: ₹1,194
Stop-Loss: ₹1,110
T1: ₹1,296
T2 (Swing): ₹1,600
Bias: Bullish as long as the price stays above ₹1,110.
Breakout Strength: A daily close above ₹1,194 with strong volume confirms the swing continuation.
Disclaimer: aliceblueonline.com

Time to play with NattyLook for buying opportunity today. I doubt it will come but if it comes to 407 it's a straight buying opportunity. Even at 408/404. Fib Retracement it will not break. One can trade with big quantities.

Part 1 Intraday Trading Master Class How Option Trading Works
Let’s break it down simply:
1. Choose the Direction
Are you bullish or bearish?
Bullish → Buy Call or Sell Put
Bearish → Buy Put or Sell Call
2. Choose the Strike Price
Pick ITM, ATM, or OTM based on your style and risk.
3. Select Expiry
Weekly expiries are popular for index trading
Monthly expiries suit swings and positional trades
4. Enter & Exit the Trade
You don’t have to wait until expiry.
Most traders exit early based on target and stop-loss.

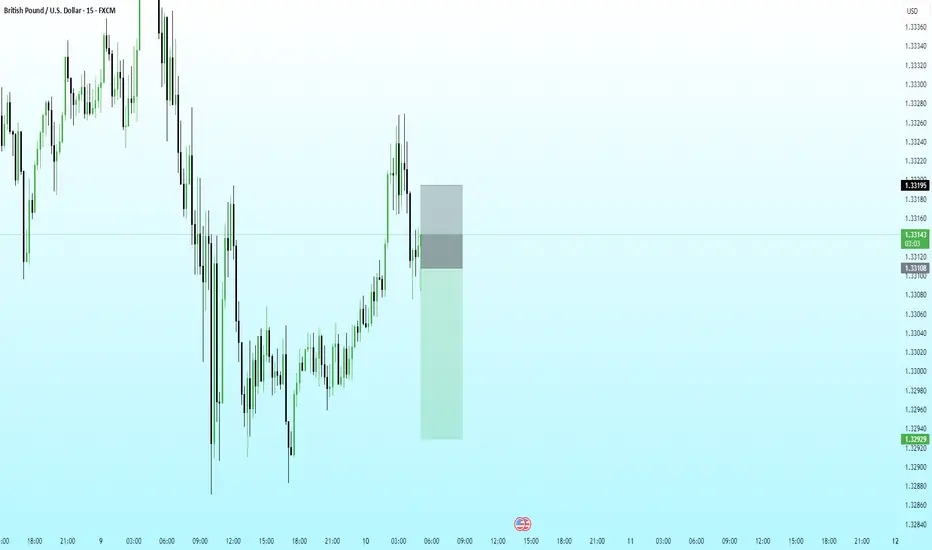
GBPUSD Short | 15m | Structural RejectionPrice tapped into a minor premium zone after an extended corrective leg and immediately showed rejection through a sharp bearish response. The preceding move lacked impulsiveness, suggesting it was corrective rather than a trend continuation.
The short entry is based on:
• Retest of prior micro-structure breakdown
• Failure to sustain above the rejection block
• Clear shift in orderflow as bullish momentum faded
Stop placed above the rejection candle.
Primary target aligned with the liquidity pocket near 1.3290.
This setup follows the broader intraday bias and respects the structural flow of GBPUSD during the session.
PCR Trading Strategies Option Buyers vs. Option Sellers
Option Buyers
Limited loss (only premium paid)
Unlimited profit potential
Higher risk of loss due to time decay
Good for small capital traders
Option Sellers (Writers)
Limited profit (premium received)
Potentially unlimited loss
Benefit from time decay
Requires high margin and experience
Example:
A seller who sells Nifty 22,500 CE for ₹100 receives ₹100 premium.
If Nifty stays below 22,500, the seller keeps the entire premium.

Option Trading Strategies How Option Premium Is Determined
The premium of an option depends on multiple factors. These include:
1. Underlying Price (Spot Price)
Directly impacts option value.
Call premiums rise when price goes up
Put premiums rise when price goes down
2. Time to Expiry (Time Value)
Options lose value as expiry approaches. This is called time decay or theta decay.
3. Volatility (IV – Implied Volatility)
Higher volatility increases premiums because uncertainty is higher.
4. Interest Rates & Demand-Supply
These have smaller effects but still influence prices.

XAUUSD Short | 15m |Gold revisited the upper band of the intraday structure and showed clear signs of weakening momentum. Price failed to sustain above the model’s trailing zone, indicating a shift from short-term accumulation to distribution.
The short entry was executed as price broke back below the cloud, supported by a clean loss of intrabalance strength.
Stop is placed above the most recent structural failure.
Primary target sits near the liquidity cluster around 4175.

Monthly TF analysis. Buy 1015.Based on stacked high low difference.
1 Historical Base Formation
2 was = 1
3 was = 1
4 and 5 will be same as 1.
Buy at 1015. Safe entry.
R:R = 1:2.5

Part 2 Master Candle Stick patterns Types of Options
1. Call Options (CE)
A call option gives the buyer the right to buy the underlying asset at the strike price before expiry.
You buy a call if you think the price of the asset will go up.
Example:
If Nifty is at 22,000 and you expect it to rise, you might buy a 22,200 CE.
If Nifty rises to 22,400, the premium of your call option increases, giving you profit.

Weekly TF analysis. Buy 103.Based on stacked high low difference.
1 Historical Base Formation
2 should be = 1, Projected breakout
Buy at 103. Safe entry.
R:R = 1:3
Part 1 Candle Stick Patterns What Is an Option?
An option is a contract between a buyer and a seller.
The buyer pays a premium to purchase the right.
The seller receives the premium and takes on the obligation.
Every option contract has:
Strike Price – the predetermined price for buying or selling the asset
Expiry Date – the date on which the option contract ends
Premium – the cost of the option
Lot Size – fixed quantity of the underlying asset
Understanding these fundamentals is crucial before diving into live trading.

KALYANKJIL 1 Week Time Frame 📉 1‑Week Price Movement & Technical Snapshot
The share price has fallen by ~4–5% over the last week.
Current quote (around 9–10 Dec 2025) is in the ₹468–473 range.
From its 52‑week high of ₹794.60, the stock is down more than 40%.
Technical‑analysis commentary suggests “bearish momentum” and “mixed signals” — indicating consolidation or possible further downside in the short term.
📊 Fundamentals & Market Context
Recent financials show some strength: the company reported good revenue growth and profitability in recent quarters.
On the valuation side: the stock quotes a high P/E (price-to-earnings) and P/B (price-to-book) compared with some peers — implying expectations are already priced in.
Some analysts as per recent reports have highlighted structural headwinds (like weaker jewellery demand, gold‑price volatility, cautious consumer spending), which may weigh on near‑term performance.

XAUUSD/GOLD 1H BUY PROJECTION 10.12.25“Character Invalid Here” (Lower Pink Zone)
This zone represents heavy sell pressure.
Price dropped deeply here → buyers were weak → sellers dominated.
From this area, the market started recovering upward slowly.
2️⃣ Day High as Resistance R1 (Middle Pink Zone)
This is a strong resistance level.
Price tested this zone multiple times and faced rejection.
This confirms it as a key intraday resistance.
Once price breaks and retests this area, bullish confirmation becomes stronger.
3️⃣ Bounce Back Area (Green Horizontal Zone)
This area is where you expect the pullback (retracement) to happen.
When price returns to this zone:
✔ Buyers re-enter the market
✔ Trend continues upward
✔ You get safe entry confirmation
This is a high-probability buy zone.
4️⃣ Entry After Bounce Back (Red Zone)
This is the ideal buy entry area after confirmation.
Your structure shows:
Price breaks the resistance
Pulls back for retest
Holds the major trendline
Respects the curved support (cup structure)
This indicates a strong bullish continuation setup.
5️⃣ Target Price (Weekly High Resistance & TP)
This is the weekly high, which acts as the final target.
The price is expected to reach this level due to:
Strong bullish momentum
Breakout + retest confirmation
Trendline support
Clean upside liquidity
This is a realistic and high-probability target.

Premium Chart Patterns Why Chart Patterns Work
Chart patterns work because they reflect real market behavior.
Key reasons:
✔ Human psychology repeats
People fear losses and chase gains. This creates repeatable price movements.
✔ Institutions accumulate or distribute slowly
Big players cannot buy or sell at once—they create patterns during accumulation/distribution.
✔ Liquidity zones
Patterns often form near liquidity pools where many stop-loss orders exist.
✔ Self-fulfilling nature
When many traders recognize the same pattern, they take similar trades, increasing accuracy.

XAUUSD MULTI TIMEFRAME ANALYSIS Gold looks set to push toward the all-time high without dipping below the previous day’s low. Despite a bearish weekly bias, yesterday’s close makes a deeper move into last week’s low unlikely. Daily structure is bouncing cleanly off the 10/20 EMAs, and the current price action leans strongly bullish. I’ll watch this zone for a high-probability long setup and position toward the upside if my entry conditions trigger.

Nifty rally expected soon 26488++ in no timeNifty after hitting 50 EMa ready for rally
Immediate target 26488++
Probably this week only possible
26145/26277 hurdle points
XAUUSD/GOLD JOLTS Job Openings News Projection 09.12.25Main Idea
Gold is currently ranging between 4,191 – 4,210 zones.
During JOLTS news volatility, price may either break upward or break downward from this zone.
Your plan is a breakout + retest entry with a 1:3 Risk–Reward Ratio.
🟢 Bullish Scenario (Buy Setup)
Conditions to Buy:
Price breaks above 4,210 zone
Retests the same zone and holds as support
Enter after bullish confirmation
Target:
4,250 zone
Stoploss:
Below 4,191 zone
🔴 Bearish Scenario (Sell Setup)
Conditions to Sell:
Price breaks below 4,191 zone
Retests the level as resistance
Enter after bearish confirmation
Target:
4,163 zone
Stoploss:
Above 4,210 zone
🎯 Risk–Reward Ratio: 1:3
Both setups aim for a low-risk and high-reward breakout trade using news momentum.
