Vimta Labs Limited - Breakout Setup, Move is ON...#VIMTALABS trading above Resistance of 952
Next Resistance is at 1214
Support is at 691
Here are previous charts:
Chart is self explanatory. Levels of breakout, possible up-moves (where stock may find resistances) and support (close below which, setup will be invalidated) are clearly defined.
Disclaimer: This is for demonstration and educational purpose only. This is not buying or selling recommendations. I am not SEBI registered. Please consult your financial advisor before taking any trade.
Harmonic Patterns

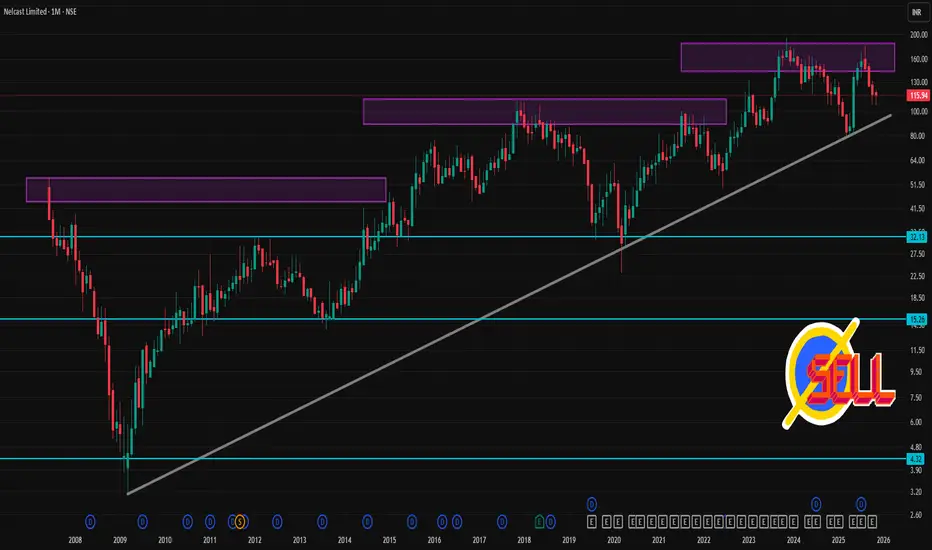
NELCAST 1 Month Time Frame 📌 Recent snapshot
As of 28 Nov 2025, Nelcast closed around ₹116.
Over the past 1 month, the stock has seen a ~ –9 % return.
The 52-week trading range: low ~ ₹78, high ~ ₹180.
✅ My View (with caution)
Nelcast seems fairly valued — perhaps a bit stretched relative to estimated intrinsic value. In short term (1 month), a range between ₹112–₹125 seems the most probable, unless there’s a sharp catalyst (good or bad).
If I were you — and purely for trading or short-term view — I’d watch for a dip toward ₹110–₹112 (as a possible “buy zone / entry”) and a rebound toward ₹124–₹125.
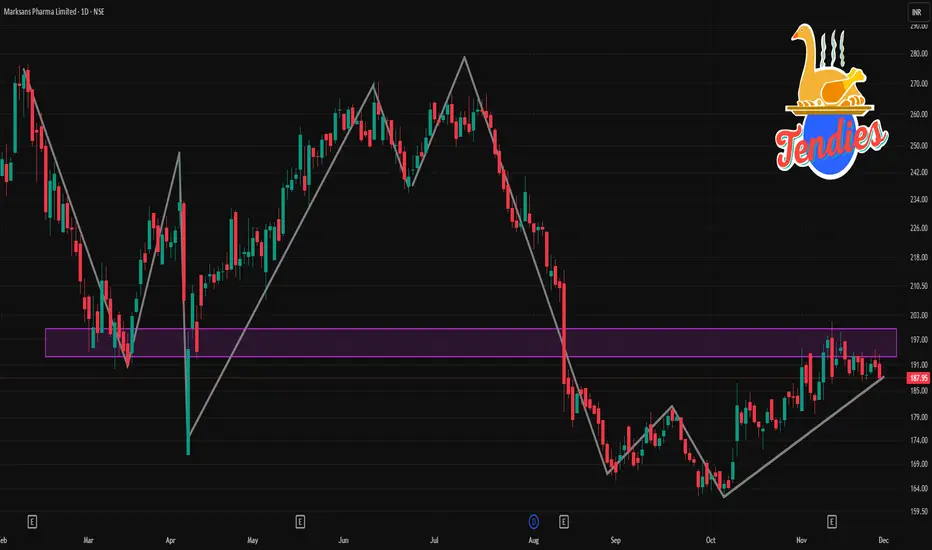
MARKSANS 1 Day time Frame 📌 Current Price & Broad Context
Latest share price: ≈ ₹187.95.
52-week range: Low ~ ₹162.00, High ~ ₹358.70.
Recent trend: The stock is significantly below its 52-week high; price has fallen roughly 25–45% over the past 6–12 months.
🧮 What to Watch / Combine with Other Views
Daily technicals show neutral-to-bearish bias, with some structural support around long-term moving average.
But longer-term fundamentals (company financials, order book, approvals, sector sentiment) could disrupt this — technicals are just one lens.
Because the stock is well below its 52-week high, there’s scope for rebound — but also risk: price could continue downward if sentiment remains weak.
For better clarity: it’s often helpful to check 1-week or 1-month charts along with volume, open interest (if derivatives), and any corporate/news events.
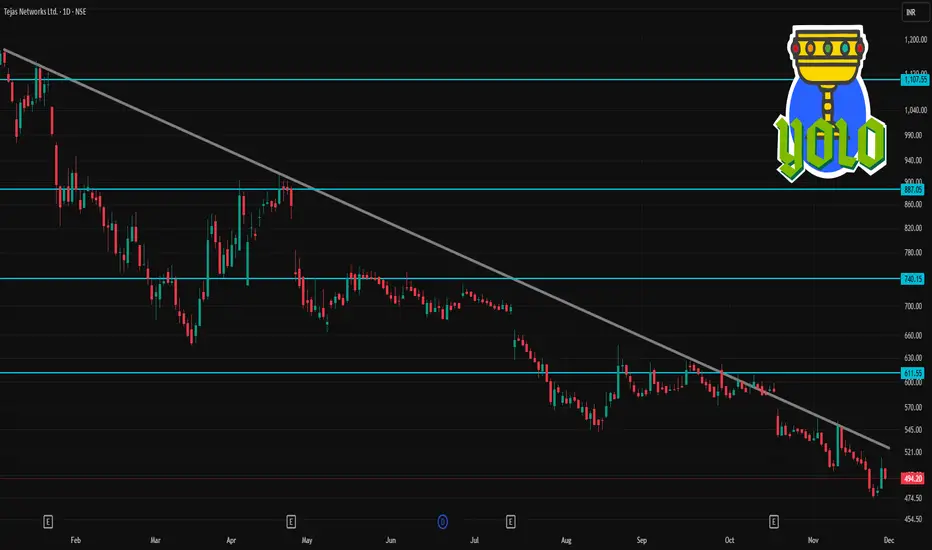
TEJASNET 1 Day Time Frame 📌 Current Price & Context
Recent data shows TEJASNET trading around ₹494–₹496.
52-week range: Low ~ ₹474.45, High ~ ₹1,402.70.
On 1-day/short-term technicals: the consensus remains “Sell / Strong Sell”.
So — the stock is near its lower end of the 52-week range, but short-term momentum is weak.
✅ What This Means for Traders (1-Day / Intraday)
As of now, bias on 1-day timeframe remains bearish / neutral. Unless there is a strong positive catalyst, further downside or consolidation is more likely than a sustained bounce.
The zone around ₹484–₹486 (and possibly down to ₹471–₹475) is critical support — a breakdown below could open a bigger downside swing.
On the upside, watch ₹511–₹512 and then ₹520–₹525 for any meaningful resistance breaks — only a close above these may suggest short-term relief.
Because moving averages are well above current price, any upside rally may remain limited unless volume and market-wide sentiment improve.
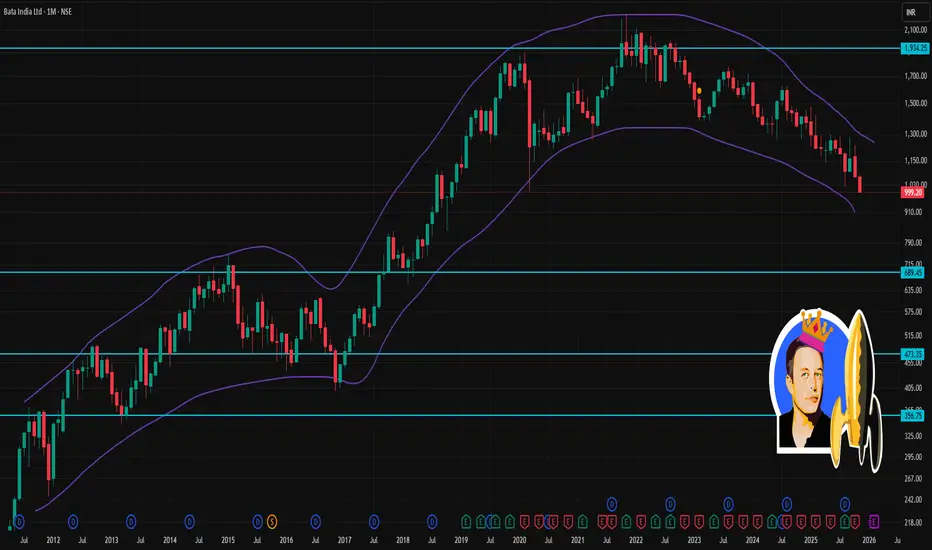
BATAINDIA 1 Month Time Frame 📌 Recent Price & Context
The stock has recently traded around ₹1,000–₹1,010 levels.
The 52-week high is ~₹1,479; 52-week low is ~₹996–₹1,005 (depending on the source) — so recent levels are close to the lower end of the 52-week range.
The stock has been under pressure lately, partly due to weak Q2 FY26 results which dragged sentiment.
⚠️ Key Risks & What’s Dragging the Stock
Weak recent financial performance — recent quarter’s poor results have weighed on sentiment.
Technical picture remains weak: price below all major moving averages, multiple sell signals on daily charts.
High volatility and lack of clarity on demand — any bounce may be shallow unless firm positive triggers come (e.g. good sales data, broader market up-move, sector tailwinds).
Part 4 Learn Institutional TradingParties Involved in an Options Contract
There are two sides to every options contract:
Option Buyer
Pays the premium.
Has limited risk (only the premium paid).
Has unlimited profit potential in call options and significant potential in puts.
Option Seller (Writer)
Receives the premium.
Has limited profit (only the premium collected).
Faces potentially unlimited risk in calls and large risk in puts.
Option sellers generally need higher margin because they take the greater risk.

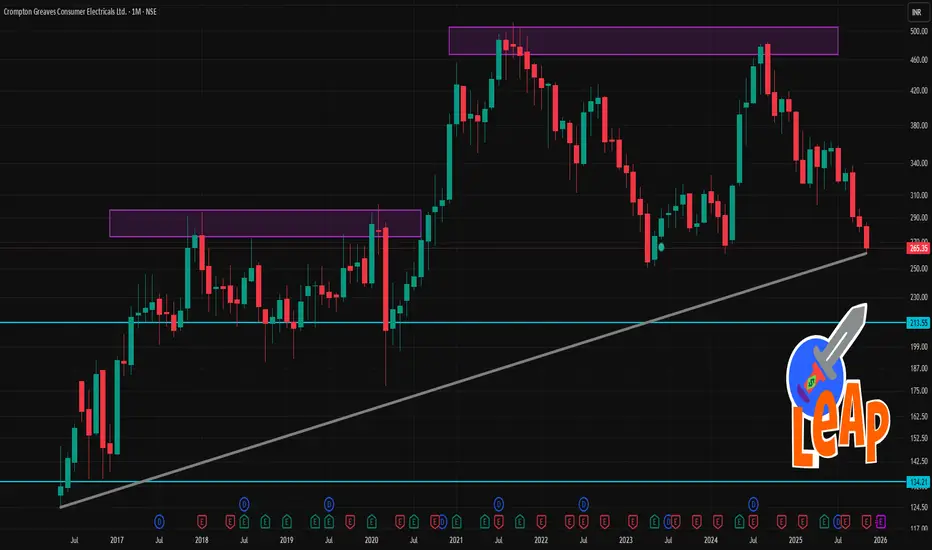
Crompton 1 Month Time Frame 📉 Recent context & background
The stock recently hit a fresh 52-week low — around ₹267.5–₹271.25.
Latest quarter (Q2 Sep-2025) saw a sharp profit drop: net profit fell ~43% YoY, with EBITDA margin under pressure due to commodity cost inflation and restructuring costs.
On the flip side, the company’s broader business mix (like pumps / small domestic appliances / solar-rooftop orders) and some analyst estimates still see potential for recovery.
🧭 What could move the price in next 1 month
Positive triggers: Any signs of margin recovery, easing of commodity inflation, good order wins (e.g. solar-segment orders or domestic appliance demand), supportive news or institutional interest.
Negative triggers: Continuation of margin pressure, weak demand in core categories, negative macro / interest-rate or inflation environment, or broader investor risk-off sentiment.
🎯 My Base-Case 1-Month Scenarios
Bearish to neutral scenario: Price may hover or drift around ₹260–₹285, possibly bouncing between support (₹265–₹270) and resistance (₹280–₹290).
Bullish/recovery scenario: If sentiment improves, stock could aim for ₹300–₹330 over the next 3–4 weeks — especially if company provides encouraging updates or sector environment improves.
Upside breakout scenario (less likely in short 1-month): A push toward ₹340 is possible only if there’s a strong catalyst (e.g., margin rebound, big orders, broadly bullish market) — but that feels optimistic for just 1 month.
Candle Pattern Knowledge Limitations and Best Practices
Candlestick patterns alone should not be used as the only basis for trades. They are best combined with:
Moving averages
RSI or MACD
Support/resistance levels
Volume analysis
Best Practices
Wait for confirmation before entering.
Avoid trading patterns in choppy, sideways markets.
Use stop-losses under key levels.
Combine with market structure for higher accuracy.

Premium Chart Patterns Why Premium Patterns Matter
Premium chart patterns add value because they simplify decision-making. They help traders:
Identify high-probability entry points
Set predefined stop-loss and target levels
Understand market structure
Build rules-based trading systems
Reduce emotional decision-making
Experienced traders combine patterns with support/resistance, volume, moving averages, and risk management to build robust strategies.

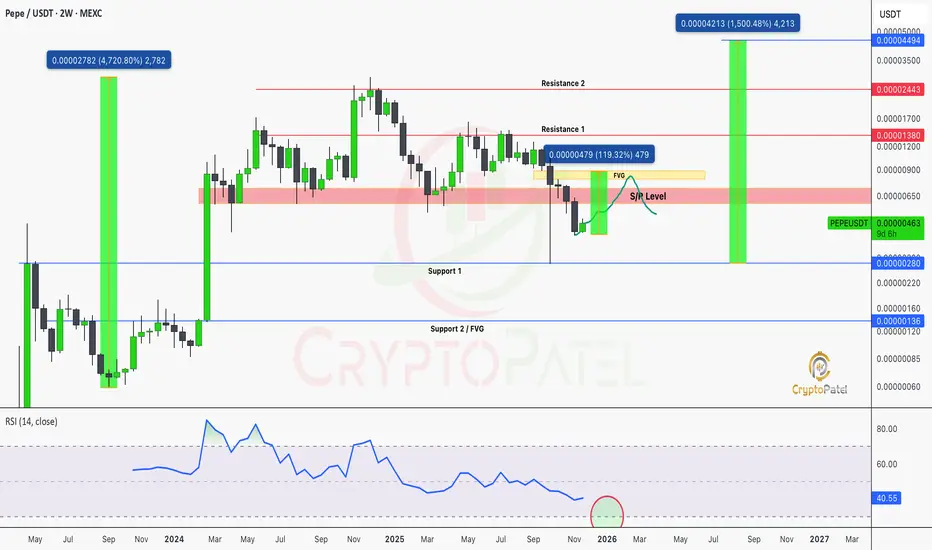
$PEPE Weekly Support Broken Or the Perfect Trap Before a Pump?CRYPTOCAP:PEPE Weekly Support Broken Or the Perfect Trap Before a Pump?
CRYPTOCAP:PEPE lost its weekly support and is now trading below it, which looks more like a full liquidity sweep than a real trend shift. I’m expecting a 50–100% relief rally before the next major move.
If key S/R flips and holds, we could see another memecoin cycle, with 1,000–1,500% upside back on the table.
Support / Accumulation: $0.00000280 / $0.00000136
Resistance / Targets: $0.00000914 → $0.00001380 → $0.00002443 → $0.00004494
Watch my levels closely before entering any trades.
NFA & DYOR
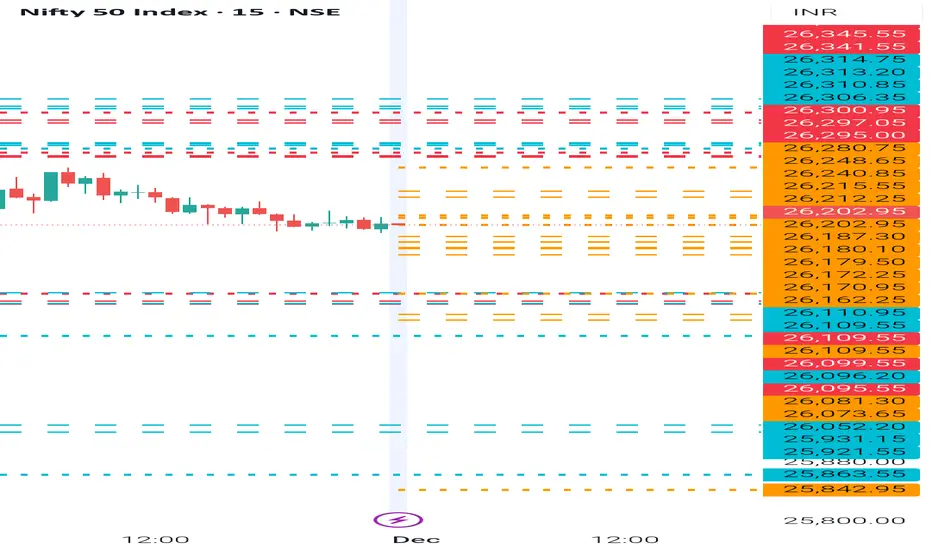
NIFTY- Intraday Levels - 1st December 2025If NIFTY sustain above 26202/12/15 above this bullish then around 26240/48 above more bullish around 26280 above this wait more levels marked on chart
If NIFTY sustain below 26187/62 below this bearish then 26110 support below this more bearish then 26099/95 strong level then very very strong level and last hope 26081/73 below this wait more levels marked on chart
My view :-
"My viewpoint, offered purely for analytical consideration, The trading thesis is: Nifty (bearish tactical approach: sell on rise)
This analysis is highly speculative and is not guaranteed to be accurate; therefore, the implementation of stringent risk controls is non-negotiable for mitigating trade risk."
Consider some buffer points in above levels.
Please do your due diligence before trading or investment.
**Disclaimer -
I am not a SEBI registered analyst or advisor. I does not represent or endorse the accuracy or reliability of any information, conversation, or content. Stock trading is inherently risky and the users agree to assume complete and full responsibility for the outcomes of all trading decisions that they make, including but not limited to loss of capital. None of these communications should be construed as an offer to buy or sell securities, nor advice to do so. The users understands and acknowledges that there is a very high risk involved in trading securities. By using this information, the user agrees that use of this information is entirely at their own risk.
Thank you.
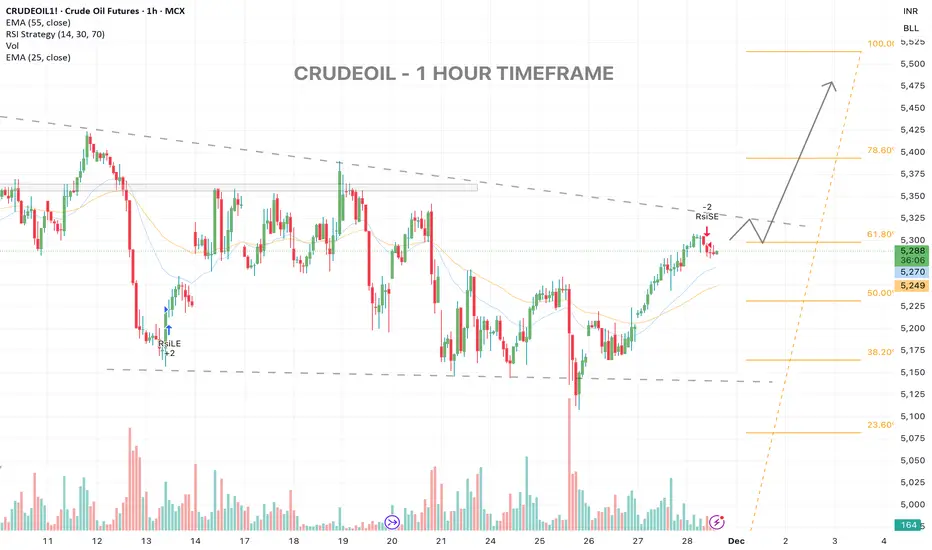
SOON BREAKOUT IN CRUDEOIL ?CRUDEOIL - 1 HOUR TIMEFRAME
Price is retesting the 61.8% zone right under the descending trendline.
A shallow pullback toward 5260–5275 can fuel the next leg toward 5335 / 5385 / 5450.
Overall, structure favors a continuation leg higher once the pullback stabilizes, remains bullish as long as 5205 holds. Watching for breakout confirmation.
Part 1 Intraday Trading Master ClassWhat Are Options?
Options are financial contracts that give you the right, but not the obligation, to buy or sell an underlying asset (like Nifty, Bank Nifty, a stock, etc.) at a fixed price within a specified time.
There are two types of options:
Call Option (CE) – Gives the right to buy
Put Option (PE) – Gives the right to sell
In India, all index and stock options are European style, which means they can be exercised only on expiry day, but they can be bought or sold (squared off) anytime before expiry.

PCR Trading Strategies How Option Prices Move (Option Greeks)
Option premiums move because of time, volatility, and market direction. The Greeks explain this movement.
1. Delta – Direction Sensitivity
Delta shows how much premium changes with a ₹1 move in the underlying.
Call delta: +0.3 to +1.0
Put delta: –0.3 to –1.0
Higher delta = faster premium movement.
2. Theta – Time Decay
Theta is the killer for option buyers.
As time passes, the premium loses value.
Sellers benefit from theta
Buyers suffer from theta
3. Vega – Volatility Impact
Higher volatility = higher option premiums.
Lower volatility = cheaper premiums.
4. Gamma – Acceleration of Delta
Gamma shows how fast delta changes.
Fast markets increase gamma dramatically.

Part 2 Master Candle Stick Patterns Key Terms in Options
Option trading revolves around certain essential terms that define risk, reward, and price movement.
Premium
The price you pay to buy an option.
For the buyer, premium = maximum loss.
Strike Price
The fixed level at which you buy (Call) or sell (Put) if you choose to exercise the contract.
Expiry
Every option expires weekly or monthly.
India has:
Weekly expiry: Nifty, Bank Nifty, Fin Nifty
Monthly expiry: All indices & stocks

Building a Strong Crypto Investment Strategy1. Understand the Market and Its Risks
Before investing, it’s crucial to understand what cryptocurrency is and how it operates. Crypto assets range from store-of-value coins like Bitcoin to smart-contract platforms like Ethereum and utility tokens designed for specific ecosystems. Each category carries different levels of risk and potential return.
Crypto markets are known for extreme price swings. A coin can rise or fall by 20–30% within hours. Investors must acknowledge this volatility and mentally prepare for sudden market movements. Additionally, the ecosystem is exposed to regulatory shifts, exchange hacks, and technological failures. Understanding these inherent risks helps shape realistic expectations and prevents emotional decision-making during market turbulence.
2. Define Your Investment Goals
Every strong investment strategy starts with clear and realistic goals. Ask yourself:
Are you investing for long-term wealth creation?
Do you want regular short-term gains through active trading?
Are you building a diversified digital-asset portfolio?
What is your risk tolerance—conservative, moderate, or aggressive?
Long-term investors typically prefer established cryptocurrencies with proven adoption. Short-term traders look for volatility and momentum. A clear goal helps determine the type of assets to choose, the timing of investments, and the level of engagement required.
3. Conduct Thorough Research (DYOR)
"Do Your Own Research" is a critical rule in the crypto world. Since markets are influenced by hype and speculation, many projects lack genuine utility or long-term viability. Good research should include:
Fundamental Analysis
Project utility – What problem does the crypto solve?
Technology and innovation – Does it offer scalable and secure architecture?
Team and developers – Are they credible and transparent?
Tokenomics – Supply, demand, inflation, burn mechanisms, and distribution.
Roadmap and partnerships – Future developments and real-world adoption.
Market Analysis
Current price trends
Trading volume and liquidity
Market capitalization (large-cap vs mid-cap vs small-cap assets)
Historical price movements
Sentiment Analysis
Monitoring news, social media trends, and community engagement helps gauge market mood. While hype should not drive decisions, sentiment can influence short-term movements.
Proper research protects investors from scams, overhyped tokens, and projects with weak fundamentals.
4. Diversify Your Portfolio
Crypto diversification is more than holding multiple coins. It means spreading investments across different categories to balance risk and return.
Ways to Diversify:
By market sector: Smart-contract platforms (ETH, SOL), payment coins (BTC, LTC), DeFi tokens, gaming/metaverse tokens.
By market cap: Large-cap assets for stability, small-caps for high growth potential.
By investment type: Spot holdings, staking assets, stablecoins, NFTs (optional), and even crypto-related stocks.
Diversification reduces the impact of a single asset collapsing and enhances long-term portfolio stability.
5. Decide on Investment Strategy: Passive vs Active
Your approach depends on time availability, experience, and goals.
Passive Investing
Suitable for long-term investors who prefer minimal involvement.
Buy and Hold (HODL): Purchasing strong projects and holding through volatility.
Dollar-Cost Averaging (DCA): Investing a fixed amount at regular intervals regardless of price.
Staking or Yield-earning: Earning passive income by locking tokens in networks.
Passive strategies reduce emotional interference and benefit from long-term market growth.
Active Investing
For experienced investors seeking higher returns with higher risks.
Swing trading: Capturing medium-term price swings.
Day trading / scalping: Frequent trades based on technical indicators.
Arbitrage: Profiting from price differences across exchanges.
Active investing requires market knowledge, discipline, and constant monitoring.
6. Apply Strict Risk Management
A strong crypto strategy is incomplete without robust risk management rules. Since the market is unpredictable, risk control determines long-term success more than profit targets.
Key Risk-Management Principles:
Never invest money you cannot afford to lose.
Allocate only a portion of your total portfolio to crypto (10–30% for most investors).
Set stop-loss and take-profit levels for every trade.
Avoid over-leveraged positions (high leverage increases liquidation risk).
Keep cash/stablecoins as reserves to buy dips.
Managing risk ensures you stay in the market long enough to benefit from future opportunities.
7. Use the Right Tools and Exchanges
Choosing safe and efficient platforms is essential. Look for exchanges with:
Strong security
High liquidity
Transparent fee structure
Good customer support
Use hardware wallets for long-term storage and avoid keeping large amounts on exchanges. Technical analysis tools like TradingView help identify trends, support/resistance zones, and market patterns. On-chain analytics platforms (Glassnode, Nansen) give deeper insights into market behavior.
8. Understand Taxation and Legal Requirements
Crypto regulations vary across countries and continue to evolve. Investors must understand:
How capital gains tax applies to crypto profits
How staking/yield income is categorized
Reporting requirements for crypto transactions
Ignorance of tax rules can lead to penalties later. A disciplined investor always remains compliant with existing laws.
9. Maintain Discipline and Emotional Control
Crypto markets test emotional strength. FOMO (fear of missing out), FUD (fear, uncertainty, doubt), greed, and panic selling are common psychological pitfalls. A strong strategy helps override emotional reactions.
Tips for Emotional Control:
Stick to your plan—avoid impulsive decisions.
Do not chase coins during sudden pumps.
Don’t panic if the market drops; re-evaluate logically.
Celebrate small, consistent gains rather than chasing massive returns.
Emotional discipline separates long-term winners from short-term speculators.
10. Keep Learning and Adapting
Crypto evolves faster than any other financial market. New technologies, regulations, and projects emerge constantly. Successful investors continuously update their knowledge.
Follow credible crypto analysts, developers, financial experts, and reputable news sources. Participate in communities, join AMAs, and stay informed about innovations like AI-driven trading tools, L2 solutions, CBDCs, and DeFi updates.
Conclusion
Building a strong crypto investment strategy requires a mix of knowledge, discipline, diversification, research, and emotional control. While the market offers enormous potential, it also presents significant risks. A successful investor understands both sides and navigates with a balanced, structured approach. By defining clear goals, conducting thorough research, managing risks intelligently, and adapting to market changes, you can develop a strategy that withstands volatility and achieves long-term financial growth.