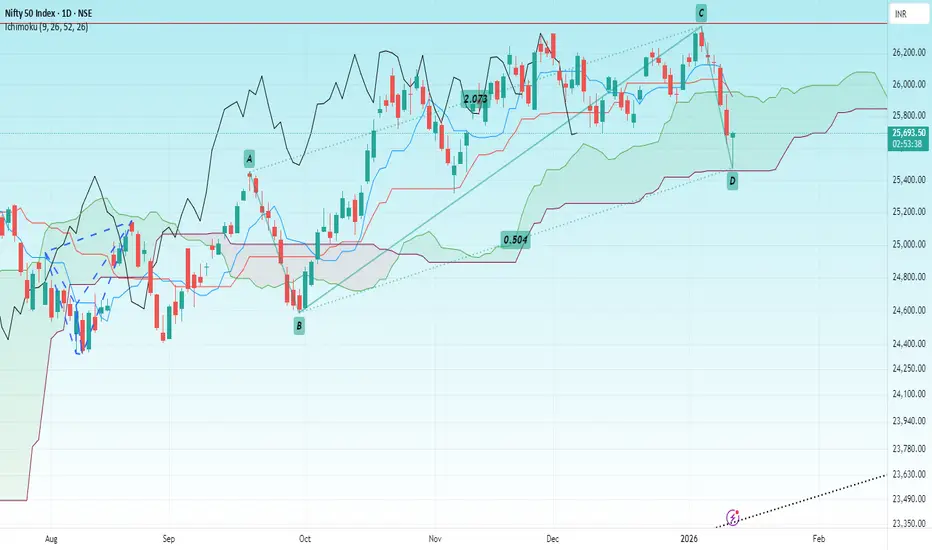
NIFTYHello & welcome to this analysis
Nifty has made a Bullish Harmonic Reciprocal ABCD pattern that coincides with Ichimoku Kumo support
If it sustains above 25650 then a bounce/reversal can be expected till 25800 / 26000 for now.
The view will go wrong below 25375
All the best
Harmonicpatternspotential
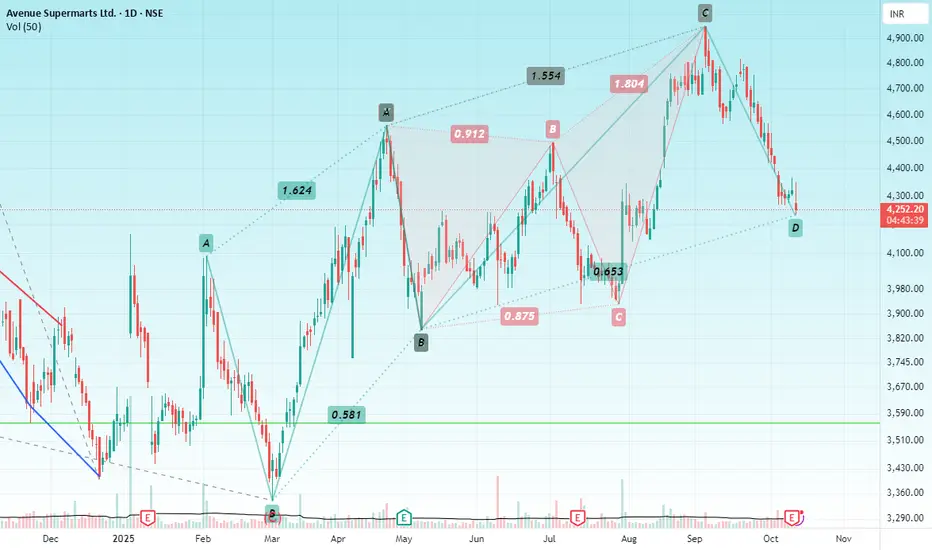
DMARTHello & welcome to this analysis
DMART has usually reversed regularly from Harmonic Patterns as can be seen in this chart in daily time from a
Bullish Reciprocal ABCD
to a
Bearish Deep Crab
to now forming a
Bullish Reciprocal ABCD
If it sustains above 4200 then it could give a probable bounce/reversal to 4400 & 4550 indicating a good risk : reward ratio
All the best
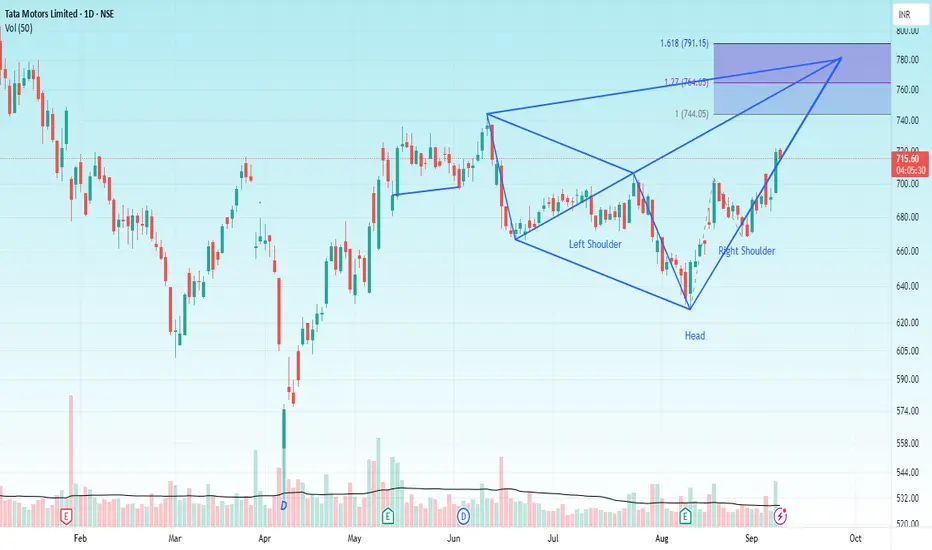
TATA MOTORS Hello & welcome to this analysis
The stock in daily time frame has given a double breakout
Inverse Head & Shoulder
Bullish Harmonic Seahorse
The upside levels as per IHS are 740 & 790 while the Seahorse pattern is indicating 775.
Both patterns have strong support at 690-700 and both would be considered invalid below 665
All the best
PUNJAB NATIONAL BANKHello & welcome to this analysis
In July 2025 it activated a bearish Harmonic Butterfly pattern at 115 that lead to its current decline at 38 Fibonacci of its rally.
Going forward it could continue to decline till 100 where it would likely form two bullish Harmonic patterns - Shark & ABCD around the 50 Fibonacci retracement.
It has resistance now between 110 - 108 from where it fell with heavy volumes couple of days back.
All the best
Regards

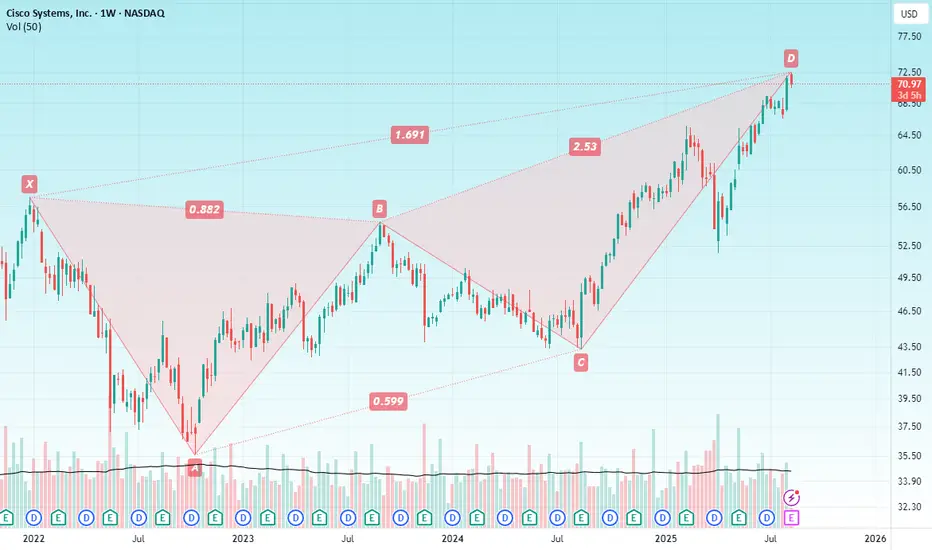
CISCO SYSTEMSHello & welcome to this analysis
In weekly time frame it has activated a bearish Harmonic Deep Crab pattern suggesting likely pullback to $65 and below that $57.
The pattern would be considered invalid above $77
All the best
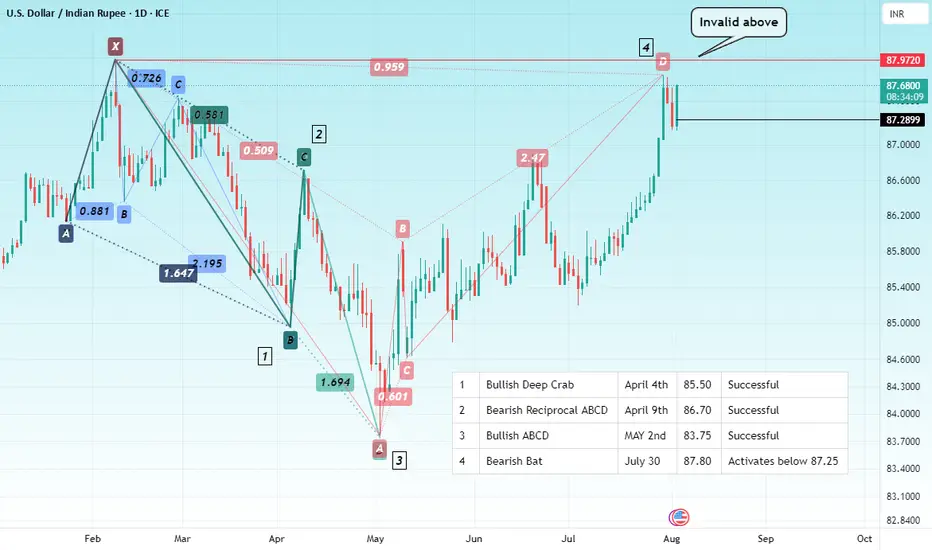
INDIAN RUPEE Hello & welcome to this analysis
$:INR has been swinging from a series of Harmonic Trading Patterns successfully this year as show in the chart.
With RBI POLICY coming up this week, will it be successful for the fourth time in a row?
Whatever it does, there is definitely going to be an impact of commodities particularly Crude, Gold & Silver that appear to be bullish.
All the best
GOLDHello & welcome to this analysis
In 4hrs time frame GOLD (MCX) has activated a bearish Harmonic Bat pattern.
It could retrace down to 99500 - 98500, will consider 100750 as stop loss for this set up.
Do keep in mind, GOLD overall is very strong and this could likely be a shallow retracement.
Regards

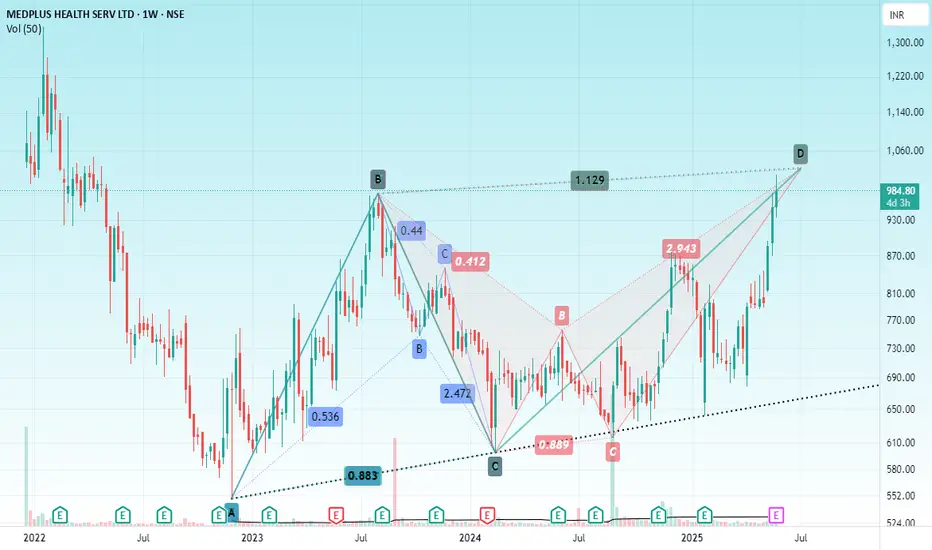
MEDPLUS HEALTHHello & welcome to this analysis
From a bullish Harmonic Bat pattern to a bearish Harmonic Alt Bat & bearish Harmonic ABCD in the weekly time frame.
Stock has entered in to potential reversal zone (PRZ) 1010-1050 of a bearish reversal probability.
Also note the 52w high and recent surge in price has come with low volumes.
A daily close below 940 could further pull it down towards 850-775.
Pattern negates if price moves above 1075
All the best
MAX FINANCIAL SERVICES LTDHello & welcome to this analysis
The stock has entered the potential reversal zone (PRZ) in monthly time frame of double bearish harmonic patterns - ABCD & Deep Crab. The probable zone is between 1460 - 1500.
Since this is a monthly time frame pattern a bearish derivative trade would be risky as it could firstly take a lot of time to reverse after distribution and secondly the stop loss for the trade would be very high since the range is big.
This signal should be initially be taken as an alert not to attempt a fresh long at the current level and wait for some weekly to daily time frame weak signals to take a short trade if it reverses for 1300-1200.
The pattern would become invalid above 1600. The acceleration for downside would happen once it starts sustaining below 1400 (as of now), this will keep changing week on week till the pattern is valid.

ICICI BANKHello & welcome to this analysis
A bearish Harmonic Crab pattern has been activated in the daily time frame suggesting downside levels till 1350-1300 probable if it starts sustaining below 1390 which is a line of support as of now.
Its made a gap down today, any pullback till the gap area could witness another round of selling.
The pattern negates above 1465

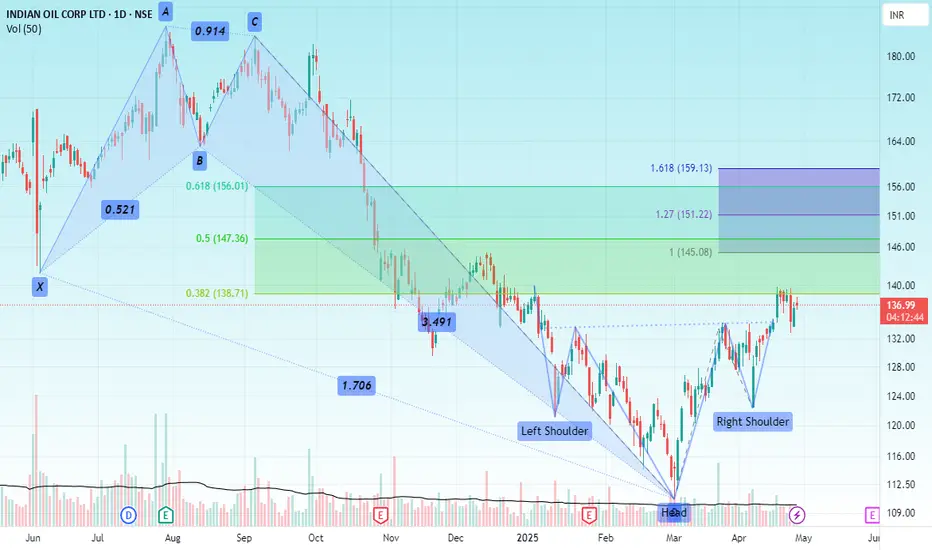
IOCHello & welcome to this analysis
A deep 6 months correction lead to the formation of a Bullish Harmonic Crab pattern in March 2025 post which during accumulation (consolidation) phase formed an Inverse Head & Shoulder.
A 38% retracement of the bullish harmonic pattern has been done and now its completing a pullback of the IHS breakout by retesting the neckline.
Potential upside levels are 145 and 160 for both the IHS & Bullish Harmonic Crab
All the best
RBL BANKHello & welcome to this analysis
Stock has activated two bullish harmonic patterns within the same potential reversal zone - Deep Crab and Bat.
As long as it holds 135 it could retest 190-200 (gap area), above that 225-235 (area of distribution before breakdown)
Decent risk reward set up for medium term perspective

GOLDHello & welcome to this analysis
Will Gold continue to surge ahead or is it set for a pullback now.
In this video I have covered the levels for Gold Comex as well as Gold MCX & Gold ETF
All the best

ZINCHello & Welcome to this analysis
A bullish harmonic Gartley has been formed suggesting upside levels of 275 - 285 as long as it does not break 257
All the best

S&PHello & welcome to this analysis
Today's gap down has covered the gap up made on 6th Nov and completed the formation of a Bullish Harmonic Gartley.
Sustaining above 5850 will confirm the reversal

TARSONS PRODUCTSHello & welcome to this analysis
A small cap stock recently listed in November 2021 has been on a downhill after making a double top in weekly time frame continuously making lower highs & lower lows.
As of now earliest sign of reversal is above 450-475 while any decline till 360-370 could find it at the support of a Bullish Harmonic ABCD pattern.
Happy Investing

NIFTYHello & welcome to this analysis
Nifty in the hourly time frame has activated a Bearish Harmonic Alt Shark with the sharp drop since opening bell today.
Now its gone onto make a Bullish Harmonic Reciprocal ABCD, however, since the drop was very sharp and its yet to do 38% of its minimum expected retracement, a confirmation for this bullish reversal will be once it starts sustaining above 22475.
Failure to hold today's low so far opens for the 38-50-62% retracement levels

DELTA CORPHello & welcome to this analysis
Stock has entered into the potential reversal zone of a Bullish Harmonic Gartley.
As long as it does not break below 98 it has the medium term potential to retest 160-250 and then maybe more.
Since this is a monthly time frame pattern, its more of an investment idea than a short term trading one.
Happy Investing

HANG SENGHello & welcome to this analysis
HANG SENG is entering the PRZ of two bullish Harmonic Trading Patterns in the monthly time frame, Cypher and Butterfly.
The index has been in a downtrend since 2017, the potential reversal zone is between 14450-13950 would also coincide with a probable parallel channel starting from 2008.
In India the Nippon India ETF Hang Seng Bee (HNGSNGBEES) is listed in BSE. One can look at it from a medium to long term investment perspective since this is a monthly reversal signal coming up.
Happy Investing

S&P 500Hello & welcome to this analysis
The index saw a super duper reversal from a Bullish Harmonic Bat in end October near 4100.
Now it has an immediate resistance coming up near 4600 where we might see some consolidation, above that it enters into the PRZ of a Bearish Harmonic Alt Shark near 4650 which could trigger some profit booking.
From 1 harmonic pattern (bullish) to another harmonic pattern (bearish)
Safe trading

NIFTY MIDCAP SELECTHello and welcome to this analysis
The index has formed a Bearish Harmonic Deep Crab in the weekly time frame. It is currently in the PRZ zone of 9050-9400.
As of now its not showing any sign of weakness. If it starts sustaining below 9050 the bearish structure would get activated for 8600/8250. There is resistance between 9200-9250. One should wait for confirmation of weakness then look to exit longs and/or fresh shorts.
Fresh aggressive trading inside the PRZ should be avoided either side.
All the best

BAJAJ FINANCE - 33% RETURNS!!!BUY - BAJAJ FINANCE LTD
CMP - Rs. 5649
Target - 1: Rs. 6880
Target - 2: Rs. 7689
.
.
Technicals - 1) Bullish Harmonic Pattern - Anti-Crab.
2) Targets set using Fibonacci Retracements.
.
.
Comment - The 2nd target will be achieved in the medium-term
.
.
Follow me for more!

A B H I T O H A U R C H A L E G ASIEMENS is on the verge of breaking above two crucial patterns on an hourly charts with good volumes:
1) triangle pattern
2) bullish butterfly
Could be bought above 3760 with mentioned stoploss & target.
