Bitcoin harmonic 73-81k bitcoin
Volume support+ harmonic shark pattern+ harmonic crab pattern complete at 81k/80k
Harmonicpattren

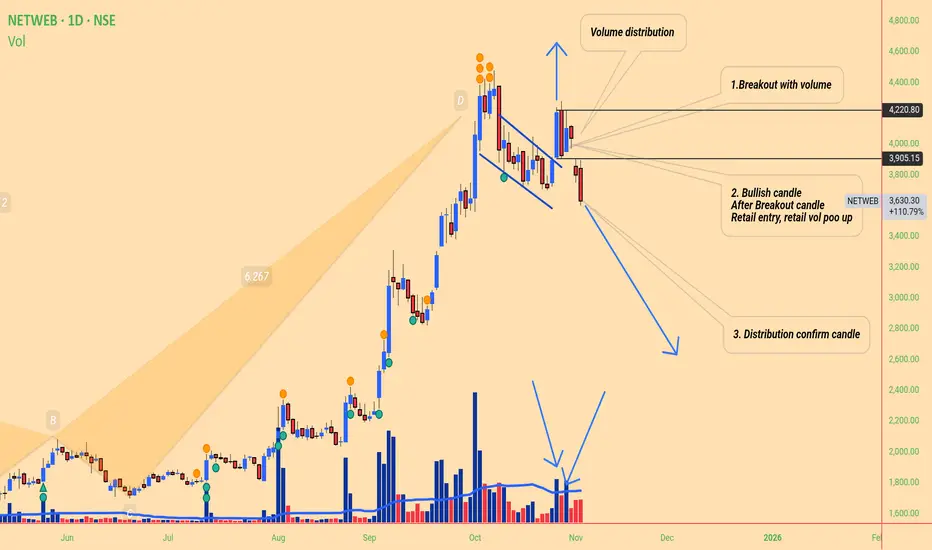
Netweb Volume distribution Technical -
Clear distribution chart , retail heavily trap show on volume, now that area work as
Trap resistance,
3 step distribution happened
1st, break out base ( Trending stock on social media ai hot sector)
2nd break out time volume that attracts retails
3nd after institute sell to retail , clear sign ( small candle show high buyer sellers active)
& Last distribution confirm low volume big red candle ( no one like to purchase that why vol big body candle confirm distribution sign)
Also harmonic pattern type 2 crab( historical pattern)
Fundamentals -
Stock trading 8 time peg ratio , 1 pEG ratio is consider fair but here it 8X
Also compared to us stock like nvidia, this stock overpriced
Also result declared that show poor
Maybe this thing tell stock created top here.......
How volume distribution looklike:
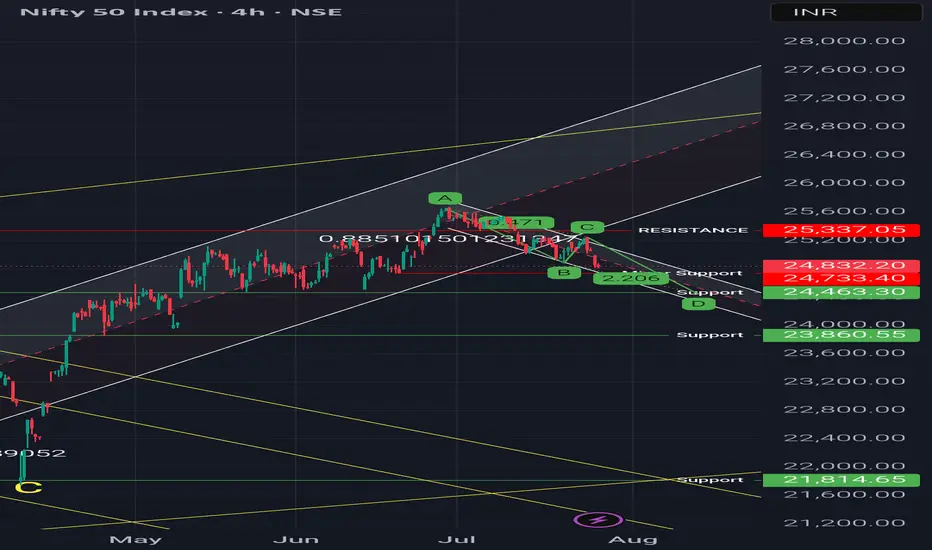
Regression channel & Harmonic pattern - Short term bearish trendObservations:
1. It is short term bearish trend as long as price holds above 24400
2. Price is below 50 DEMA
Possible Scenarios:
1. Price may attempt a mean reversion toward the median line of the channel
2. A break above could retest the 25,240–25,337 resistance zone, up move can only be considered when weekly candle will closed above that level because on weekly time frame there is 4 crows formation.
3. Harmonic patterns (1:1) suggests, the level of 24470 Support level in coming 10-15 trading days.
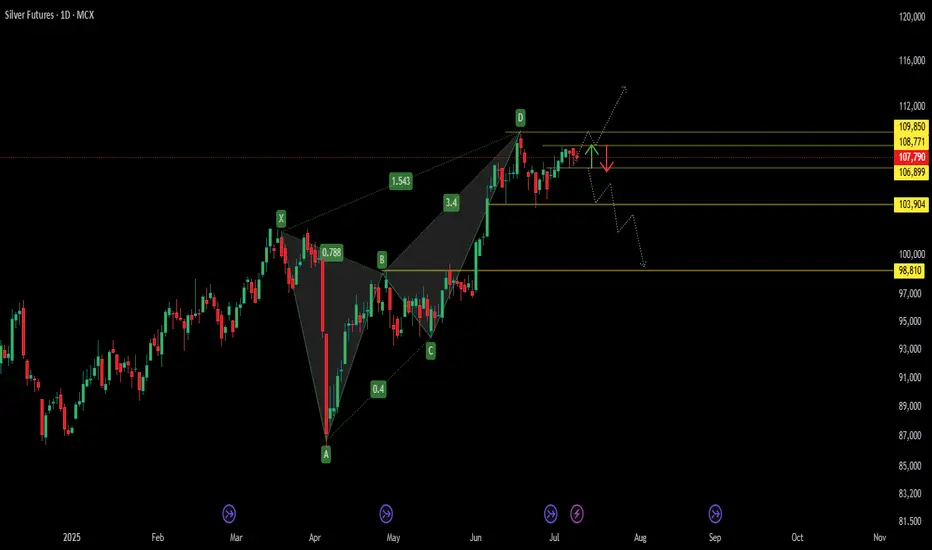
Bearish Harmonic in Play – Silver Sell Zone TriggeredBearish Harmonic in Play – MCX:SILVER1! Sell Zone Triggered 🔔
The pattern marked from X → A → B → C → D forms a Bearish Harmonic Structure , most likely a Bearish Butterfly , confirmed by key Fibonacci ratios:
* XA to AB retracement: 78.8%
* BC to CD extension: 1.543
This setup signals the formation of a Potential Reversal Zone (PRZ) near point D , where a bearish trend may initiate.
📉 Bearish Price Outlook
The dotted projection lines and red arrow illustrate the anticipated downward move:
* Price is likely to face resistance and reverse from the PRZ between ₹108,771 and ₹109,850
* A break below ₹106,899 could trigger further decline toward key support levels at ₹103,904 and ₹98,810
Gold Prices Dip Amid Trade Tensions, Bullish Outlook RemainsThe global gold price has slightly decreased, with spot gold dropping by $9.9 to $2,898.4 per ounce, while gold futures were last traded at $2,926.4 per ounce, down $7.9 from the previous early morning. This adjustment is primarily due to profit-taking pressure after gold reached record highs. However, investors remain optimistic amid rising global trade tensions, especially with the high tariffs imposed by U.S. President Donald Trump. These tariff policies are expected to continue supporting gold prices in the near future.
Despite the short-term adjustment, gold continues to receive strong support from geopolitical instability and trade wars, and it may continue its upward trend until 2025. Meanwhile, investors are awaiting comments from U.S. Federal Reserve Chairman Jerome Powell to analyze the possibility of interest rate cuts, which could boost gold prices again.
Additionally, strong buying activity from central banks and gold ETFs whenever prices drop also helps sustain the bullish trend of gold. Although gold is currently experiencing a slight decline, technical analysis suggests that this drop is temporary. With support at $2,860, gold may quickly recover and continue its upward trajectory towards the resistance level of $2,933. Investors could consider a SELL position around $2,933 and prepare for a BUY opportunity when gold returns to the support level.

Gold price today: Continues to rise across the boardGold prices today on the international market continue to rise, despite the increase in the USD value. Over the past week, gold prices have repeatedly set new records, at one point surpassing the 2,880 USD/ounce mark, approaching 3,000 USD/ounce. The main reason for this price increase is concerns about inflation. According to a report from the University of Michigan, inflation expectations for the next year have increased by 1%, prompting many investors to turn to gold as a value-preserving asset.
I believe gold is an effective tool to protect against financial fluctuations, whether inflation, deflation, or recession. Recent indicators such as the CPI and PCE in the U.S. show that inflation remains persistent. At the same time, the stock market is showing signs of weakening, and public debt continues to rise, creating a favorable environment for gold prices to continue increasing.
Looking closely at the technical chart, gold is currently in a strong upward trend with no signs of slowing down. With a solid support level at 2,853 USD/ounce, I predict that gold may continue to rise in the short term. Notably, the previous resistance at 2,880 USD/ounce has been broken, indicating a very strong upward momentum. Currently, gold is fluctuating around 2,896 USD/ounce and may soon reach the 2,900 USD/ounce mark.
In this situation, the stop loss (SL) could be set at 2,860 USD/ounce to limit risk, while the take profit (TP) could be forecasted at 2,920 USD/ounce, assuming gold continues to maintain a stable upward trend.

Gold price rises as trade war tensions remain elevatedGold continued its upward trend on Friday as the trade war between the U.S. and China escalated and the U.S. jobs report presented mixed signals. XAU/USD is currently trading at $2,862, up 0.24%.
U.S. President Donald Trump's statement regarding the plan to impose retaliatory tariffs on several countries next week provided a positive boost to the gold market. Specifically, this escalation in tensions pushed gold prices higher as the precious metal remains seen as a safe-haven asset. With solid support at 2,841, the bullish momentum for gold has been reinforced. If gold surpasses the resistance at 2,880 and conquers the 2,900-dollar mark, the next key resistance will be the psychological level of 2,950, followed by 3,000 dollars.
With this positive outlook, investors are expecting gold to maintain its upward trend in the short term. However, if gold fails to hold above the 2,841 support and reverses lower, the next support level will be at 2,800 dollars, where a slight pullback may occur before determining the next direction.

EUR/USD rises as Trump’s mild tariff plan reduces USD appealEUR/USD continues to maintain a solid upward trend above the key support level of 1.0400 in the European session on Wednesday, following a strong recovery in the North American session on Tuesday. The pair remains stable as investors assess the new tariff policies of the U.S. to adjust their positions.
Over the past two days, U.S. President Donald Trump announced a 25% tariff on imports from Mexico and Canada, and 10% on China, effective from February 1. Trump also threatened to take measures to address the U.S. trade deficit with the European Union, though he has not provided specific details. Earlier this week, Trump stated that he would tackle the issue by "increasing tariffs or requiring the EU to buy more oil and gas from the U.S."
However, these tariff threats appear less aggressive than market expectations, reducing demand for safe-haven U.S. dollars (USD). The U.S. Dollar Index (DXY), which tracks the value of the greenback against six major currencies, is currently trading near its lowest level in two weeks, around 107.90.
EUR/USD is trading steadily near its two-week high of 1.0430 in the European session on Wednesday, after rebounding from a more than two-year low of 1.0175. The pair has recovered strongly, thanks to a positive momentum divergence and price action. However, a bearish divergence signal would be confirmed if EUR/USD breaks above the immediate resistance level at 1.0440.

Harmonic Pattern Analysis of Axis Bank
Harmonic Pattern Analysis of Axis Bank.
this pattern is called as Bartley pattern as it perfectly following rules of gartely pattern.
I have marked reversal area.
Target I will comment later.. IF IT REVERSES SUCCESFULLY.
This is only for educational purpose.

DIVISLAB - CHANNEL CONSOLIDATION -WILL IT BREAKOUT OR NOTDivi's Laboratories Ltd. is an interesting chart with following
1. RSI on all time frames (i.e. D/W/M) above 60
2. Narrowing Bollinger Bands on daily chart with price walking on upper band
3. Two month's long consolidation of price in rectangular range of 5675 to 6300 levels and once price breaks out of this range, momentum will increase
4. ABCD pattern under formation on weekly chart
5. Major price supports at 5930 i.e. 20 Day SMA and 5750 i.e. 50 EMA respectively
Breakout of 6300 + levels on closing basis can fetch 6700 + and 6980 levels as per Fibonacci projection tool
Lets see How it evolves
Disclaimer: NOT A BUY / SELL RECOMMENDATION I am not an expert I just share interesting charts here for educational purpose and not to be taken as buy/sell recommendation. Please seek expert opinion before investing and trading as trading/ investing in market is subject to market risks. I do not hold any position in the stock as on date but I may look to take some position with my own Risk Reward matrix.

NITFY 15 mins Bearish Harmonic PatternHello everyone,
Nifty form Bearish Harmonic reversal pattern spot 23485 can go down till 23200 upcoming election event and us dollar at lifetime high so expecting high volatality.

#NIFTY - 14TH NOVEMBER NSE:NIFTY
#NIFTY ⚡
Observe, understand, then implement 👍🏻
Chart contains support and resistance levels (understand how it works 👇🏻)
Support and resistance are key concepts in technical analysis used to identify potential price levels where assets may reverse or stall.
Support:
-Definition: A support level is a price point where buying interest is strong enough to overcome selling pressure, preventing the price from falling further.
- Indicators: Support levels can be identified through historical price data, trend lines, or moving averages.
- Behavior: When a price approaches support, it may bounce back up. If broken, it can become a new resistance level.
Resistance:
- Definition: A resistance level is a price point where selling interest is strong enough to overcome buying pressure, preventing the price from rising further.
- Indicators: Similar to support, resistance levels can be identified through past price action, trend lines, or moving averages.
- Behavior: When the price approaches resistance, it may retreat. If broken, it can turn into a new support level.
Importance:
- Trade Decisions: Traders use these levels to make buy or sell decisions, set stop-loss orders, and identify potential profit targets.
- Market Psychology: Support and resistance levels reflect market sentiment and the balance between supply and demand.
Understanding these concepts can enhance trading strategies and improve decision-making.
P.S note : im not SEBI REGISTRAR 🙏🏻
Any doubt 👉🏻 @thetradeforecast

AARTI INDUSTRIES TECHNICAL VIEWThis is my view on Aarti Industries based on harmonic patterns.
On daily time frame Gartely pattern is visible, along with that bullish pattern is seen, 2 targets have identified, lets see how it goes.
Thank u, This is just my view and not recommendation for trade.
Please trade with the help of your financial advisor.
#aartiindustries #harmonicpatterns #technicalanalysis

Bitcoin bought - 1 hour Bearish Butterfly will complete @ 73500-Bitcoin bought - 1 hour Bearish Butterfly will complete @ 73500-73800 $ range
CMP 69679
Targets looking for 71472- 72645- 73700-74500+
SL below 68400 (Candle closing basis 1 hour)
Holding period - 1-2 week
Only for Education Purpose

HIndalco Harmonic pattern analysisIf current breakout sustains then immediate target will be 838 which is 1.618 fib ext of XA wave.
This zone is also Potential reverse zone(PRZ)Target i will update later.
#harmonicpatternanalysis #harmonic trading

Coal India - Looks good at bottom outAs per harmonic pattern, it's making a bullish butterfly pattern and good to buy.
CD leg projection is going to 1.618 or 2.618. So we can see these two ratio as our target.
XD ratio is ~0.827, so as per technical analysis, it should go to 1.618 or 2.618.
Company's fundamentals are good, so next 3-4 months will give our target.

CYIENT LTD READY FOR A BLAST!NSE:CYIENT
Cyient Ltd Analysis:
Current Market Price (CMP): 2005
The stock is forming a Darvas Box pattern, indicating a potential breakout. A move above 2056 could trigger further upside momentum.
Buy Range: 2000-2050
Upside Targets: 2189, 2200, 2400
Support Level: 1944
Watch for a breakout above 2056, with potential upside targets ahead. Support is at 1944 for downside protection.
Disclaimer: This analysis is for educational purposes only. Conduct your own research before trading.

XAUUSD GOLD AT MAKE OR BREAK LEVEL!!FOREXCOM:XAUUSD
XAUUSD (GOLD) Analysis
Current Market Price (CMP): 2503.44
Time Frame: 15 minutes
Market Outlook:
Gold is currently positioned near a critical level, with potential for further upward movement. A key resistance level at 2505 may be tested. If the price holds above this level, there is potential for further gains towards 2510, 2515, 2520, 2525, 2530, and 2545.
Key Levels to Watch:
Resistance Levels: 2505, 2510, 2515, 2520, 2525, 2530, 2545
Support Zone: 2499 - 2497
Potential Buying Opportunity: Around 2499 to 2497
Major Support Level: 2495
A break below this level could lead to a bearish move towards 2487.
If 2487 is broken, the setup may turn bearish for the upcoming week.
Conclusion:
Traders should mark these levels on their charts and be prepared for both bullish and bearish scenarios. Consider buying near the support zone between 2499 and 2497 for potential upside gains, while keeping an eye on 2487 as a crucial level for potential bearish reversal.
Disclaimer:
This analysis is for educational purposes only and is not financial advice. Please conduct your own research before making any trading decisions.

PLASTIBLEN - A CONSOLIDATION BREAKOUT WILL IT SUSTAIN OR FIZZLE RSI on all time frames above 60
Price breakout with high volume
ABCD pattern under formation on weekly charts
Narrowing Bollinger Bands on weekly and daily charts
Price moving on upper Band
Major support 282- 308 zone
Lets See How it Evolves.
Disclaimer: NOT A BUY / SELL RECOMMENDATION I am not an expert I just share interesting charts here for educational purpose and not to be taken as buy/sell recommendation. Please seek expert opinion before investing and trading as trading/ investing in market is subject to market risks. I do not hold any position in the stock as on date but I may look to buy on dips with my own Risk Reward matrix.

FINNIFTY (CNXFINANCE) - A BEARISH CYPHER PATTERN FORMED. NSE:CNXFINANCE
❇️Harmonic chart pattern: BEARISH CYPHER PATTERN
👉🏻The Cypher pattern is one of the most profitable harmonic patterns and is useful for risk management, because of the large success rate. Traders can minimize losses if they follow the Cypher trading rules and meet the profit target.
🚀How to use
❇️The Cypher harmonic pattern is a trading strategy that uses Fibonacci numbers to identify turning points in geometric price patterns. It can help traders predict future movements, determine when trends will reverse, and decide when to buy and sell. Here are some steps for using the Cypher pattern:
❇️1. Draw the patterns
👉🏻Start with a bullish or bearish impulsive move from point X to A. Then, use a Fibonacci retracement tool to find point B between 38.2% and 61.8% of XA, without closing past 61.8%. Next, use a Fibonacci expansion tool to find point C between 127.2% and 141.4% of the move from X to A, without closing past 141.4%. Finally, use a Fibonacci retracement tool to find point D by moving from X to C and reaching the 78.6% region. You can also use a Fibonacci expansion tool to find point D by moving from B to C and landing between 127.2% and 200%.
❇️2. Enter the pattern
👉🏻Traders can enter a Cypher pattern by setting a limit order at the 78.6% level or using a market order after the price starts to reverse.
❇️3. Set stop losses
👉🏻For a bearish Cypher, place stop losses just above point X. For a bullish Cypher, place stop losses just below point X.
❇️4. Set take profits
👉🏻Draw a Fibonacci extension from point C to point D and set multiple take profits. For example, you could set the first take profit at Fibonacci one, the second at 1.272, and the third at 1.618. You can break into the trade when any of the take profits are hit. Many traders partially close their position at point A, but you can also choose point C for a more aggressive approach
ENTRY STATUS: ACTIVE ✅
TARGET 23440-23140-22555 (as per this harmonic chart pattern)
SL 23670
🚀Happy trading 🫡
👉🏻 @thetradeforecast🇮🇳

Crab breakout in TitanHigh probability trade setup
Clear breakout and price also closed above the previous swing. This indicates that the price will move up in forthcoming days. This is for educational purposes only.

ETHUSD LOOKS BULLISH ABOVE THE CONSOLIDATION ZONEas per the harmonic pattern and price action setup above the consolidation zone, prices should shoot up in ETHUSD. #bullishview

GRASIM - FUTGRASIM - Stock trying to broken 45 degree support trend line. 2320 is support and 2405 resistance. Expected PRZs are 2228, 2191, 2150.
