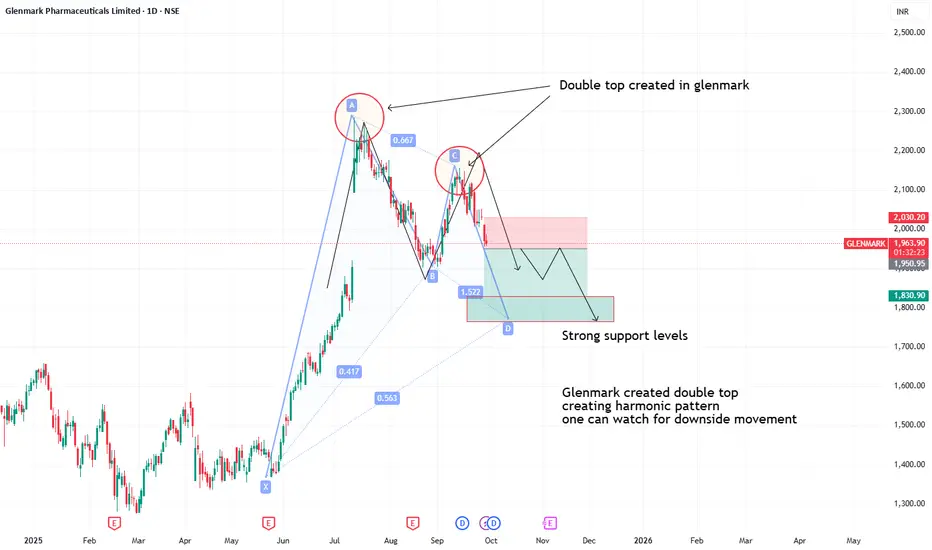
Double top formation seen in glenmark- Glenmark created double top
- creating harmonic pattern
- one can watch for downside movement
- stock may give big move downside if nifty continues to fall
Harmonicsignals
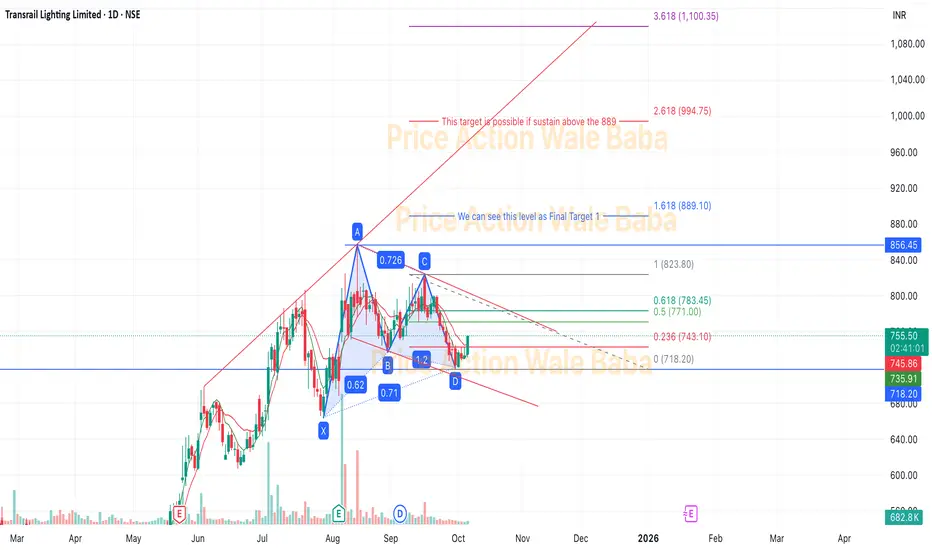
Transrail Lighting LtdTransrail Lighting Ltd is near support level and making a butterfly pattern.
Here, Fibonacci levels are applied. So, If it breaks the ratio of 0.5 & 0.618, we will see 1.0
Based on ratio you can see target level in the chart.
As per fundamentals theory, 0.5 and 0.618 are strong resistance, once sustain above this it will touch to 1.0 and 1.618. So accumulate on every dip.
Also, this stock has took support from the all time high level. It had given the breakout earlier and give some upside movement, now taking support from that ATH level and ready to go up.
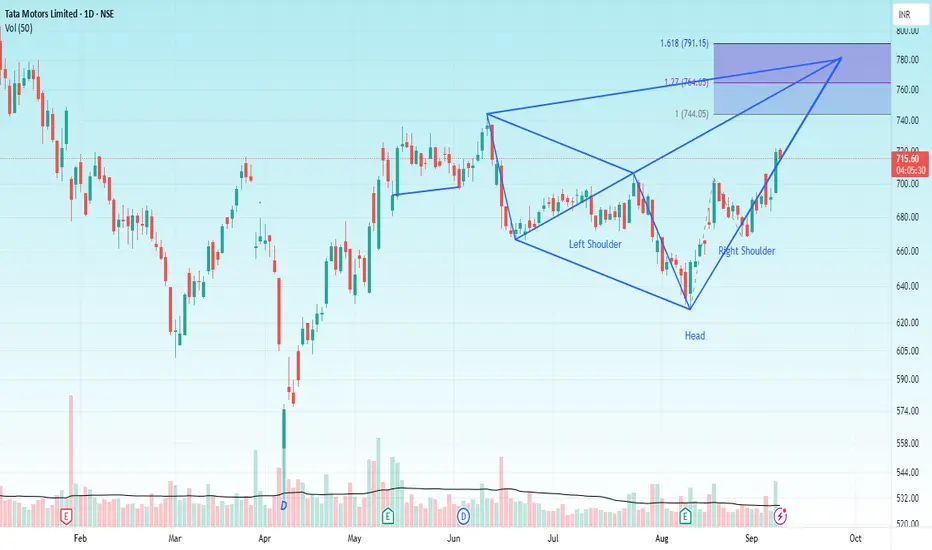
TATA MOTORS Hello & welcome to this analysis
The stock in daily time frame has given a double breakout
Inverse Head & Shoulder
Bullish Harmonic Seahorse
The upside levels as per IHS are 740 & 790 while the Seahorse pattern is indicating 775.
Both patterns have strong support at 690-700 and both would be considered invalid below 665
All the best
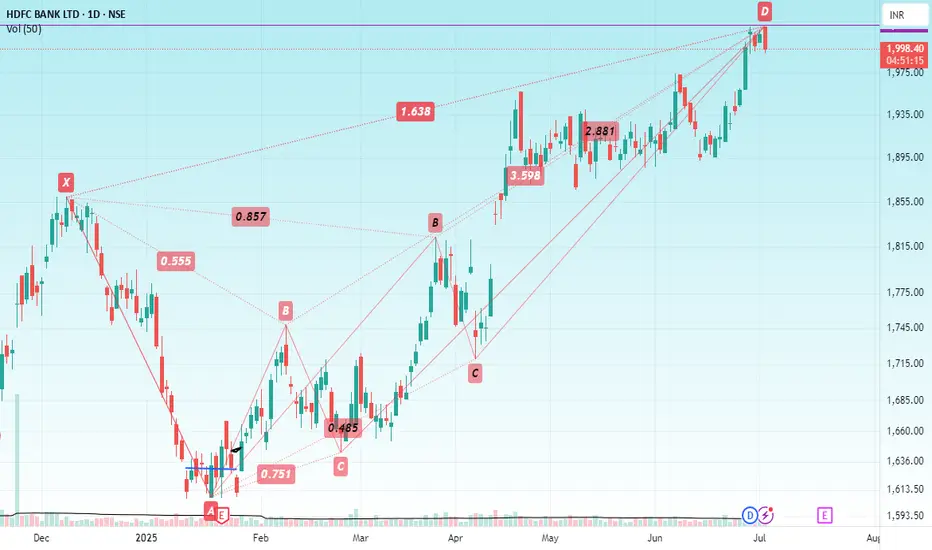
HDFC BANKHello & welcome to this analysis
It has made double bearish Harmonic patterns at the same PRZ level - Crab & Deep Crab in the daily time frame with so far today's candle being an Open = High in daily time frame.
A retracement till 1950 - 1875 could be possible as long as the stock does not cross 2050.
A heavyweight in both Nifty & Bank Nifty, it could halt the uptrend of both the indexes either till it does not complete its pullback or the patterns get negated.
All the best
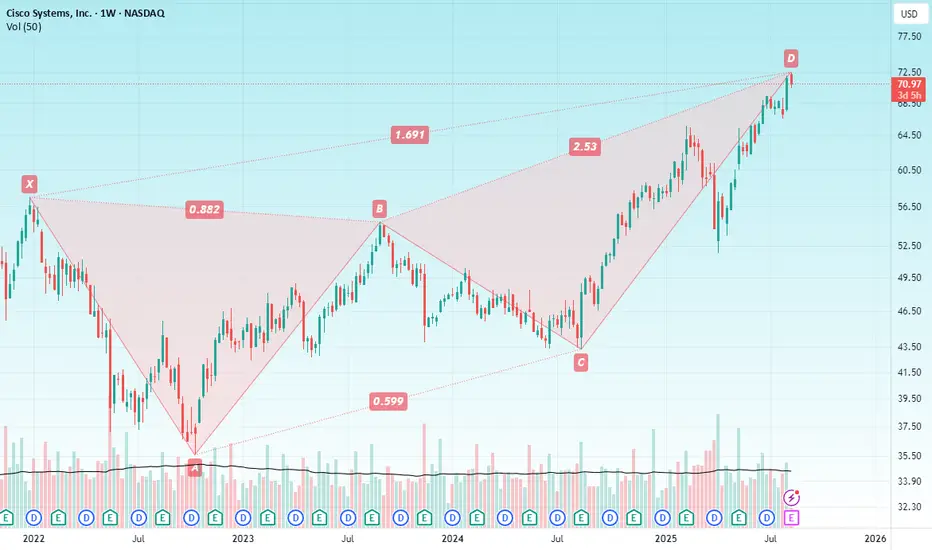
CISCO SYSTEMSHello & welcome to this analysis
In weekly time frame it has activated a bearish Harmonic Deep Crab pattern suggesting likely pullback to $65 and below that $57.
The pattern would be considered invalid above $77
All the best
GOLDHello & welcome to this analysis
In 4hrs time frame GOLD (MCX) has activated a bearish Harmonic Bat pattern.
It could retrace down to 99500 - 98500, will consider 100750 as stop loss for this set up.
Do keep in mind, GOLD overall is very strong and this could likely be a shallow retracement.
Regards

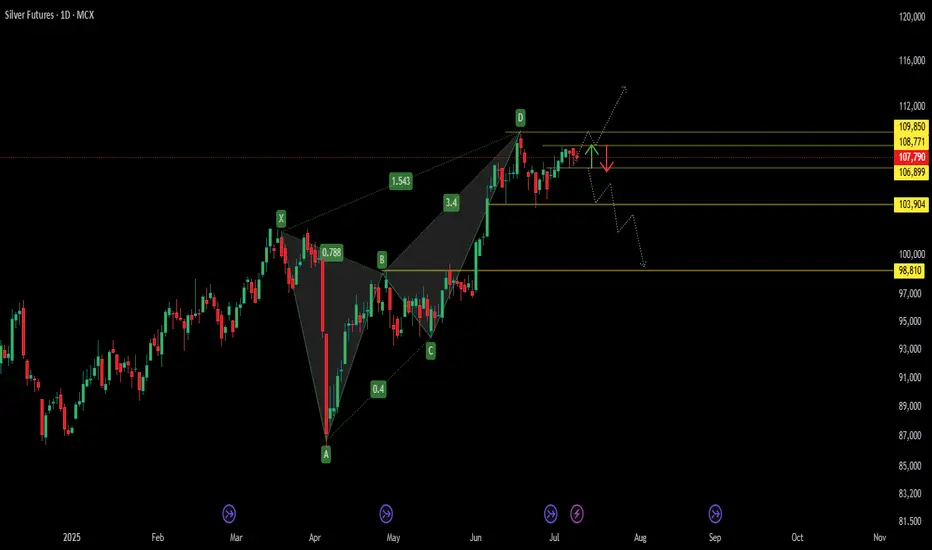
Bearish Harmonic in Play – Silver Sell Zone TriggeredBearish Harmonic in Play – MCX:SILVER1! Sell Zone Triggered 🔔
The pattern marked from X → A → B → C → D forms a Bearish Harmonic Structure , most likely a Bearish Butterfly , confirmed by key Fibonacci ratios:
* XA to AB retracement: 78.8%
* BC to CD extension: 1.543
This setup signals the formation of a Potential Reversal Zone (PRZ) near point D , where a bearish trend may initiate.
📉 Bearish Price Outlook
The dotted projection lines and red arrow illustrate the anticipated downward move:
* Price is likely to face resistance and reverse from the PRZ between ₹108,771 and ₹109,850
* A break below ₹106,899 could trigger further decline toward key support levels at ₹103,904 and ₹98,810
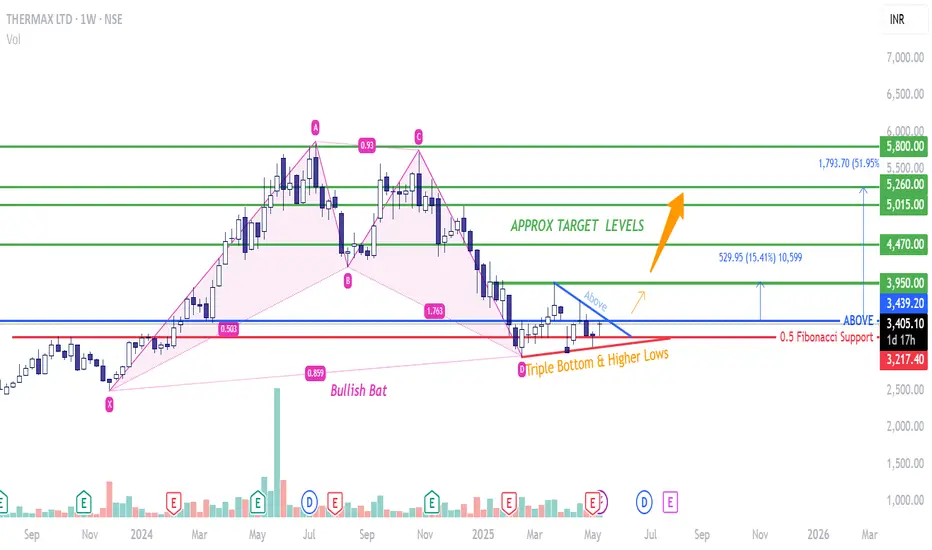
THERMAX - Bullish Bat -Bullish Bat is a harmonic pattern as shown in pink.
-Usually, during the base formation post making a Bullish bat pattern, a lot of big players accumulate which is then followed by a sudden spurt in prices.
- I see a triple bottom being made in an upward trend line suggesting Higher Lows.
- The base length can vary depending on the market scenarios. Patience is required in this kind of bamboo shoot stories.
- Here the base pattern suggests a symmetrical triangle is being formed. Too early to claim but so far looks like one. Hoping for a supersonic breakout from a symmetrical triangle pattern and a harmonic pattern.
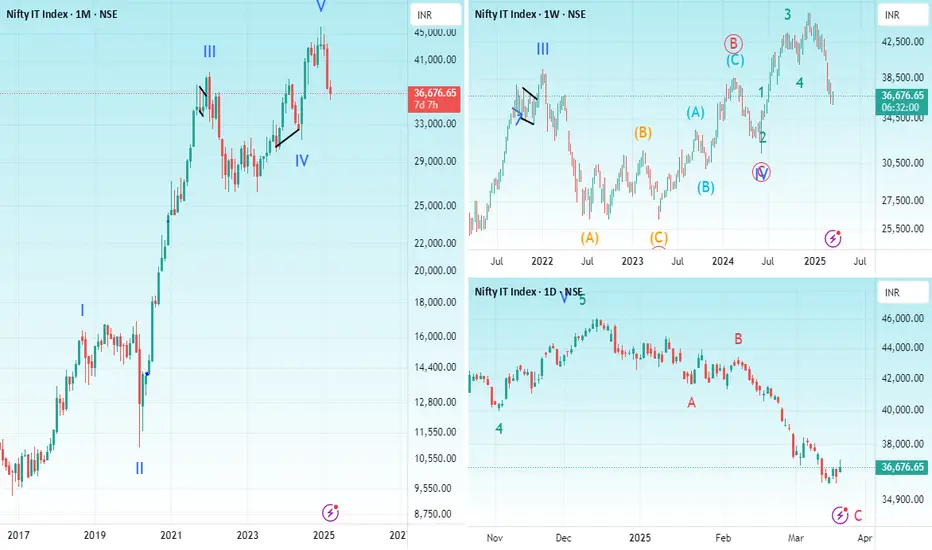
NIFTY ITHello & welcome to this analysis
NIFTY IT (CNXIT) appears to have completed in
Monthly from 2016 lows an impulse 5 waves up
Weekly shows a running flat wave 4 followed by sub waves of the terminal 5th wave
Daily indicates post the impulse an ABC corrective ended (ending)
is this A of abc down after a monthly 5 up or is it wave 2 complete with this ABC?
It is too early to say the latter. Normally the corrective tends to retest the start of the preceding sub wave 4 that is around 31000 but that is not mandatory as per Elliott Wave rules.
An early indication of which wave is unfolding will depend on how the sub waves come out now, either they will be corrective, then it would be B of abc or they will be impulse then wave 2 has ended and index is into Wave 3.
Interesting days ahead for IT index
All the best
USDJPYHello & welcome to this analysis
It failed to reverse from the Bullish Harmonic Cypher pattern.
Now next bullish harmonic pattern is the Alt Shark at 137.75 while 141.80 appears to be a very strong resistance now

BOSCH, SAMVARDHNA MOTHERSON & SONA BLWHello & welcome to this analysis
Auto ancillary stocks at strong support levels suggesting a bounce/reversal from current levels with them forming Bullish Harmonic Patterns in weekly time frame
BOSCH - Alt Shark
MOTHERSON - Alt Shark
SONACOM - Cypher
Today's candle were very strong, one can look to add on follow through confirmation or on pullback, the risk reward appears decent at current levels.
In the video I have suggested possible levels of resistance on upside along with negation levels on the downside for each case.
All the best

NiftyHello & welcome to this analysis
The index which attempted a bounce on Tuesday failed to breach above 23250, today it is again witnessing selling pressure.
A bullish Harmonic Alt Shark could pause/stop this decline near 22675 which is the lower trendline of a falling channel apart from it being the monthly Ichimoku support area.
Further decline could take it to 22400 where it has a Bullish Harmonic Gartley.
Short covering as of now is appears to be only above 23175
The risk reward going forward still remains in favour of short side trades

S&PHello & welcome to this analysis
Today's gap down has covered the gap up made on 6th Nov and completed the formation of a Bullish Harmonic Gartley.
Sustaining above 5850 will confirm the reversal

Finolex Industries LTD view based on harmonic patternsMy view on Finolex Industries LTD, as you can see there is nice gartely pattern has been formed , alongwith that it has got support at 0.78% fib level.
Based on FIB level , target is marked and SL is also placed.
So, lets look how it turns.
Thank you.
#finolexindustries #harmonicpatterns #finolex #harmonictrader

IOCHello & welcome to this analysis
Stock in weekly has made a double top formation. Failure to hold 130 could take it down to 90 which is its breakout area.
Short covering above 142 with resistance at 150 in the short term and 180 in the medium term
Happy investing and good luck with your trading

NITFY 15 mins Bearish Harmonic PatternHello everyone,
Nifty form Bearish Harmonic reversal pattern spot 23485 can go down till 23200 upcoming election event and us dollar at lifetime high so expecting high volatality.

BTCUSD Bearish harmonic Pattern_BITCOINHello Everyone,
BTCUSD_ bitcoin has formed bearsih harmonic pattern, with RSI negative Divergence.
price Rise nearly 20% in just 1 week of US election CMP 85500 lifetime high of bitcoin.

Long Reliance Industries Between 2585 - 2660 Target 3500Reliance forming bullish Butterfly Harmonic Pattern on weekly charts and going no where up till November 20th. Good Time to accumulate.
Targets marked on charts with horizontal line. Once point B is breached and closed then rally will start.
Few triggers -
Giga factory opening in December.
JIO price hike effect
Hydrogen plant
Windfall tax removal effect
No stop loss as fall is limited.

Crab breakout in TitanHigh probability trade setup
Clear breakout and price also closed above the previous swing. This indicates that the price will move up in forthcoming days. This is for educational purposes only.

NAZARA TECHHello & welcome to this analysis
Stock is moving withing a weekly parallel channel. Swing lows had formed a Bullish Harmonic Cypher pattern.
Short term resistance 980 and support at 900.
Medium term v strong support at 800-775 for possible upside levels of 1125-1300-1500
Happy Investing

Stock Market Analysis Report: Lupin Limited (NSE: LUPIN)
Introduction
Greetings, traders! If you're looking for a pharmaceutical stock that might just cure your portfolio blues, look no further than Lupin Limited. This stock is brewing up an interesting pattern that’s worth a closer look. Let’s dive into the technical details and see what’s in store!
Price Action Overview
Chart Analysis
Current Price: ₹1,759.30
Daily High: ₹1,767.00
Daily Low: ₹1,598.25
Volume: 10.039M
Key Technical Indicators
Bearish Gartley Pattern: The chart reveals a bearish Gartley pattern, suggesting a potential reversal.
Rectangle Pattern with Potential False Breakout: The price is within a rectangle pattern, hinting at a potential false breakout.
Decreasing Volume: The volume is on a decline, which could signal weakening momentum.
Detailed Analysis
Bearish Gartley Pattern
Formation: The Bearish Gartley pattern, marked by points X, A, B, C, and D, indicates a potential reversal from the current uptrend.
Implications: This pattern suggests that the stock might face resistance at the current levels and could potentially see a pullback.
Rectangle Pattern with Potential False Breakout
Rectangle Pattern: The stock price is trading within a rectangle pattern, showing consolidation between support and resistance levels.
False Breakout: The current breakout might be a false one, as indicated by the rectangle pattern and the resistance at point D.
Decreasing Volume
Volume Trend: The decreasing volume trend suggests that the current upward momentum might be losing steam.
Significance: Lower volume during a breakout can indicate a lack of strong buying interest, increasing the chances of a reversal.
Price Targets and Support Levels
Immediate Resistance: ₹1,800.00 - This is the next resistance level to watch closely.
Support Levels:
Primary Support: ₹1,600.00 - A key level to maintain for bullish sentiment.
Secondary Support: ₹1,400.00 - A more conservative support level aligning with previous consolidation areas.
💊📉
Conclusion
Lupin Limited is showing a bearish Gartley pattern with a potential false breakout within a rectangle pattern. The decreasing volume adds caution to the current bullish momentum. Keep an eye on the resistance level at ₹1,800.00 and monitor the volume to gauge the strength of the current trend. Happy trading, and may your portfolio stay healthy and robust! 🌿💰
Disclaimer
This analysis is based on historical data and chart patterns. Always do your own research and consider your risk tolerance before making any investment decisions.

S&PHello & welcome to this analysis
S&P has entered the PRZ of a bearish Harmonic ABCD pattern. It gets activated below 5175 and negated above 5210
A reversal from here could form a lower high in the index

NIFTYHello & welcome to this analysis
Nifty in the hourly time frame has activated a Bearish Harmonic Alt Shark with the sharp drop since opening bell today.
Now its gone onto make a Bullish Harmonic Reciprocal ABCD, however, since the drop was very sharp and its yet to do 38% of its minimum expected retracement, a confirmation for this bullish reversal will be once it starts sustaining above 22475.
Failure to hold today's low so far opens for the 38-50-62% retracement levels
