HAVELLS


Stock Analysis of Havells Ltd.Price - ₹727.90 Dt. - 31-10-2020
Stock is in the uptrend from late May. On a daily chart, the stock is consolidating near the support line placed at ₹709.65. In 2 or 3 trading sessions the stock can take the support of trendline and can resume the up move. Apart from the trend line, the stock will also take the support of 21DEMA. Price if move in the up direction as per the expectation then it can give nice 10% profit in the few weeks. RSI is near the 70 levels.

Havells on bullish mode.Havells stock forming higher highs & lower highs in great uptrend. New 52 week high . Long above 700 for the target price of 715-730 with SL 682. This is for your educational purpose only.

Havells India Ltd Technical Analysis .Hello friends , Today i have the technical chart Of Havells India Ltd . Friends as you can see here that it was in a up trend but now it can go down because it is making a " Rising wedge " and Also Making Bullish Harami Candle Stick Pattern Which shows that i could be right at here . But remember that it can break upper trend line from where i have shown down because it will be a False Breakout and if you buy at there the trade can be in profit for 5 - 6 day After than it can be in loss because it can go down from there and also remember it will go first and then up from the Resistance it can go down as shown in the picture ,Thus it is also near the breakout point .Its Support price you can see that it is on its support and its target you can take for is at Rs 680 and if it goes down how i have shown so the stoploss you can take is at Rs 442.90 and remember to read out the notes and other things written on the chart and i have showed the nearby support you should also see the marked Supports and Resistances on the chart and Please give your Precious time and like all my ideas so that i can know that you like my ideas which i publish and my channel
To like my all ideas just click on my channel name you can see it with picture and then like my ideas .
Thank You . If you like this Idea and this Analysis just please like this idea and leave a comment i will surely try to improve it or if you have any doubt related to this you can write in the comment box also . Bye Bye .

HAVELLS- Rising wedgeStock seems to be taking support at 50ema in daily timeframe.
Close below 50ema (daily timeframe) can be used as SL.


Interesting Horn like patternidk, what it signifies, maybe a breakout, can anyone through some light on this, I'm assuming a bearish breakout, anyone !!! ?

#Oct13 - HAVELLS (intraday)The stock has been trapped in a channel for a long time. Last day, it broke out of the pattern and also retested the trendline today, so we can see trend continuation next. The bullish trend will be confirmed if the latest high of 710.5 is broken. This is an intraday as well as swing pick from my side. Also note that trend reversal can happen from resistance.
Buy above 710.5
Sell below 702
Note:
Avoid the stock if a big gap up or gap down is seen
Enter after the breakout happens and not before it
Do not chase the market, i.e., do not get involved in late entries
Only enter with strict stop-loss and target
This is not a recommendation and is for educational purposes only.
always follow risk-reward and quantity management for the 100% of the times
The above mentioned idea may not work, so beware of the risk you are taking
Follow me on tradingview to get such intraday and swing picks everyday.
Happy Trading!!

Havells - Ascending Triangle Bullish breakoutNote: This is for educational purpose only. Please do not trade in F&O based on this analysis.
There is an ascending triangle bullish breakout with ultra high volume. Moreover, there seems a trend line breakout in RSI as well. RSI above 65 indicates bullish momentum.

#Oct12 - HAVELLS (intraday+swing)The stock has been trapped in a channel for a long time. Last day, it broke out of the pattern and also retested the trendline. The trend will be confirmed if the latest high of 710.5 is broken. This is an intraday as well as swing pick from my side.
Note:
Avoid the stock if a big gap up or gap down is seen
Enter after the breakout happens and not before it
Do not chase the market, i.e., do not get involved in late entries
Only enter with strict stop-loss and target
This is not a recommendation and is for educational purposes only.
always follow risk-reward and quantity management for the 100% of the times
The above mentioned idea may not work, so beware of the risk you are taking


HAVELLSIm not an expert im just sharing my views on HAVELLS for tomorrow
Im not responsible for any profit or loss this is not a recommendation


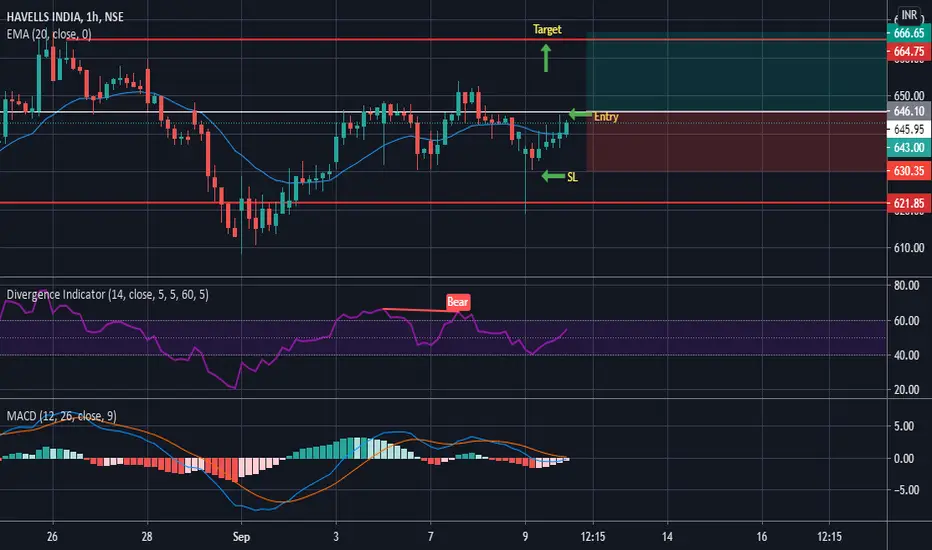
Havells on breakout level ready.Stock of Havells is at BO level & forming the higher highs. We can see the double bottom is forming on the charts & stock is trading above the 20 EMA level. Here we have good reward to risk ratio as 1:3. Divergence sign is also in bullish mode. Long entry can be taken above the price of 645 after the BO of resit.level for the next target price of 665 with the SL of 628. So add the stock in your watch list to see the price action movement of the stock.
Always do trading as per your Reward to Risk ratio means Never risk more than you can afford to lose on a single trade. Please keep patience & wait for the levels means Sit and wait for the right opportunity. Request to like & follow for more such ideas of technical analysis learning.The idea sharing is for educational purpose only. In case any suggestion advice required feel free to ask.
BUY HAVELLS FOR TARGET OF 800 LONG TERMCURRENT PRICE 640
BUY FOR A TARGET OF 800 ( 25%)
STOPLOSS 595 ( 7%)
GAIN OF 25% LOSS OF 7%

Havells longs position !HAVELLS looks good on charts above 620 levels one can bet for short term immediate target 650/- with stop loss of 600. long positional for target of 710/-

Havells go long from 604-607 levels - Bullish pattern formedHavells go long from 604-607 levels - Bullish pattern formed
603 is an important resistance and will reverse from this point
only take teh trade if no gapup opening tommorow

Havells on breakout level ready.Havells share trading in the side ways & in channel zone. After the BO of TL as well as the Resist.level above the price of 621 for the target price of 645-648 with the SL of 604. So keep SL trailing . Levels are marked in the charts. So add the stock in your watch list to see the price action movement of the stock.
Always do trading as per your Reward to Risk ratio means Never risk more than you can afford to lose on a single trade. Please keep patience & wait for the levels means Sit and wait for the right opportunity. Request to like & follow for more such ideas of technical analysis learning.The idea sharing is for educational purpose only. In case any suggestion advice required feel free to ask.
Watch the free trading ideas performance sheet for the month of July-2020
drive.google.com
