Riding the Highs: Analysis of Havells' BreakthroughNSE:HAVELLS , a renowned player in the electrical equipment industry, has recently made waves in the stock market with its impressive performance. On February 27th, exactly two months ago, Havells broke out of its all-time high, surpassing strong previous resistance levels. This initial breakout was supported by robust trading volumes, indicating a strong buy-in from the market.
📊 Analysis
All-Time High Breakout : Initially, Havells made a significant leap by breaking its all-time high, which had acted as a robust resistance in the past.
Consolidation and Support : Following the breakout, the stock experienced a consolidation phase for about two months. During this period, it successfully tested the previous resistance, turned support, multiple times.
Formation of a Rectangle Pattern : In the recent trading sessions, Havells has formed a rectangle pattern within this consolidation phase. This pattern typically indicates a continuation in the direction of the prior trend.
Breakout with Volume : Just today, Havells broke out from the rectangle pattern and recorded a new all-time high, again accompanied by strong trading volumes. This suggests a renewal of investor interest and a potential upward trajectory.
Trading Insights
Given the recent breakout with considerable volume and the stock setting new highs, traders might consider this an opportune moment to look into initiating buy positions.
Lastly, Thank you for your support, your likes & comments. Feel free to ask if you have questions.
"In the waves of change, we find our true direction."
Note : This analysis is purely for educational purposes and is not intended as a trading or investment recommendation, as I am not a SEBI registered Analyst.
HAVELLS

Monthly time frame breakout idea on Havells I make educational content videos for swing / positional trading

Havells Swing Trade -Weekly Timeframe is bullish
-Daily Timeframe and 4HR has tested it's structure
-50 ema is near the base as a confluence
-Stock is within 10% range of the all time high

Symmetrical Triangle and Pull back Pattern seen in Havells.Hello Traders & Investors,
I have brought another analysis on Symmetrical triangle pattern breakout. Well this almost similar to Triangle pattern, but in this lower band trendline act upward sloping support in security. Same we have seen in Havells. Well there is higher Chances that we can see huge momentum in coming few weeks. So let's go, i will explain a bit about this pattern so you guy's can understand and trade easily whenever you see this pattern next time.
Q:- What is Symmetrical Triangle Pattern?
Rahul:- A symmetrical triangle is a chart formation where the slope of the price’s highs and the slope of the price’s lows converge together to a point where it looks like a triangle.
Q:- Which direction will it go?
Rahul:- If the prior trend is Uptrend then buyers gonna to win the battles for sure.
Q:- How and when to Trade?
Rahul:- Guy's keep in mind when both slopes get closer to each other, it means that a breakout is getting near, and we just have to wait for that breakout to take place. You can take entry once you see successfully breakout and keep stop loss at lower band of the Triangle, and there could be another entry once price shows pull back towards breakout zone. Targets can be place at all time high and 2nd target can be length of Triangle pattern.
So guy's i hope you have learned this Symmetrical Triangle Pattern now.
Let's Focus About Company background:-
Havells India Limited is a leading Fast Moving Electrical Goods (FMEG) Company and a major power distribution equipment manufacturer with a strong global presence.
It enjoys enviable market dominance across a wide spectrum of products, including Industrial & Domestic Circuit Protection Devices, Cables & Wires, Motors, Fans, Modular Switches, Home Appliances, Air Conditioners, Electric Water Heaters, Power Capacitors, Luminaires for Domestic, Commercial and Industrial Applications.
Market Cap
₹ 87,271 Cr.
Current Price
₹ 1,393
High / Low
₹ 1,466 / 1,024
Stock P/E
78.2
Book Value
₹ 106
Dividend Yield
0.54 %
ROCE
22.3 %
ROE
17.0 %
Face Value
₹ 1.00
Debt
₹ 223 Cr.
EPS
₹ 17.8
PEG Ratio
7.74
Promoter holding
59.4 %
Intrinsic Value
₹ 442
Pledged percentage
0.00 %
EVEBITDA
46.7
PROS
Company has reduced debt.
Company is almost debt free.
Company has been maintaining a healthy dividend payout of 40.7%
CONS
Stock is trading at 13.2 times its book value
Disclaimer:- Please always do your own analysis or consult with your financial advisor before taking any kind of trades.
Dear traders, If you like my work then do not forget to hit like and follow me, and guy's let me know what do you think about this idea in comment box, i would be love to reply all of you guy's.
Thankyou

HAVELLS formed inverted head and shoulder's pattern in day candlThe view is only for educational purpose.
Inverse head and shoulder pattern formed
Entry - 1350
Target - 1453
SL - 1300

4 Beautiful Swing trade ideas for 11 Sep Markets I daily make educational content videos for swing / positional trading


HAVELLS C&H BREAKOUTHAVELLS breaking C&H pattern
huge volume
trading above all key ema
educatinal idea

Breakout soon in Havells.As we can see from the chart havells india looks promising in weekly timeframe. It has been consolidating within a demand and supply zone for the past 28 months, forming a rectangle channel pattern.
Today, it has reached the resistance level with a good amount of trading volume. This increases the likelihood of a breakout. However, there are a few things to consider before investing. We should wait for the price to break out with even stronger trading volume and stay above the 1400 level before entering a trade.
To manage our risk, we can aim for a 10% gain in the trade while setting a 10% stop loss. Why bigger stop loss?, because stocks might show 'fake-out' and falls back at first go and again give breakout. By doing that we can remain in this trade.
Note- You can use your strategy and then dive into the trade, that is the only thing that can make you profitable. Do not seek any tips and trade calls from others. It was all for educational purpose.


beautiful chart HAVELLS is now eyeing a breakout
its near all time high
strong base formation on downside
healthy consolidation

EXCITING BULLISH PATTERN📈 Exciting Bullish Pattern Alert! 🐂
📊 Pattern: Rising Wedge
📌 Symbol/Asset: HAVELLS
🔍 Description:
Moment Stock with hourly Support.
👉 Remember: Technical patterns are just one piece of the puzzle. Consider conducting further research, consulting with a financial advisor, and managing your risks appropriately.


HAVELLS NEAR ATH BREAKOUT Havells weekly chart looks like breaking out from descending triangle at ATH.
Enter with your setup in lower time frames.
STOP LOSS @ 1245
FIBONACCI TARGETS : 1630, 1800, 2050, 2280 OR TRAIL USING 20/50EMA.

HAVELLS 1H TF LONGGave a decent breakout and consolidating in a triangle pattern. Can take LONG position once the trendline is broken by a strong 30 mins candle and also let it close. For shorting opportunities you should scalp as the trend is bullish . And also let the market cool down or let it establish a trend and take trades accordingly.
Also, checkout my NIFTY50 Technical Analysis which I will be attaching to this idea , if you like my analysis please do follow me for more such trades and support.

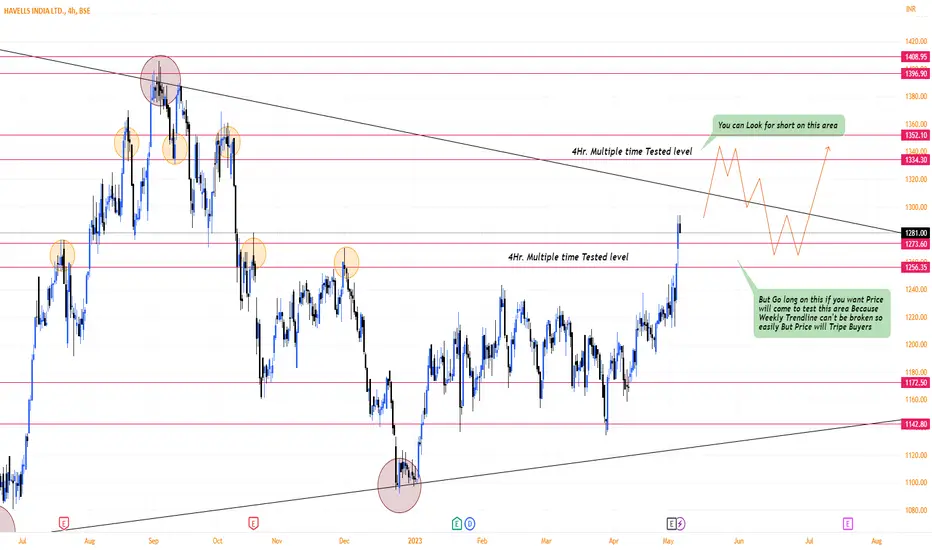
HAVELLS✅ Price recently break 1256-1273 Resistance zone that tested multiple time.
✅ But on Weekly time frame there is a strong trendline coming that also test 2 time in row.
✅ But you can look for short on 1334-1352, But you can look Long on 1256-1273 level when price break weekly trendline and on retest with strong reversal on 1256-1273 area you can go long.

long for this expirylooking for a nice upside for this expiry
target till 1255-65
stop as per comfort
breakout based trade using indicators RSI, fibo, trend line to enter the trade
disclaimer - trade @ own risk

intradayboth side potential
avoid first 15min breakout
wait for 15 min candle closing
targets are marked
follow risk management
do your own analysis
do workout
do meditation
start reading book

intraday / RSI Divergencersi is dropping but the price of stock wasn't droping
both side potential
avoid first 15min breakout
wait for 15 min candle closing
targets are marked
if the breakout comes after 10:00 am then the probability of winning will be more.
follow risk management
do your own analysis
do workout
do meditation
start reading books

intradaybearish RSI Divergence
Both side potential
avoid first 15min breakout
wait for 15 min candle closing
targets are marked
if the breakout comes after 10:00 am then the probability of winning will be more.
follow risk management
do your own analysis
do workout
do meditation
start reading books

HAVELLSHAVELLS:- Ascending triangle pattern has been formed, the stock has given a breakout, but waiting for retesting. If you are planning something, keep an eye on it.
Hello traders,
As always, simple and neat charts so everyone can understand and not make it too complicated.
rest details mentioned in the chart.
will be posting more such ideas like this. Until that, like share and follow :)
check my other ideas to get to know about all the successful trades based on price action.
Thanks,
Ajay.
keep learning and keep earning.

HAVELLS INDIA idea for intradayIntraday Trade
if HAVELLS INDIA breaks 1244 or closes 5 min candle then buy T1-1255/1260
If breaks below 1229 then sell for T1-1220/1210
