HCL TECH STRONG BUYHCL Tech at its support and all set to rock up.
Buy HCL Tech above 907.
Target 1- 957
Target 2- 990
Stoploss- Below 890 Closing Basis
HCLTECH

HCL Tech XABCD pattern (Buy around 830) with SL @ 780HCL Tech XABCD formation in progress. Enter long PZR @ 830 to 820 with SL @ 780 closing basis
200 day moving Avg at 850 level gives added comfort at these levels

HCLTECH moving between rangeHCLTECH moving between range with downside.
Day Range should be between 900 to 915.
Lets wait for breakout atleast 1% from trendline.

Buy Partial HCLTechBuy Partial 50% Qty at 906.
If it dips to 895-897 buy the other 50% quantity.
Stop Loss 875
Target 975
1 Month


HCL Technologies - Wednesday Trade | 28th AprStock looks weak and is trading near its support TL.
If breaks TL and closes below it in 5/15 min TF then can target 905 in Intraday.

HCLTech Looks WeakThe stock already closing below the trend link and expected to test 900 and 860 levels if sustain below 950.
To motivate me, Please like the idea If you agree with the analysis.
Happy Trading!
InvestPro India Team

HCL TECH - BUY - Rs.1000 -7 Day Time frameBased on the volume profile showing heavy support at CMP, the oversold RSI reading and overall base trend line, the stock can rebound to ~Rs.1000 within the next 7 days. Note - earnings are post market on friday 23rd April.
Link to longer time frame trade Idea on HCL:


HCL TECHNOLOGIESHCL TECHNOLOGIES
fundamentally strong and P/E is showing it's cheap to BUY now for LONG term investors.
1067.80 has a Strong RESISTANCE LEVEL if breaks this level BUY, and 1067.80 will become STOP LOSS.
If failure to break becomes reversal 1067.80 will become STOP LOSS and go for SHORT.
Note: These Targets for only Long term investors and Positional trader. not for short-term traders.


HCL TECH - Long - Target 1110HCL Tech seems to have broken out of a downward trend, caused by fear selling in the markets this week. The stock has been following an upward trending parallel channel over the last few days and has also rebounded off the 50 DMA. It is set to achieve a target of 1110 by earnings release ~ 15th of May.
Target:1110
Entry: 991/CMP
Stop Loss: 960
Time: ~ 39 Days
Note: Book profits at ~1050/55 as the stock may face heavy resistance at this level, as seen previously.

HCL Tech Consolidating for BreakoutBuy above 1021 for a target of 1033/1045/1055
major resistance @1055, it breaks that, then we can see an upside potential.
Support @200 EMA.
Major support @1000

Sell Hcl Tech with sl 1055Hcl tech breakout happened today.20,50 ma cross will confirm strong sell trend.
Sell with sl 1055 targets are 975,960.
good luck all

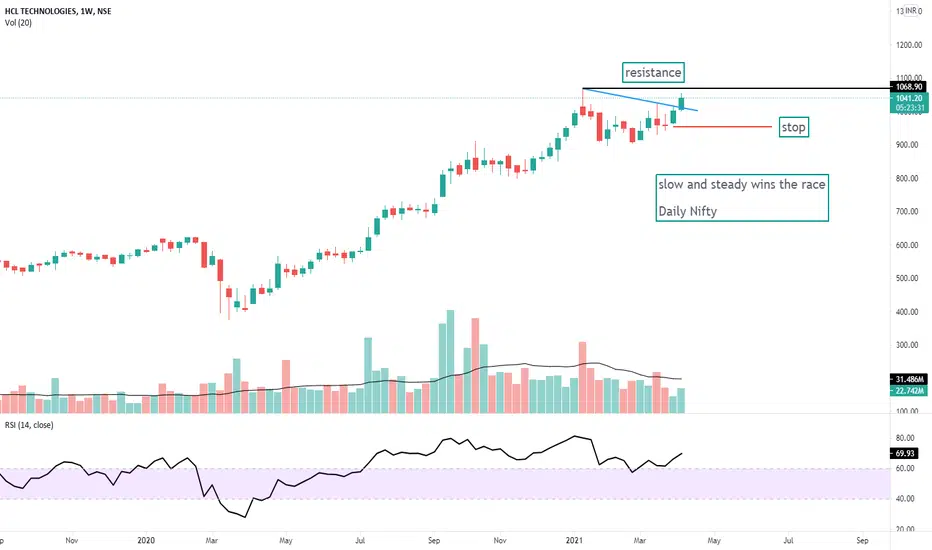
HCL Tech | Bullish Above 1067The stock is in an uptrend, creating high lows and not sustaining below the trendline.
We would see Fresh Buying if sustains above its All-Time High (1067).
To motivate me, Please like the idea If you agree with the analysis.
Happy Trading!
InvestPro India Team

HCL Tech Long with sl 898 and expected to reach 1025HCL Tech cross over happening in 1h but with the sl of 898 with the target 1025
If it travelling in a parallel channel it may go upto 1120
good luck all

H&S HCL TECHHead and Shoulders formation on HCL Tech daily chart.
Disclaimer: Educational purposes only not published as a trading idea.

HCLTECH - Tuesday Trade | 06th AprStock has broken Descending Trendline and resistance zone.
Buy above 1040 for targets of 1052 and 1067


HCLTECH | Swing | Symmetrical TriangleHCLTECH has formed a symmetrical triangle and likely to give good momentum after the breakout.
Keep it on your watchlist.


HCL TechnologyHCL Technology is Forming a Symmetrical Triangle Pattern. It can give any side breakout/breakdown. we will go for buy and sell after sustainable Breakout or Breakdown.
