HDFC BANK make or break !!!HDFC BANK near resistance !!
major resistance at 1670-1690 this is 7th attempt to break it !!
if good volume break then rally continues or else
previous support at 1450 levels
waiting for a clean break to enter
HDFC

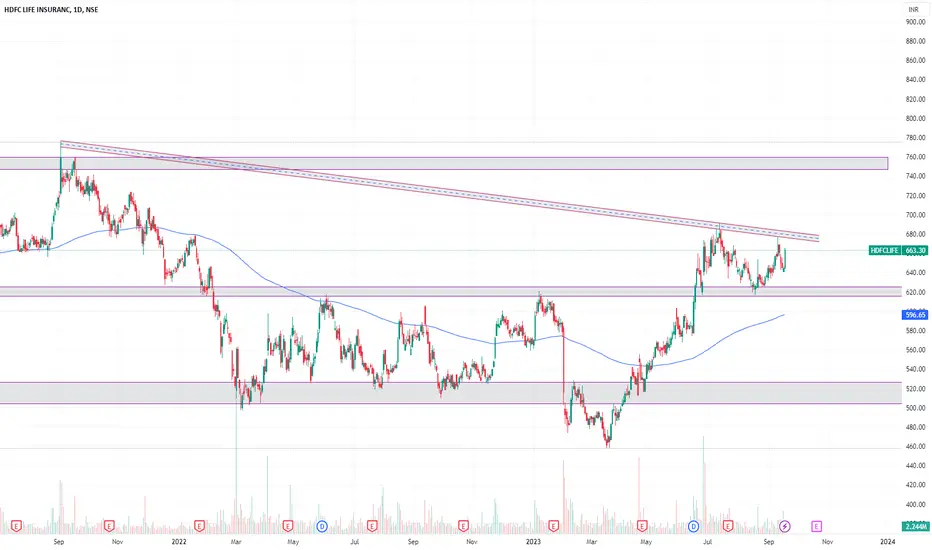
HDFC LIFE !Trend is neutral
Net Sales of 46,513cr has grown at 56.23%
Pat has grown at 20.84%
PE is too hot and high at 93.43%
mutual fund stake has increased from 4% to 4.66%past quarter
stock is a good buy at 520-560
Wait for the dip

21st Dec ’23 - BankNifty leads from the front, stance is NEUTRALBankNifty Analysis
I initially thought the wolf in the sheep’s costume was NiftyIT today spoiling the fun of the Bears. The real culprit was BankNifty - the way it defended its turf today was more than amazing. Even though we had a lower opening, HDFCBANK was staying strong at one end. You know pretty well that HDFCBK alone can drive up/down the index as its weight on the index is manipulatively sizeable.
4mts chart link - click here
Just like a Tug-of-War, HDFCBK was at the rear end acting as the anchor. It bolted itself to the ground and ensured BN was not slipping. Somehow it worked. The first thing BN did was to retest the lower end of the ascending channel i.e. between 10.07 to 10.55. Once it broke out - it retested the same line from a support perspective i.e. b/w 13.55 to 14.11. The 2nd test was rejected which gave it massive momentum to break free (upside). The next stop was right at the top end of the channel i.e. b/w 14.47 to 15.19. You might have to see the encircled portion in the chart to know what I am referring to.
63mts chart link - click here
Can you believe - All the candles today were GREEN. We started at the lower end of the channel and ended at the top boundary stopped only by the bell. Today’s price action almost nullified yesterday’s move and seeing the way BN fought back, I wish to change my stance to neutral for tomorrow. Will go bearish once 47400 gives away and will go bullish if the ATM is taken out. The options premium did not have any excesses today indicating that a big move may not be expected - will update you via TV minds if I see something interesting tomorrow.

Looking for long!HDFC AMC is looking for great buying opportunity after forming descending channel lined up with the double bottom formation expecting target to reach at 3400

HDFC LIFE : Multibagger Investing Idea Exciting Bullish Pattern Alert! 🐂
📊 Pattern: Broadening Pattern
📌 Symbol/Asset: HDFCLIFE
🔍 Description: Stock is making broadening pattern. We can see huge upisde in the stock.
Its a Buy on dip stock.
👉 Disclosure: We are not SEBI registered analysts, this is not a buy or sell recommendation.

LevelsHere, is the analysis for HDFCLIFE ....
This is will definitely help you to decide your investment or trading...

HDFC BANK Long Trade.Right Time to Invest in HDFC BANK.
Buying Range : 1615 to 1620
Stop Loss : @1595
Targets : 1650/1680/1725/1775/1840 ++++++
Reasons to Buy:
1: HDFC bank following a channel from past one year, and now again taking support from the channel low i.e. @1615.
So basis idea is that, we will follow the price up to channel high (i.e. @1775-1840).
2: RSI is about to oversold. As observed whenever RSI was found below 35 then the movement was shifted to upside.
3: Good fundamentals
4: Good Risk to Reward ratio.
Thanks
Disclaimer: This idea is only for the Educational purpose. Trade at your own risk.
If you like the idea kindly support.

How to trade in option market 💸🙏😊 👑Royal Trend👑
Topic Trading Things
Topic - Option Trade and Trading 💸💸💸💸👑🤑
#If u Buy stock without stop loss that mean U are weak in Physiology
#Train Your self To take small trade with Stop-loss
How to make Big Profit💸 With Small Account
In this video we try to Identify Trend and Entry By Big Bull👑🤑🤑💸💸
How market really work with number's
How important is option chain analysis?
The option chain analysis data provides a very comprehensive view for all the available options for any particular underlying asset. This helps in understanding and selecting the correct option for trading or investment purpose.
Difference between technical analysis and option trading
Technical analysis and options trading can go hand in hand. Many of the best practices for options trading come directly from technical analysis concepts. Technical analysis focuses on price. Fundamental analysis does not solely focus on price.
why we learn option chain?
Option chain is a chart that will give in-depth information related to all stock contracts available for Nifty stocks. The best thing about the option chain is that it provides valuable information about the current security value and how it will affect it in the long term.
What is the purpose of option chain?
It can be used in creating an option strategy at several strike prices. It can be used to analyse and draw noteworthy insights about the stock and its probable movements. It helps the traders in evaluating the liquidity and the depth of the option contract.
Technical trader
Technical trading is a broader style that is not necessarily limited to trading. Generally, a technician uses historical patterns of trading data to predict what might happen to stocks in the future. This is the same method practiced by economists and meteorologists: looking to the past for insight into the future.
NOTE
#We Are Not Promote Anything
#This channel Purpose to share market ideas.
Thanks for Watching🙏

Positional_ HDFCKeep track of HDFC. It could provide good positional trade opportunity in future. HDFC tried to break the resistance 2 times (Downward Channel Pattern), now it is already weak. If it tries to break 3rd time, there could be huge momentum or real breakout.
We can exit or hold near resistance, depending on various circumstances. Risky traders may hold, safe players may exit.
Entry price, SL and targets will be decided afterwards.
Disclaimer: The views expressed in this article is of my own, you're solely responsible for any decision taken in the markets. The analysis I've shared is just for informational and educational purposes only.
HLong

HDFC_ Breakout awaited_ Long above Rs 2550HDFC was in a continuous "channel pattern" on daily chart. I am expecting a breakout near Rs 2550 levels.
SL will be low of previous daily candle (already marked in the chart), and I am expecting a target of Rs 2860 which translates into Risk Reward of 1 : 2.75
Disclaimer: Please do your own analysis before jumping into the trade. Till then, just be a spectator and evaluate how the price moves after a breakout.
HLong

#HDFC monthly chart deep analysis and assumptions(for reference)Greetings Folks,
today I have prepared a setup of HDFC on NSE
the analysis is as follows-
- this is a monthly timeframe chart so do not use this to trade, use for confirmation bias
- the price failed to break out of a series of monthly equal highs
- the breakout didn't lasted and then the stock began its down trend
- the down trend went on for 4 months , and now the price seems to have found a stable support i.e the 50% of fib retracement
- the price is likely to consolidate a bit to add liquidity and momentum
- i will say it again, do not use this chart to set your entry and exit points
don't play with fire, always use a predefined stoploss

13th Oct ’23 - HDFCBK results may mess up Tech Analysis -BankN50BankNifty Analysis
BankNifty was crazier than Nifty today, but because the options premium were not juicy enough, I refrained from taking positions (glad that I did).
Open we fell 349pts and never really recovered from it. Till 13.30 BankNifty was showing more intent to fall than Nifty. Then came a quick surge of 248pts ~ 0.56% in 30mts. We closed the gap with this. More importantly, we fell back 360pts from that day’s top. A 0.81% fall in the closing hour has to do something with the results on HDFCBK.
Yesterday I went with a neutral view for BankNifty and clearly said would prefer to go bearish if the 44380 level is broken. 44380 from the chart above shows the minor support level on which the double top lands. For Monday, it looks like the technical analysis may not work as news-flow, the results declaration on HDFCBK will mess it up. Still, with respect to the support/resistance levels, I wish to go with a short position if the 44068 gets broken.

Nifty it Or CNXIT INTRADAY TRADE👑🤑💸👑Royal Trade👑
CNXIT IMPORTANT LEVEL
we buy Put and my Target in videos
Dont buy any trade without stop loss
This is only level we upload new idea in morning 9.30
Buy when Market Break
The support or Resistance
and wait for the closing and
set stop loss at the
last opening of the candle.
NOTE
#We Are Not Promote Anything
#This channel Purpose to share market ideas.
Thanks for Watching🙏


HDFC Bank LtdHope all are good. Important points marked for HDFC Bank. Currently HDFC is downward trend and seeing a gap in the chart. Strong stock good time to acquire more stocks, it will go down to marked points and will reverse.
If you are planning to hold for long collect in all dips.
Current issues are not a problem for HDFC Bank.
Disclaimer: Only for education purposes do own research before investing in equity market.

HDFCBANK - Near Important Support ZoneNSE:HDFCBANK offers a range of banking services covering commercial and investment banking on the wholesale side and transactional/branch banking on the retail side.
Positives:
Company with high TTM EPS Growth
Good quarterly growth in the recent results
Effectively using Shareholders fund - Return on equity (ROE) improving since last 2 year
Efficient in managing Assets to generate Profits - ROA improving since last 2 year
Increasing Revenue every Quarter for the past 4 Quarters
Company able to generate Net Cash - Improving Net Cash Flow for last 2 years
Annual Net Profits improving for last 2 years
Book Value per share Improving for last 2 years
Company with Zero Promoter Pledge
FII / FPI or Institutions increasing their shareholding
Negatives:
MFs decreased their shareholding last quarter
Decline in Net Profit with falling Profit Margin (QoQ)
Declining profits every quarter for the past 2 quarters
Weak Momentum: Price below Short, Medium and Long Term Averages
NOT A RECOMMENDATION. JUST FOR EDUCATION. Thanks.

HDFC BankHere, is the daily time frame chart since we are tracking from last year....
and Had a fruitful results....
What's your view on HDFC bank?

HDFC BANK: ASCENDING TRIANGLEHDFC Bank is forming a beautiful ascending triangle with a long base. Breakout above 1750 will lead to Targets of 2700+. Stay invested. Also have a look at volumes

HDFCLife ChartHere, is the chart of HDFCLIFE, Hope the levels will help you a lot to trade or invest...
Pattern Formation in Bank Nifty!- A bullish Flag formation on hourly chart, Trend is also looking strong as buyers are coming on every dip.
- Support Level keep eyes on 45800 to 45850
- Resistance on 46000 to 46100 Also its a round level most of the seller may get active
- Last friday also was a trending day let see for tomorrow might we can get good Entry & Exit
Note : Do your own analysis before making any trade.

HDFCAMC Fall expectedI am not holding HDFCAMC. You may book profits here
Disclaimer: This analysis is solely for educational purposes and does not make me a SEBI registered analyst.
If you found this analysis helpful, I encourage you to like and share it. Your observations and comments are also welcomed below. Your support, likes, follows, and comments motivate me to consistently share valuable insights with you.
🔍 More Analysis & Trade Setups 🔍
For more technical analysis and trade setups, make sure to follow me on TradingView: www.tradingview.com

HDFCBANK Best Intraday Trade👑🤑✔hello guys welcome to Ramajitrade 🙏😊
Today Target is 1600+ We by CALL we achive this target 100%.
and please Trail your stop loss and try to hold.
#i m data trader my 90% Trade base on data treading i hope you like all my trade.
We Not Suggest you To Buy any Stock We just share our Ideas with you.

Banknifty Intraday By Big Bull🤑👑✔hello guys welcome to Ramajitrade 🙏😊
Today Target is 44,300 We by call we achive this target 100%.
and please Trail your stop loss and try to hold.
#i m data trader my 90% Trade base on data treading i hope you like all my trade.
We Not Suggest you To Buy any Stock We just share our Ideas with you.
