ANGEL ONE LTDANGEL ONE LTD
Finding Market Clues with Simple Tools
This is not a trade I took - just an observation I found fascinating and wanted to share.
In ANGEL ONE's recent price action, I applied a simple 3-step process:
Identify a turning point
Spot a potential 5-wave Elliott Wave structure
Look for RSI divergence at key highs/lows
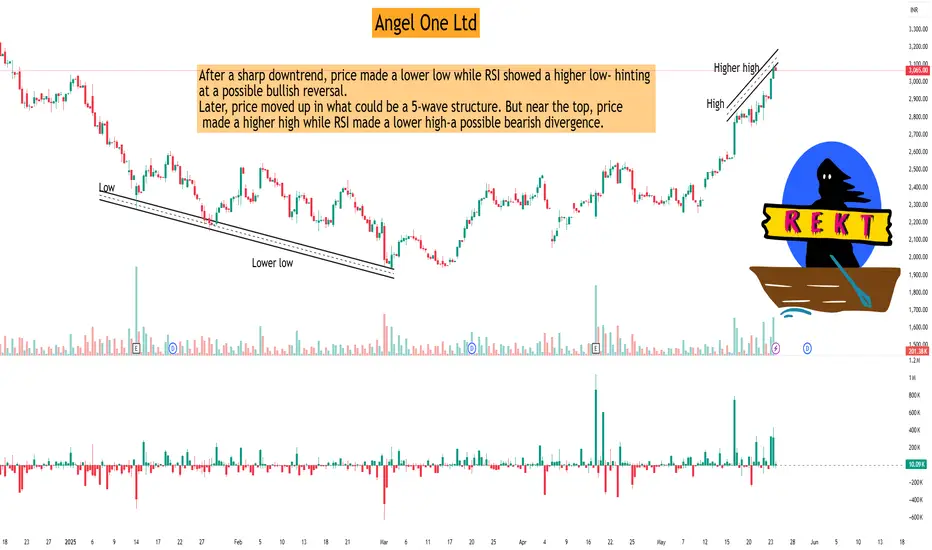
After a sharp downtrend, price made a lower low while RSI showed a higher low- hinting at a possible bullish reversal.
Later, price moved up in what could be a 5-wave structure. But near the top, price made a higher high while RSI made a lower high-a possible bearish divergence.
I didn't trade this setup - but it's fascinating how often these simple techniques reveal potential market shifts. It's not about being right every time, but about learning to read the market structure better.
Books like Elliott Waves Made Simple by Steve Sinclair have helped me more than any social media post. They teach you to think with structure, not noise.
This isn't a buy/sell recommendation. Just sharing something I'm practicing. Mistakes will happen, but that's part of the learning curve. The market is always there - it's on us to keep improving our technical reading.
HDFC
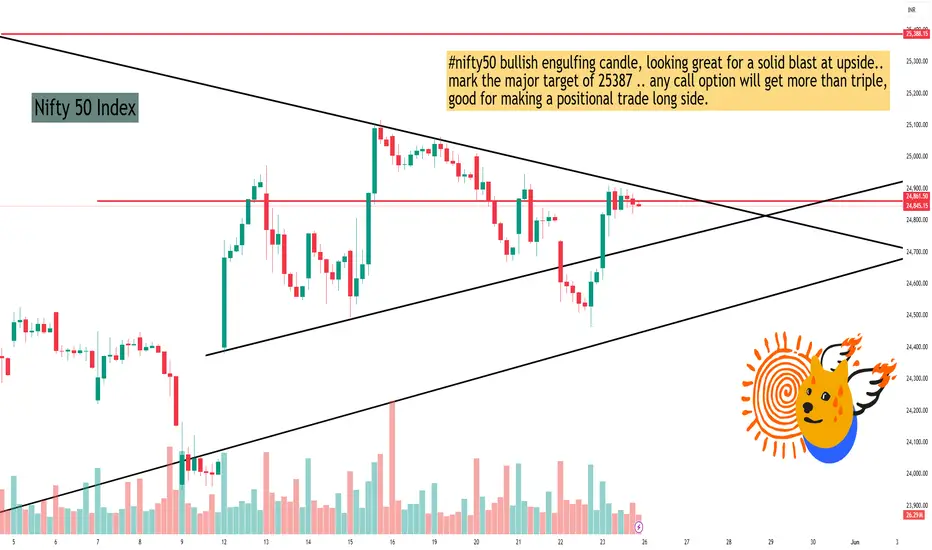
Nifty 50 Index#nifty50 bullish engulfing candle,
looking great for a solid blast at upside..
mark the major target of 25387 ..
any call option will get more than triple,
good for making a positional trade long side.
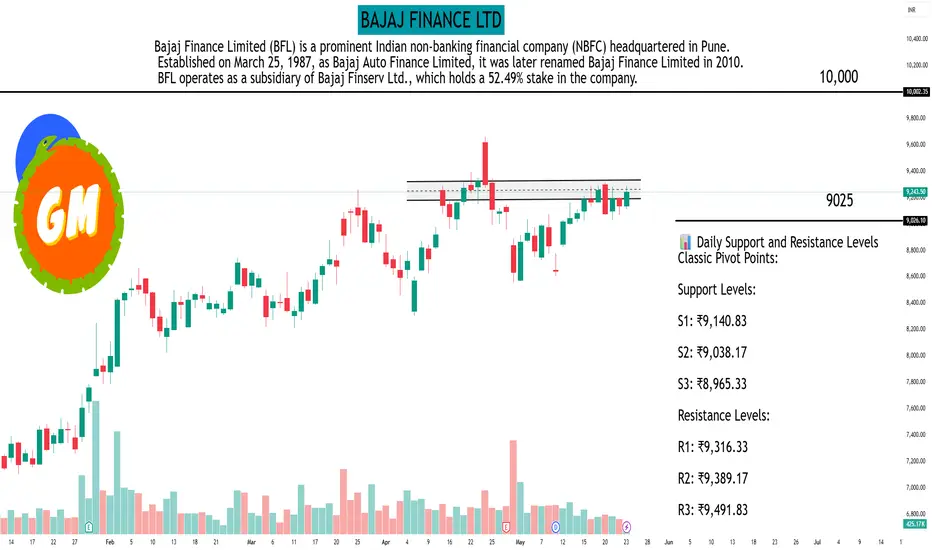
BAJAJ FINANCE LTDAs of the market close on May 23, 2025, Bajaj Finance Ltd. (NSE: BAJFINANCE) was trading at ₹9,243.50. Based on recent technical analyses, here are the key daily support and resistance levels:
📊 Daily Support and Resistance Levels
Classic Pivot Points:
Support Levels:
S1: ₹9,140.83
S2: ₹9,038.17
S3: ₹8,965.33
Resistance Levels:
R1: ₹9,316.33
R2: ₹9,389.17
R3: ₹9,491.83
Pivot Point: ₹9,213.67
Fibonacci Pivot Points:
Support Levels:
S1: ₹9,146.63
S2: ₹9,105.21
S3: ₹9,038.17
Resistance Levels:
R1: ₹9,280.71
R2: ₹9,322.13
R3: ₹9,389.17
Pivot Point: ₹9,213.67
Camarilla Pivot Points:
Support Levels:
S1: ₹9,227.41
S2: ₹9,211.33
S3: ₹9,195.24
Resistance Levels:
R1: ₹9,259.59
R2: ₹9,275.67
R3: ₹9,291.76
Pivot Point: ₹9,213.67
📈 Technical Indicators Overview
Moving Averages:
20-day EMA: ₹9,046.05
50-day EMA: ₹8,838.25
100-day EMA: ₹8,444.91
200-day EMA: ₹7,961.51
Current Price: ₹9,243.50
Interpretation: The current price is above all major moving averages, indicating a bullish trend.
Technical Summary:
Overall Rating: Strong Buy
Moving Averages: Buy
Technical Indicators: Strong Buy
🔍 Key Observations
The stock is trading above its pivot point and all major moving averages, suggesting bullish
Immediate resistance is observed around ₹9,316.33 (Classic R1), with further resistance at ₹9,389.17 (Classic R2).
Immediate support lies at ₹9,140.83 (Classic S1), with stronger support at ₹9,038.17 (Classic S2).
Please note that these levels are based on historical data and technical analysis, and actual market conditions may vary. It's advisable to use these levels in conjunction with other indicators and market news when making trading decisions.
Learn Institutional Level Trading part 6Institutional trading involves the buying and selling of financial instruments for large organizations and entities, like mutual funds, pension funds, and insurance companies, on behalf of their clients or members. These entities trade large volumes, potentially influencing market prices and liquidity.

Learn Institutional Level Trading part 3Trading institutions operate through entities which combine multiple investment funds from investors to invest in financial markets. These firms operate differently from people who maintain brokerage accounts since they oversee massive asset portfolios while their market-shaping trading volume defines their operations.

PCR Trading Strategy part 2Typically, a put-call ratio is a derivative indicator. It is designed to enable traders to determine the sentiment of the options market effectively. This ratio is computed either by factoring in the open interest for a given period or based on the volume of options trading

PCR Trading Strategy part 1The Put-Call Ratio (PCR) is a technical indicator used by traders to gauge market sentiment and identify potential trend reversals. It's calculated by dividing the total open interest of put options by the total open interest of call options. A high PCR (above 1) suggests bearish sentiment, while a low PCR (below 1) indicates bullish sentiment. Traders often use PCR as a contrarian indicator, meaning they might look to buy when the PCR is high, anticipating a reversal, or sell when it's low, expecting a downturn.

Option and Database TradingIn financial terms, "option trading" and "database trading" refer to distinct activities. Option trading involves buying and selling contracts that grant the right, but not the obligation, to buy or sell an underlying asset at a specific price within a certain timeframe. Database trading, on the other hand, is not a standard financial term. It likely refers to trading or managing data within databases, which could include activities like data analysis, querying, or manipulation.

RSI and RSI Divergence RSI: Divergence appears when the RSI's highs or lows diverge from price. For example, if the price makes new lows but the RSI bottoms at higher levels, it signals bullish divergence; if the price makes new highs but the RSI peaks at lower levels, it signals bearish divergence.

Technical Concept A "technical concept" refers to a term or idea that has a specific meaning within a particular technical field, often different from its everyday meaning. These concepts are fundamental to understanding and working within that field.

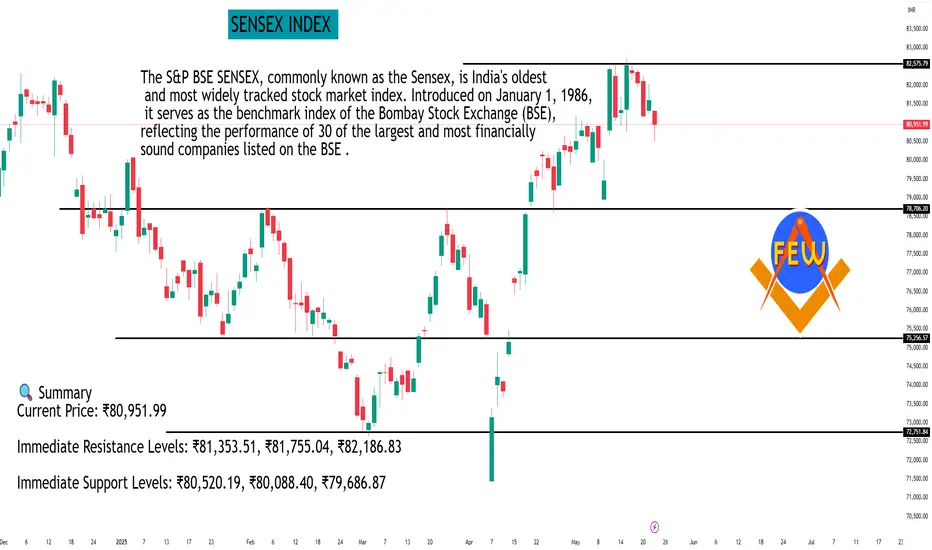
SENSEX INDEX As of the close on May 22, 2025, the BSE Sensex stood at 80,951.99, marking a decline of 0.79% from the previous session.
📊 Daily Support and Resistance Levels
Based on technical analysis, the following support and resistance levels have been identified for the BSE Sensex:
Classic Pivot Points:
Pivot Point: ₹80,921.72
Resistance Levels:
R1: ₹81,353.51
R2: ₹81,755.04
R3: ₹82,186.83
Support Levels:
S1: ₹80,520.19
S2: ₹80,088.40
S3: ₹79,686.87
Fibonacci Pivot Points:
Resistance Levels:
R1: ₹81,240.04
R2: ₹81,436.71
R3: ₹81,755.04
Support Levels:
S1: ₹80,603.39
S2: ₹80,406.72
S3: ₹80,088.40
Camarilla Pivot Points:
Resistance Levels:
R1: ₹81,028.38
R2: ₹81,104.77
R3: ₹81,181.15
Support Levels:
S1: ₹80,875.60
S2: ₹80,799.21
S3: ₹80,722.83
📈 Technical Outlook
The Sensex has entered a negative trend in the last trading session. It is considered bearish until it trades above ₹81,974 on a daily closing basis.
🔍 Summary
Current Price: ₹80,951.99
Immediate Resistance Levels: ₹81,353.51, ₹81,755.04, ₹82,186.83
Immediate Support Levels: ₹80,520.19, ₹80,088.40, ₹79,686.87
Bearish Threshold: A daily close below ₹81,974 indicates a bearish trend.
Traders should monitor these levels closely and consider broader market trends and economic indicators when making investment decisions.
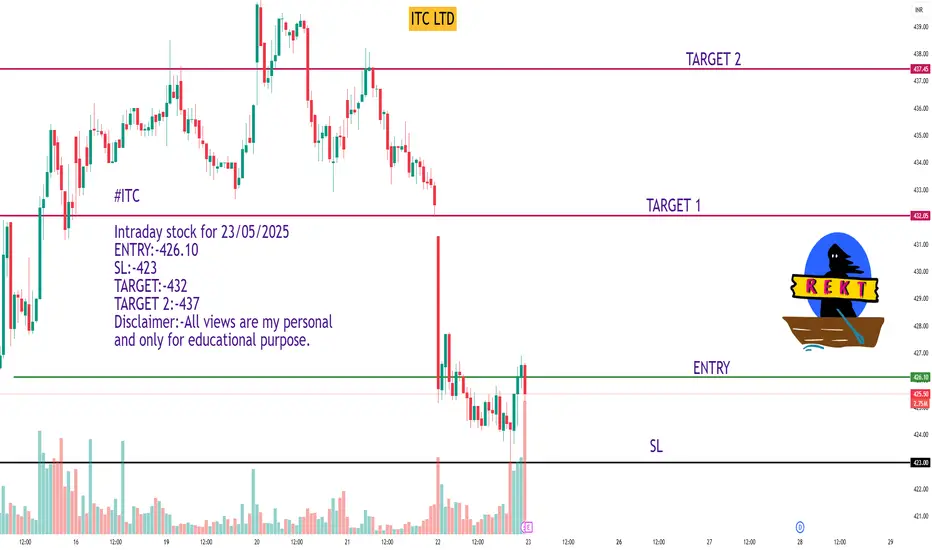
ITC LTD#ITC
Intraday stock for 23/05/2025
ENTRY:-426.10
SL:-423
TARGET:-432
TARGET 2:-437
Disclaimer:-All views are my personal and only for educational purpose.
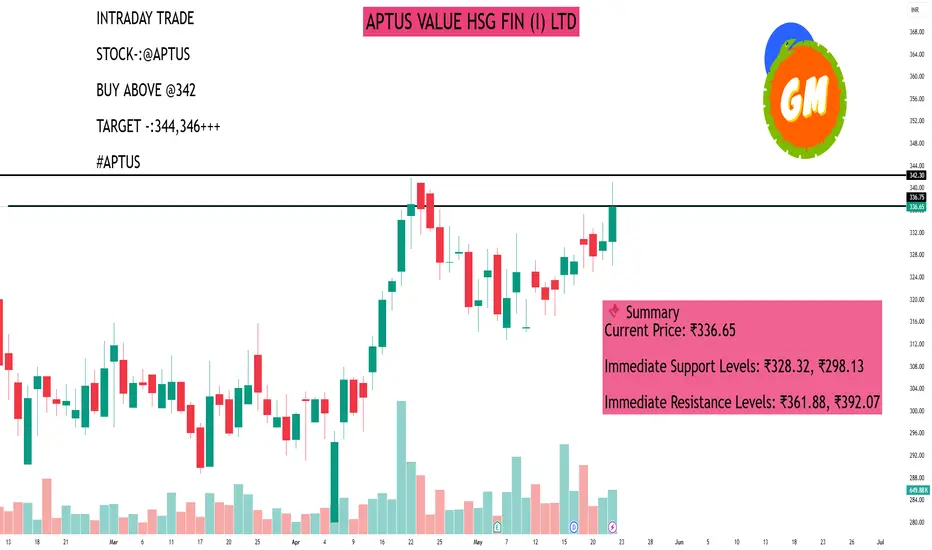
APTUS VALUE HSG FIN (I) LTDAs of May 22, 2025, Aptus Value Housing Finance India Ltd (NSE: APTUS) closed at ₹336.65, marking a 1.89% increase from the previous session.
📊 Daily Support and Resistance Levels
Based on technical analysis, the following support and resistance levels have been identified for Aptus Value Housing Finance India Ltd:
Classic Pivot Points:
Pivot Point: ₹328.32
Support Levels:
S1: ₹298.13
S2: ₹264.57
S3: ₹234.38
Resistance Levels:
R1: ₹361.88
R2: ₹392.07
R3: ₹425.63
Fibonacci Retracement Levels (from recent downtrend):
Resistance Levels:
23.6%: ₹319.49
38.2%: ₹323.75
50%: ₹327.20
61.8%: ₹330.65
76.4%: ₹334.91
📈 Technical Indicators Overview
Relative Strength Index (RSI): 43.56 (indicates a bearish trend)
Stochastic RSI: 11.05 (oversold condition)
MACD: 0.47 (bullish crossover)
Average Directional Index (ADX): 31.01 (indicates a strong trend)
Commodity Channel Index (CCI): -165.91 (suggests the stock is oversold)
📌 Summary
Current Price: ₹336.65
Immediate Support Levels: ₹328.32, ₹298.13
Immediate Resistance Levels: ₹361.88, ₹392.07
Given the current technical indicators and support/resistance levels, traders should exercise caution. Monitoring the stock's movement around these key levels can provide insights into potential trading opportunities. It's advisable to consider these technical factors in conjunction with broader market trends and fundamental analysis before making investment decisions.
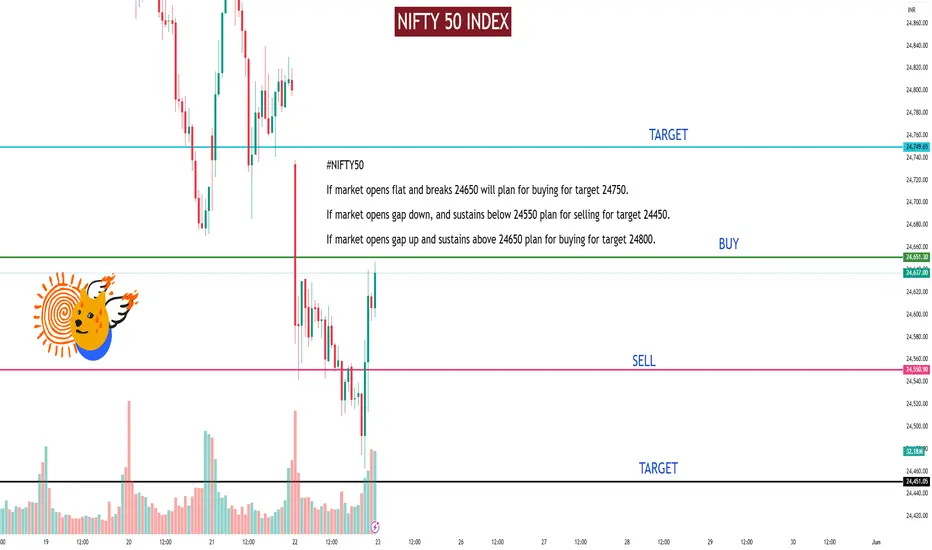
NIFTY 50 INDEXPre Market analysis for 23/05/2025
#NIFTY50
If market opens flat and breaks 24650 will plan for buying for target 24750.
If market opens gap down, and sustains below 24550 plan for selling for target 24450.
If market opens gap up and sustains above 24650 plan for buying for target 24800.
Disclaimer:-All views are my personal and only for educational purpose.
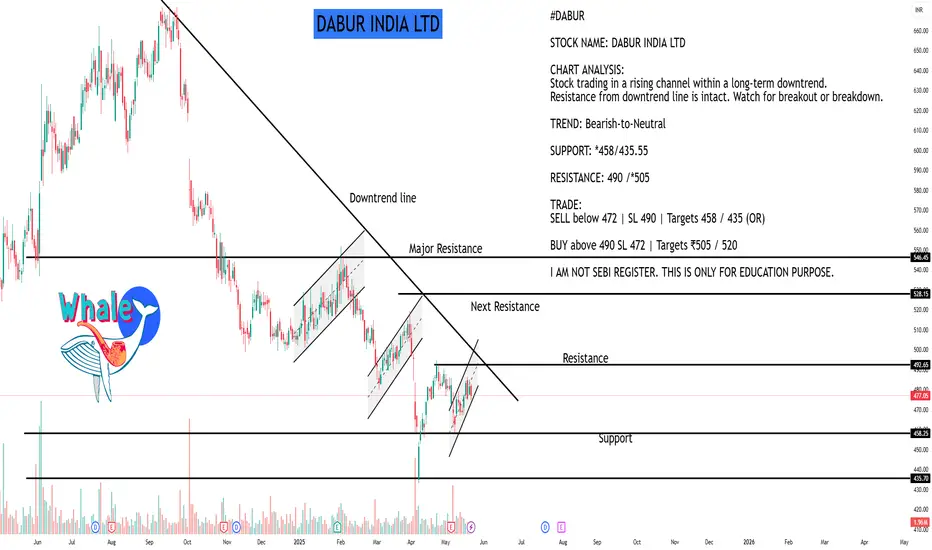
DABUR INDIA LTDAs of May 22, 2025, Dabur India Ltd (NSE: DABUR) closed at ₹477.05, reflecting a 0.98% decline from the previous session.
📊 Daily Support and Resistance Levels
Based on technical analysis, the following support and resistance levels have been identified for Dabur India Ltd:
Classic Pivot Points:
Pivot Point: ₹476.48
Support Levels:
S1: ₹474.61
S2: ₹473.23
S3: ₹471.36
Resistance Levels:
R1: ₹477.86
R2: ₹479.73
R3: ₹481.11
Additional Support and Resistance Levels:
Support: ₹470.28, ₹473.67, ₹478.38
Resistance: ₹481.77, ₹486.48, ₹489.87
📈 Technical Indicators Overview
The current technical indicators suggest a bearish outlook for Dabur India Ltd:
Relative Strength Index (RSI): 43.56 (indicates a bearish trend)
Stochastic RSI: 11.05 (oversold condition)
MACD: 0.47 (bullish crossover)
Average Directional Index (ADX): 31.01 (indicates a strong trend)
Commodity Channel Index (CCI): -165.91 (suggests the stock is oversold)
📌 Summary
Current Price: ₹477.05
Immediate Support Levels: ₹474.61, ₹473.23, ₹471.36
Immediate Resistance Levels: ₹477.86, ₹479.73, ₹481.11
Given the current technical indicators and support/resistance levels, traders should exercise caution. Monitoring the stock's movement around these key levels can provide insights into potential trading opportunities. It's advisable to consider these technical factors in conjunction with broader market trends and fundamental analysis before making investment decisions.
Institution Trading Strategies part 5Institutional traders incorporate strategies that emphasize both long-term value and diversification in their trading practices. They leverage significant amounts of capital to build portfolios diversified across multiple assets, which helps reduce risk while seeking improved market prices.

Institution Trading part 4Institutional trading involves the buying and selling of large quantities of financial assets, typically conducted by institutional investors like hedge funds, mutual funds, and pension funds. These entities manage money for others and trade in securities, including stocks, bonds, and derivatives.

Support and Resistance part 2Support is a price point below the current market price that indicate buying interest. Resistance is a price point above the current market price that indicate selling interest. S&R can be used to identify targets for the trade. For a long trade, look for the immediate resistance level as the target.

Basic to Advance Trading The very best way to get into trading is to find a platform you trust, learn as much as you can about trading beforehand and then practise to get your skill, technique and strategies right. Thereafter, all that remains to be done is to create a trading plan and open a live account.

Put and Call RatioThe put-call ratio (PCR) is a technical indicator in options trading that reflects the overall sentiment of the market. It compares the volume of put options traded to the volume of call options traded. Put options give the holder the right to sell an asset at a specific price, while call options give the right to buy it.

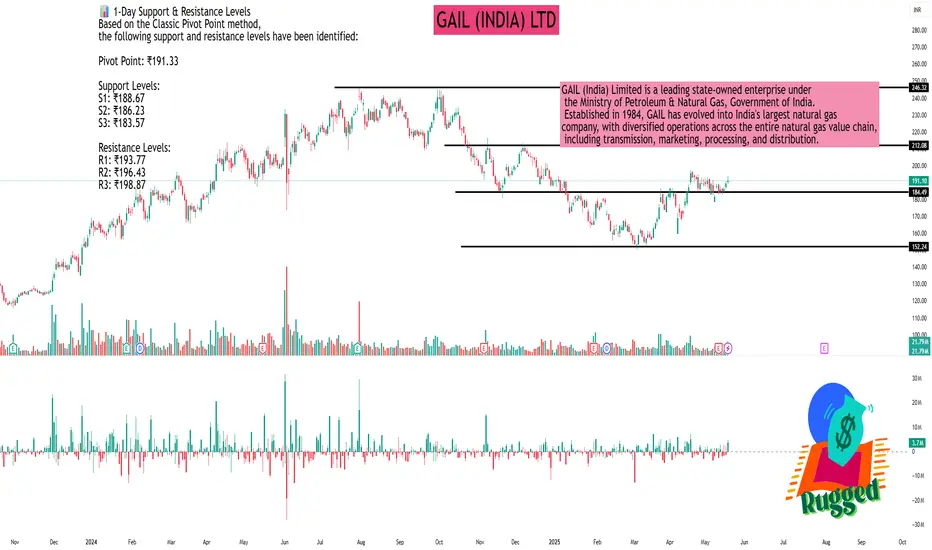
GAIL (INDIA) LTDAs of May 21, 2025, GAIL (India) Ltd. (NSE: GAIL) is trading at ₹191.10, reflecting a 0.86% increase from the previous close.
📊 1-Day Support & Resistance Levels
Based on the Classic Pivot Point method, the following support and resistance levels have been identified:
Pivot Point: ₹191.33
Support Levels:
S1: ₹188.67
S2: ₹186.23
S3: ₹183.57
Resistance Levels:
R1: ₹193.77
R2: ₹196.43
R3: ₹198.87
📈 Technical Indicators
Relative Strength Index (RSI): 60.63 – Indicates bullish momentum.
MACD (12,26): 1.34 – Suggests a bullish crossover.
Average Directional Index (ADX): 35.59 – Reflects a strong trend.
Commodity Channel Index (CCI): 48.46 – Neutral.
Rate of Change (ROC): 2.75 – Positive momentum.
Money Flow Index (MFI): Not specified.
📉 Moving Averages
50-day EMA: ₹226.29
200-day EMA: Not specified.
The current price is below the 50-day EMA, indicating a potential bearish trend in the short term.
🔍 Market Outlook
GAIL (India) Ltd. is exhibiting mixed signals. While technical indicators like RSI and MACD suggest bullish momentum, the stock trading below its 50-day EMA indicates caution. Traders should monitor the support and resistance levels closely; a breach above R1 (₹193.77) could indicate further upside, while a drop below S1 (₹188.67) might suggest a potential decline.
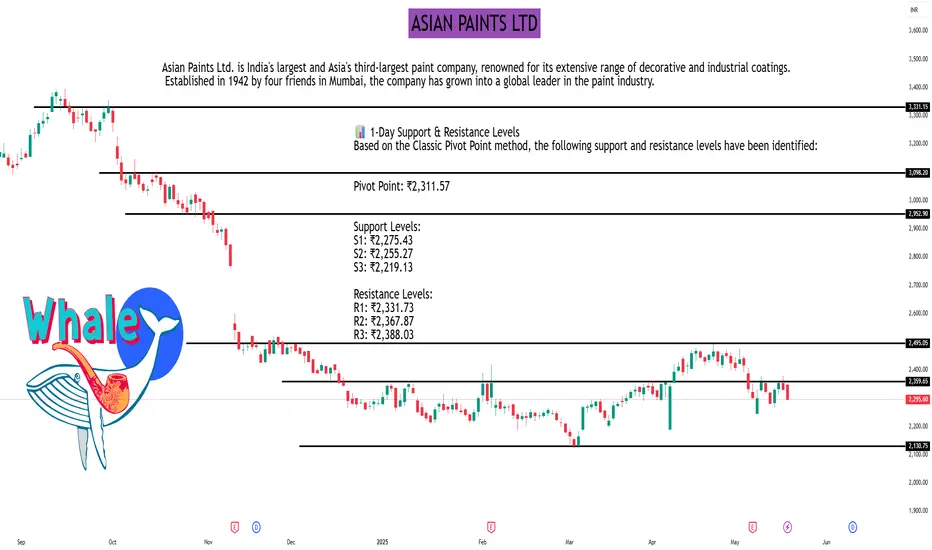
ASIAN PAINTS LTDAs of May 21, 2025, Asian Paints Ltd. (NSE: ASIANPAINT) closed at ₹2,295.60, reflecting a 1.54% decline from the previous day. The stock is currently trading approximately 32% below its 52-week high of ₹3,394.00, reached on September 16, 2024.
📊 1-Day Support & Resistance Levels
Based on the Classic Pivot Point method, the following support and resistance levels have been identified:
Pivot Point: ₹2,311.57
Support Levels:
S1: ₹2,275.43
S2: ₹2,255.27
S3: ₹2,219.13
Resistance Levels:
R1: ₹2,331.73
R2: ₹2,367.87
R3: ₹2,388.03
📈 Technical Indicators
Relative Strength Index (RSI): 41.88 – Indicates neutral momentum.
Moving Average Convergence Divergence (MACD): -15.56 – Suggests bearish momentum.
Average Directional Index (ADX): 17.09 – Reflects a weak trend strength.
Rate of Change (ROC): -5.80 – Points to a declining price momentum.
Money Flow Index (MFI): 29.47 – Indicates potential oversold conditions.
Supertrend: ₹2,468.26 – The current price is below this level, signaling a bearish trend.
📉 Moving Averages
50-day Simple Moving Average (SMA): ₹2,342.83
100-day SMA: ₹2,304.44
200-day SMA: ₹2,614.84
The current price is below all these moving averages, indicating a bearish outlook.
🔍 Market Outlook
Asian Paints Ltd. is exhibiting bearish signals across multiple technical indicators. The stock's position below key moving averages and a declining RSI suggest continued downward pressure. Traders should monitor the support levels closely; a breach below S1 (₹2,275.43) could indicate further downside, while a move above R1 (₹2,331.73) might suggest a potential reversal.
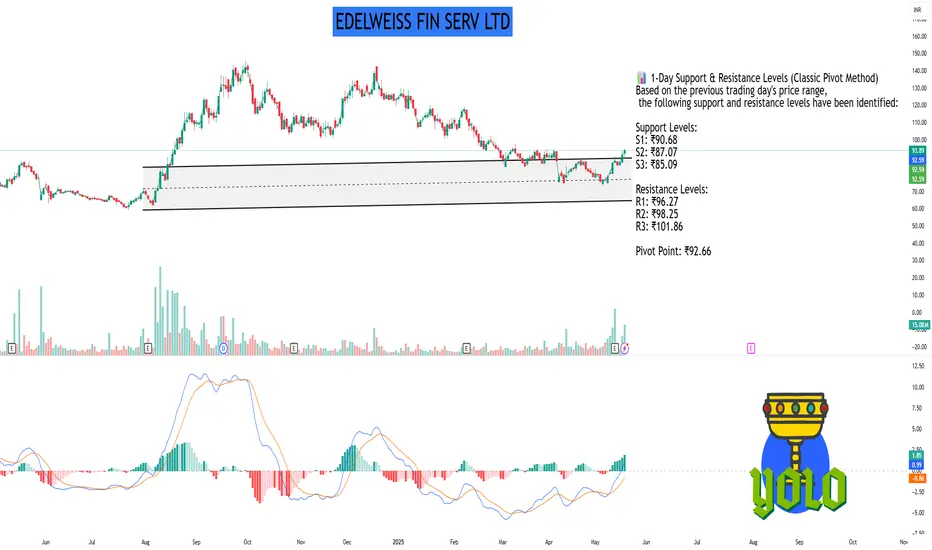
EDELWEISS FIN SERV LTDAs of May 21, 2025, Edelweiss Financial Services Ltd. (NSE: EDELWEISS) is trading at ₹93.89, marking a 2.84% increase over the previous day.
TradingView
📊 1-Day Support & Resistance Levels (Classic Pivot Method)
Based on the previous trading day's price range, the following support and resistance levels have been identified:
Support Levels:
S1: ₹90.68
S2: ₹87.07
S3: ₹85.09
Resistance Levels:
R1: ₹96.27
R2: ₹98.25
R3: ₹101.86
Pivot Point: ₹92.66
🔍 Technical Indicators
Relative Strength Index (RSI): 58.01 (indicates uptrend)
Commodity Channel Index (CCI): 62.68 (indicates uptrend)
Money Flow Index (MFI): 74.25 (indicates strong uptrend)
📈 Moving Averages
20-day EMA: ₹90.32
50-day EMA: ₹88.93
100-day EMA: ₹86.66
200-day EMA: ₹84.35
📝 Trading Insights
The current price is above the pivot point, suggesting a bullish stance. If the price continues to rise, it may test the resistance levels. Conversely, a drop below the pivot could lead to testing the support levels.