Intraday Institution Trading in Nifty and Banknifty BANKNIFTY Institutional Behavior
BANKNIFTY moves faster due to lower liquidity + banking stock hedging.
Institutions:
Accumulate ATM options early
Trigger stop hunts near high OI strikes
Expand range post 11:30 AM when gamma pressure builds
High-Probability Institutional Intraday Trades
VWAP Reclaim + OI Unwinding → Trend day setup
High OI Rejection + IV Drop → Mean reversion
Break of Call-Writer Zone with Volume → Momentum expansion
Institutional Rulebook
Trade levels, not emotions
Follow option writers, not candles
Price moves to hurt the maximum number of option holders
HDFCBANK

Advanced Intraday Institution Option TradingAdvanced Intraday Institutional Option Trading
Institutional intraday option trading focuses on order flow, volatility expansion, and hedging behavior, not prediction. Institutions deploy capital where liquidity, gamma, and vega sensitivity allow fast risk adjustment—usually in near-expiry (0DTE–3DTE) index options.
Institutional Interpretation
Max Call OI at 21,500 → Heavy call writing → Resistance
Rising Put OI at 21,400 → Strong downside hedge → Support
IV spike on Calls above 21,500 → Short covering risk → Breakout fuel
Balanced IV at ATM → Volatility expansion likely
High-Probability Intraday Trades
Gamma Scalping: Buy ATM options when IV expands + price holds VWAP
Directional Break: Long calls above call-writer resistance with OI unwinding
Volatility Fade: Sell options after IV spikes near key levels
Key Rule
Institutions trade structure, not direction.
Retail trades candles. Smart money trades the option chain.

Long Term Investment What is Bank Nifty (for long-term view)
Nifty Bank tracks India’s top banking stocks (HDFC Bank, ICICI Bank, SBI, Axis, etc.).
It’s:
🚀 High growth–oriented
📉 More volatile than Nifty 50
💰 Strongly linked to credit growth, interest rates, and the economy
Long-term verdict:
Great for growth if you can tolerate volatility.
Best ways to invest in Bank Nifty for the long term
1️⃣ Bank Nifty Index Mutual Funds (BEST for most people)
Passive funds that track Bank Nifty
Ideal for SIP + long horizon (7–10+ years)
Why this works
No stock picking risk
Lower expense ratio
Automatic rebalancing
👉 Suitable if you want set it and forget it

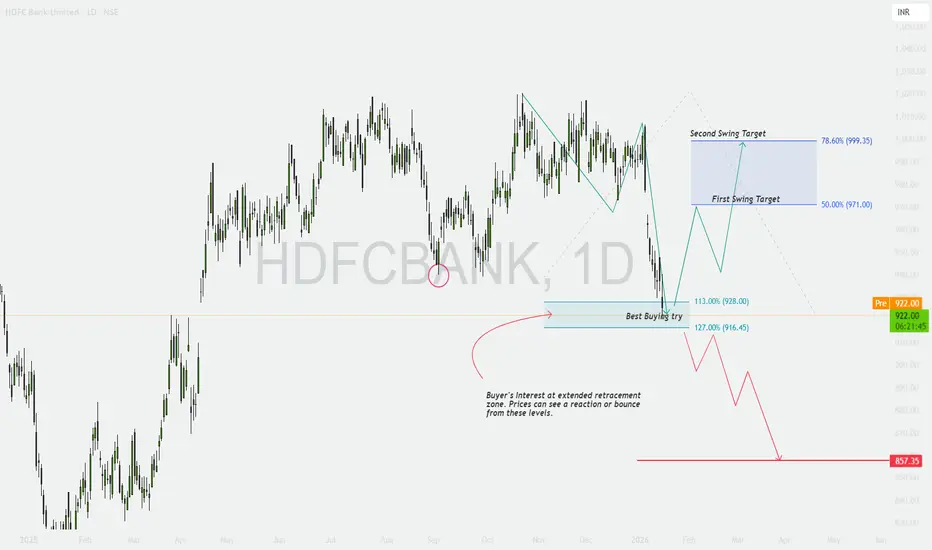
HDFCBANK - Extended Retracement Phase
📊 HDFC Bank – Daily Chart Update | Extended Retracement Phase
Timeframe: 1D
Trend Context: Medium-term correction within a broader structure
Current Price: ~₹925
🔍 What Changed from Previous Analysis? (Important Update)
Earlier, we discussed an ABC correction nearing completion around the ₹960–965 zone.
📉 Price failed to hold that zone, leading to a deeper, extended retracement.
Now the structure has evolved into an extended Fibonacci retracement, where buyers may re-emerge, but with higher risk.
📐 Fibonacci-Based Structure (Educational)
From the prior swing low → swing high:
113% Retracement: ~₹928
127% Retracement: ~₹916
➡️ This ₹916–928 zone is now marked as a “Best Buying Try” area, not blind buying.
📘 Extended retracements often invite short-covering + value buying, but confirmation is mandatory.
📌 Key Levels to Watch (Updated)
🟢 Support / Demand Zones
Primary Demand: ₹916–928
Major Breakdown Level: ₹857
🔴 Resistance / Recovery Zones
First Swing Target: ₹971 (50% retracement)
Second Swing Target: ₹999 (78.6% retracement)
Major Supply: ₹1,018–1,020
🟢 Bullish Scenario (Conditional Recovery)
If price:
Holds ₹916–928
Forms a base / reversal structure (daily close improvement, higher low)
Then:
First bounce toward ₹960–971
Sustained strength can extend toward ₹995–1,000
📈 This would be a relief rally, not trend reversal yet.
🔴 Bearish Scenario (Risk Case)
If price:
Breaks below ₹916 with daily close
Then:
Extended correction likely
Downside opens toward ₹880 → ₹857
📉 Below ₹916, buyers lose positional control.
🎓 Educational Insights
Extended retracements = high reward but high patience trades
Buying zones ≠ buying signals
Daily timeframe requires confirmation, not anticipation
Strong trends correct deeper before resuming
🧠 Options Trading View (Educational Only)
🟢 Near ₹916–928 (Only After Confirmation)
Bull Call Spread (ATM + OTM)
Put Credit Spread for range-bound recovery
🔴 If ₹916 Breaks
Bear Put Spread
Call Credit Spread near ₹960–980
⚠️ Avoid naked option selling in falling markets.
✅ DOs
✔ Wait for daily confirmation
✔ Trade zones, not emotions
✔ Use defined risk strategies
✔ Reduce position size during deep corrections
❌ DON’Ts
❌ Don’t average blindly
❌ Don’t assume every dip is the bottom
❌ Don’t ignore Fibonacci extensions
❌ Don’t overtrade volatility
🧾 Conclusion
HDFC Bank is now in an extended corrective phase.
The ₹916–928 zone is a potential demand area, but only confirmation will decide whether this becomes a base or a breakdown.
📌 Patience here is more profitable than prediction.
⚠️ Disclaimer
This analysis is for educational purposes only. I am not a SEBI registered analyst. Markets are risky, and I may be wrong. Please consult your financial advisor before trading.
Technical Analysis Vs Institutional Trading Option Trading Part1Technical Analysis (TA):
Uses charts & indicators to time entries/exits.
Best for directional option trades (calls/puts), short-term moves.
Institutional Trading:
Focuses on liquidity, options flow, open interest, gamma.
Best for selling premium and trading ranges with lower risk.
Bottom line:
👉 TA = when to trade
👉 Institutional = where & why price moves
👉 Best edge = use both together
Professional Reality (Important)
📌 Institutions don’t predict direction — they manage risk
📌 Retail traders try to be right — institutions try to get paid
📌 Options are a probability business, not a prediction game

HDFCBANK — 1H Technical Analysis
Timeframe: 1 Hour
Structure: Intermediate ABC correction within a broader uptrend
Current Price Zone: ~₹963
Trend Context: Higher-timeframe trend remains positive, short-term corrective phase in progress
🔍 Market Structure & Price Action (Educational View)
Price is currently forming an Intermediate corrective ABC structure after facing rejection near the ₹1,018–1,020 resistance band.
Wave (a): Sharp impulsive decline from the top
Wave (b): Retracement toward resistance, failed to make a new high
Wave (c): Ongoing decline, approaching a high-probability demand zone
This is a classic corrective pause, not a trend reversal unless key supports fail.
📌 Key Levels to Track
Major Resistance: ₹1,018–1,020
Reclaim Level (Trend Continuation): ₹975–980
ABC Completion / Demand Zone: ₹961–965
Critical Invalidation Level: ₹957
Breakdown Support (Risk Zone): ₹916
💡 Corrections often end where institutions previously accumulated — zones matter more than candles.
🟢 Bullish Scenario (Primary Plan)
If price holds above ₹961–965 and shows stabilization:
Confirmation signals to watch:
Bullish engulfing / strong rejection wick
Higher low on 15m–1h
Volume expansion on green candles
Upside Roadmap:
₹975 → ₹990 → ₹1,010
Sustained move above ₹980 opens doors for fresh highs over time
📘 This would confirm ABC completion and resumption of the larger uptrend.
🔴 Bearish Scenario (Risk Case)
If price breaks and sustains below ₹957:
ABC structure fails
Selling pressure may accelerate
Downside opens toward ₹930 → ₹916
📉 Below ₹957, probabilities shift from “buy-the-dip” to “protect capital”.
🎓 Educational Takeaways
Corrections are healthy pauses, not immediate sell signals
Always trade levels + confirmation, not hope
Bigger trend remains intact above ₹957
Sideways + choppy price = option sellers’ playground
🧠 Options Trading Strategies (Educational Only)
🟢 Bullish (Support Holds)
Strategy 1: Bull Call Spread
Buy ATM Call
Sell OTM Call (₹980/₹1000 zone)
Defined risk, lower theta decay
Strategy 2: Cash-secured Put (Aggressive)
Sell ₹960 PE only if price stabilizes
Suitable for experienced traders
🔴 Bearish (Support Breaks)
Strategy 1: Bear Put Spread
Buy ₹960 PE
Sell ₹920 PE
Risk-defined downside play
Strategy 2: Call Credit Spread
Sell ₹980 CE
Buy ₹1020 CE
Works best in breakdown + consolidation
⚠️ Avoid naked options near support zones.
✅ DOs
✔ Trade near key levels, not in the middle
✔ Use defined SL (₹957)
✔ Reduce position size during corrections
✔ Wait for price confirmation
❌ DON’Ts
❌ Don’t panic sell near demand zones
❌ Don’t over-leverage options during volatility
❌ Don’t assume every dip is a buying opportunity
❌ Don’t ignore higher-timeframe trend context
🧾 Summary & Conclusion
HDFC Bank is undergoing a controlled intermediate correction within a broader bullish structure.
The ₹961–965 zone is crucial — holding above this keeps the bullish roadmap intact, while a breakdown below ₹957 increases downside risk.
📌 Patience + confirmation = edge.
⚠️ Disclaimer
This analysis is for educational purposes only. I am not a SEBI registered analyst. Markets are risky, and I may be wrong. Please consult your financial advisor before taking any trade.

Bank Nifty – Head & Shoulders Breakdown AnalysisPattern: Head & Shoulders
Status: Neckline breakdown confirmed
Elliott Wave Position: End of Wave 5, beginning corrective wave.
Indicators: Bearish RSI + MACD divergence
Indicators Supporting the Breakdown
🟣 RSI Divergence
Clear bearish divergence between price (higher highs) and RSI (lower highs).
RSI now breaking mid-level (50), confirming shift from bullish → neutral → bearish momentum.
🔵 MACD Structure
MACD shows multiple negative divergences during right shoulder formation.
Bearish crossover already done.
Histogram contracting further indicates strengthening downside momentum.
Expected corrective move → ABC decline to at least Wave 4 price territory.
Wave 4 region sits around 57,500 – 58,000, matching H&S target
Trend Bias: Short-term bearish until retest of neckline or completion of A-wave drop.

Canarabank - Short Term BuySImple Technical Analysis.
Multiple PSU stocks are forming Flag&Pole pattern.
Canarabank - Hovering around Prev ATH.
Pattern BO will lead to 139.
Prev High Breakout will lead the Stock to 139/143/152/169.
Target Levels Based on Pattern target and Fibonocci Levels

Part 7 Trading Master Class Basics of Options in India
An option is a derivative contract that gives the holder the right but not the obligation to buy or sell an underlying asset (like Nifty, Bank Nifty, or a stock) at a predetermined price (called the strike price) before or on a specified date (expiry).
Call Option (CE): Gives the right to buy.
Put Option (PE): Gives the right to sell.
Traders use options for:
Hedging (protecting portfolio losses)
Speculation (betting on price movements)
Income generation (using premium decay)
In India, options are traded on exchanges like NSE and BSE, primarily on indices (Nifty, Bank Nifty, FinNifty) and individual stocks.

Real Knowledge of MarketCore Foundational Knowledge
Derivatives Basics: Options are derivative contracts, meaning their value is derived from an underlying asset (stocks, indices, commodities, etc.).
Key Terminology: A trader must be fluent in terms like call options (right to buy), put options (right to sell), strike price, premium, expiration date, intrinsic value, and time value.
Rights vs. Obligations: Understanding that option buyers have the right, but not the obligation, to exercise, while option sellers (writers) have the obligation if exercised, is fundamental to risk assessment.
Leverage: Options offer significant leverage, meaning a small amount of capital can control a large position in the underlying asset, which amplifies both potential profits and losses.

Real value of Market # Entry #Exit #Trail # StoplossThe phrase "Market # Entry #Exit #Trail # Stoploss" refers to the core parameters of a structured trading plan. The "real value" does not imply a single numerical figure, but rather the monetary gain or loss realized from a trade based on how these elements are defined and executed, combined with the discipline to follow them consistently.
Market: The specific financial instrument or market being traded (e.g., a particular stock, currency pair, or commodity).
Entry: The predefined price level or condition at which a trader opens a position. A good entry can offer a favorable risk-to-reward ratio from the start.
Exit: The predefined strategy or points at which a trader closes a position, either to take a profit or to limit a loss. Exits are crucial as they determine the final profit or loss.
Trail: Refers to a trailing stop-loss order, a dynamic risk management tool that automatically adjusts the stop-loss level as the market price moves in the trader's favor. This locks in profits while allowing the trade to continue if the price keeps moving favorably.
Stoploss (SL): A pre-determined price level or percentage below (for a long position) or above (for a short position) the entry price where the position is automatically closed to prevent further losses if the market moves against the trader.

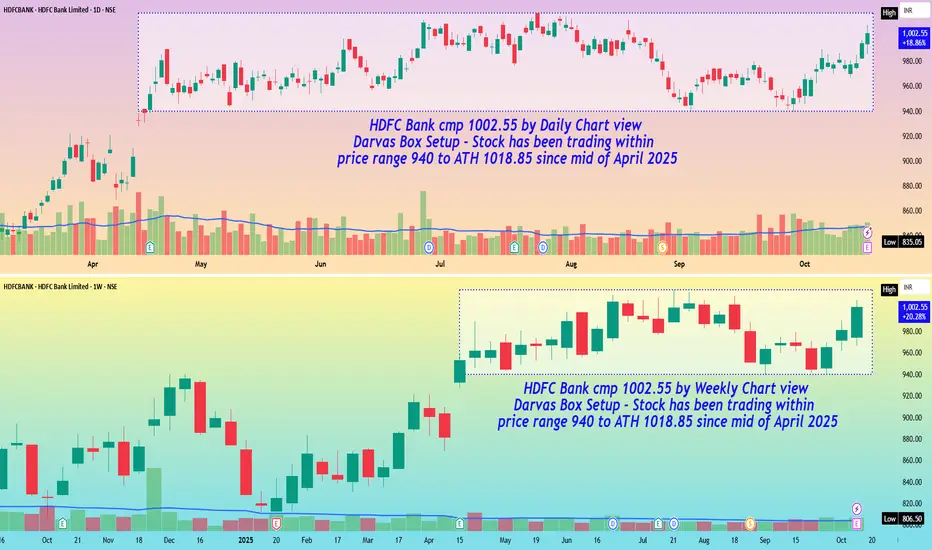
HDFC Bank cmp 1002.55 by Daily and Weekly Chart viewHDFC Bank cmp 1002.55 by Daily and Weekly Chart view
- Darvas Box Setup : Stock has been trading within price range 940 to ATH 1018.85 since mid of April 2025
- Stock chart has made Bullish Rounding Bottoms on both timeframes providing a technically logical upside target of +/- 1100 in the near future
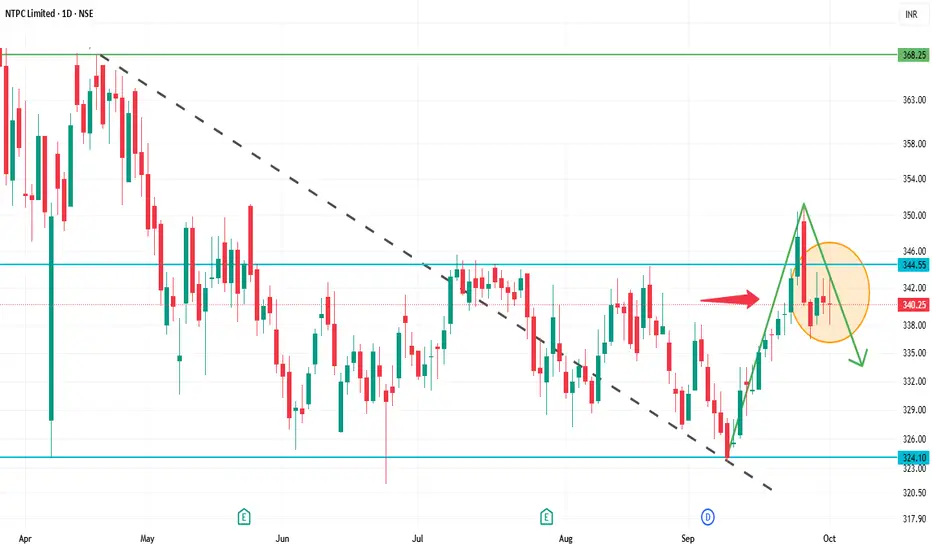
NTPC 1D Time frameCurrent Snapshot
Current Price: ₹340.25
52-Week High: ₹447.75
52-Week Low: ₹292.80
Strategy & Outlook
Bearish Bias: The stock is in a short-term downtrend with negative momentum indicators.
Selling Opportunity: Consider selling near resistance zones (₹343–₹345) with a target towards ₹335–₹340.
Risk Management: Place stop-loss orders above the resistance levels to manage potential upside risks.
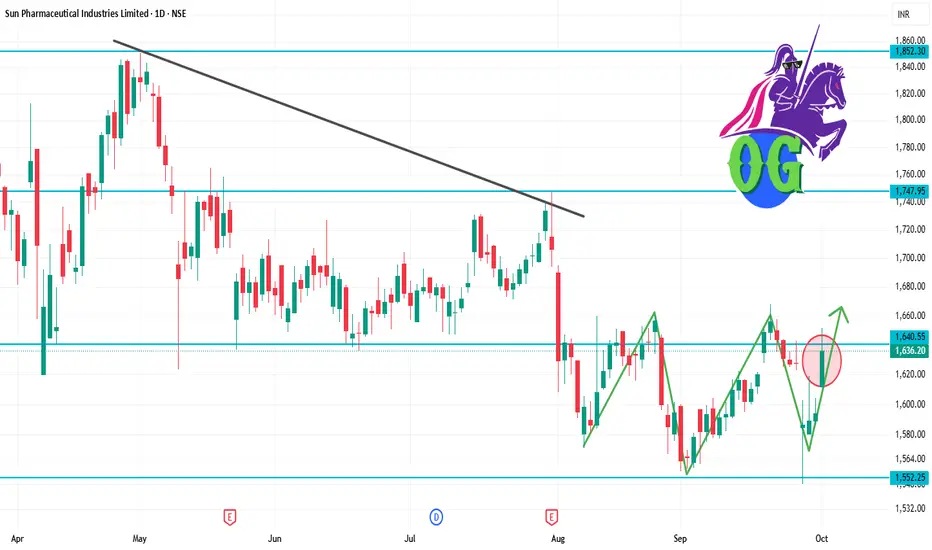
SUNPHARMA 1D Time frameCurrent Snapshot
Current Price: ₹1,636.20
52-Week High: ₹1,952.25
52-Week Low: ₹1,548.00
Strategy & Outlook
Bullish Bias: The stock is in a short-term uptrend with positive momentum indicators.
Buying Opportunity: Consider entering near support zones (₹1,600–₹1,610) with a target towards ₹1,650–₹1,670.
Risk Management: Place stop-loss orders below the support levels to manage potential downside risks.
SBIN 1D Time frameCurrent Price (approx): ₹864
52-Week Low: ₹680
52-Week High: ₹880.50
Daily Chart Explanation
On the 1-day timeframe, SBIN is moving near its upper range, close to the recent high. This means the stock is strong but also facing heavy resistance.
Trend: Uptrend overall (higher highs and higher lows).
Momentum: Price is consolidating near resistance, showing hesitation.
Candles: Recent candles show wicks near the top, which means sellers are active near ₹880.

BRITANNIA 1D Time frameCurrent Price: ~₹5,953.50
Day’s Range: ₹5,939.50 – ₹6,036.00
52-Week Range: ₹4,506.00 – ₹6,469.90
📏 Key Levels
Immediate Resistance: ~₹6,300
Next Resistance: ~₹6,470 (52-week high)
Immediate Support: ~₹5,800
Next Supports: ~₹5,600 and ₹5,300
🧠 Insights
If Britannia breaks above ₹6,300 with volume, it may push toward ₹6,470+ (new highs).
If it fails to break resistance, expect sideways movement or a pullback toward ₹5,800.
A break below ₹5,800 would signal weakness and can drag it down toward ₹5,600–₹5,300 levels.

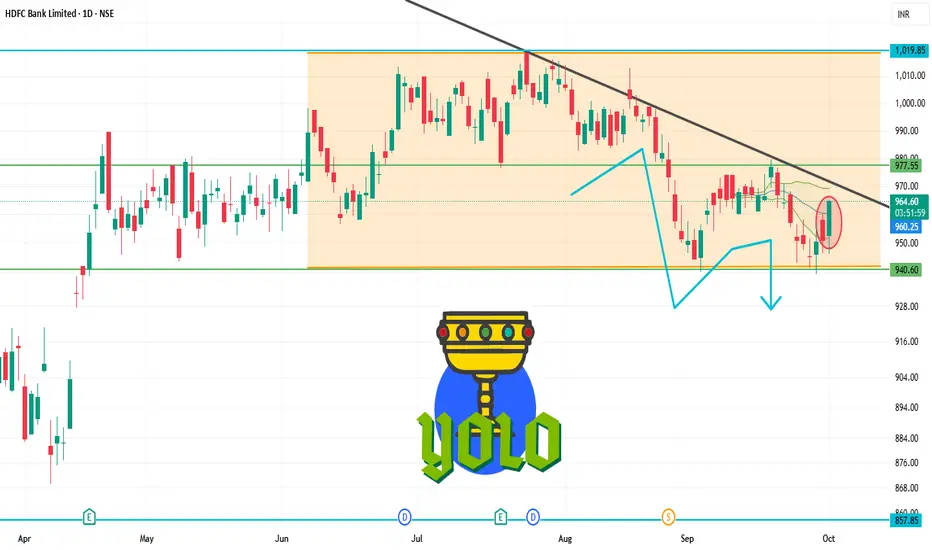
HDFCBANK 1D Time frameOpening Price: ₹950.30
Closing Price: ₹960.45
Day Range: ₹946.00 – ₹961.40
Previous Close: ₹950.30
🧠 Price Action Insights
The stock is trading below key moving averages, confirming the bearish trend.
No significant reversal pattern has formed, suggesting the downtrend may continue.
Watch for a breakout above ₹970.00 for a potential trend reversal.
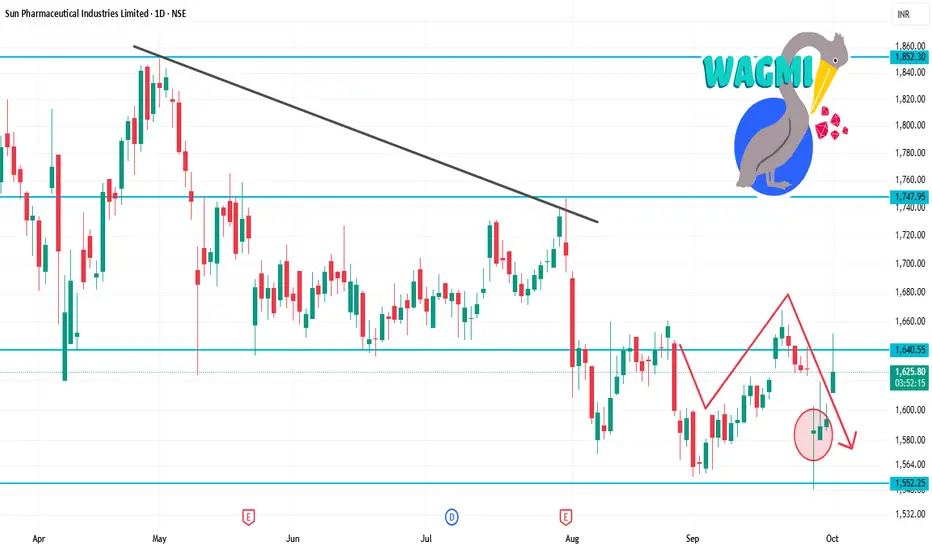
SUNPHARMA 1D Time frameOpening Price: ₹1,611.90
Closing Price: ₹1,628.20
Day Range: ₹1,611.90 – ₹1,651.50
Previous Close: ₹1,594.30
📉 Trend Analysis
Short-Term Trend: Bearish — The stock is trading below key moving averages, confirming the bearish trend.
Medium-Term Trend: Neutral — The stock is in a consolidation phase, characterized by lower highs and lower lows.
Long-Term Trend: Neutral — No significant trend identified; the stock is trading within a range.
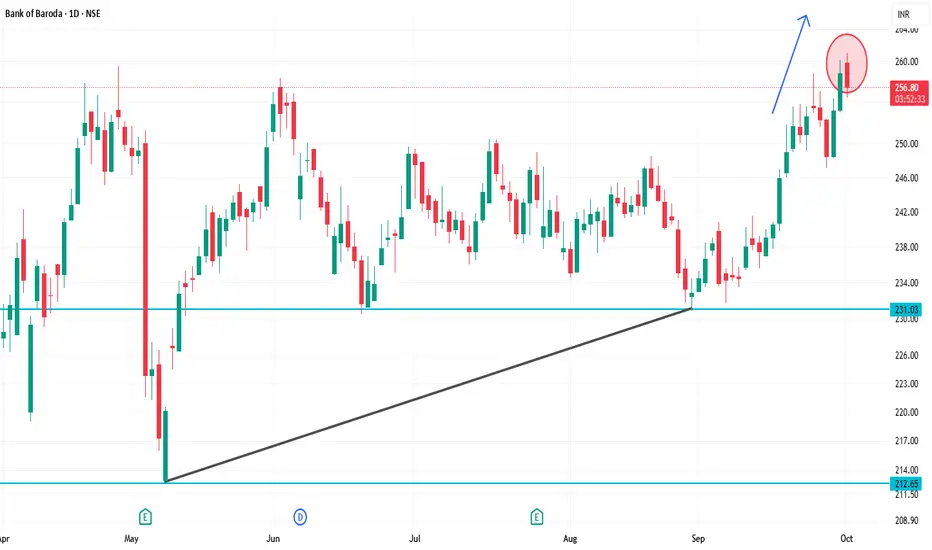
BANKBARODA 1D Time frameClosing Price: ₹257.60
Day Range: ₹253.70 – ₹260.00
Previous Close: ₹258.54
📉 Trend Analysis
Short-Term Trend: Bearish — The stock is trading below key moving averages, confirming the bearish trend.
Medium-Term Trend: Neutral — The stock is in a consolidation phase, characterized by lower highs and lower lows.
Long-Term Trend: Neutral — No significant trend identified; the stock is trading within a range.
🔮 Conclusion
Bank of Baroda is in a bearish trend with weak momentum.
Break below ₹250.00 could lead to further decline toward ₹245.00.
Break above ₹265.00 would indicate a potential trend reversal.
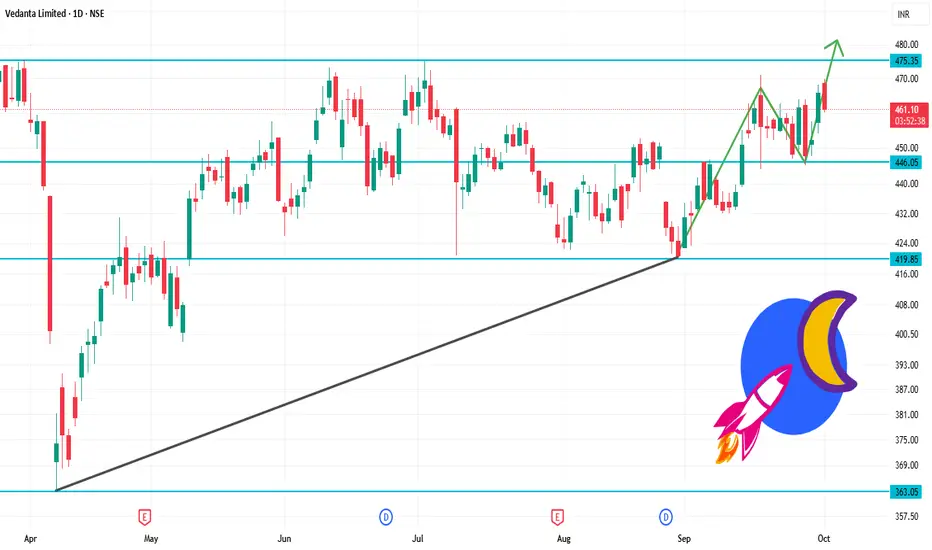
VEDL 1D Time frameOpening Price: ₹468.55
Closing Price: ₹461.40
Day Range: ₹463.00 – ₹469.85
Volume: 2,730,213 shares traded
📉 Trend Analysis
Short-Term Trend: Bearish – The stock is trading below key moving averages, confirming the bearish trend.
Medium-Term Trend: Neutral – The stock is in a consolidation phase, characterized by lower highs and lower lows.
Long-Term Trend: Neutral – No significant trend identified; the stock is trading within a range.
🔮 Conclusion
Vedanta Ltd. is in a bearish trend with weak momentum.
Break below ₹460.00 could lead to further decline toward ₹455.00.
Break above ₹475.00 would indicate a potential trend reversal.
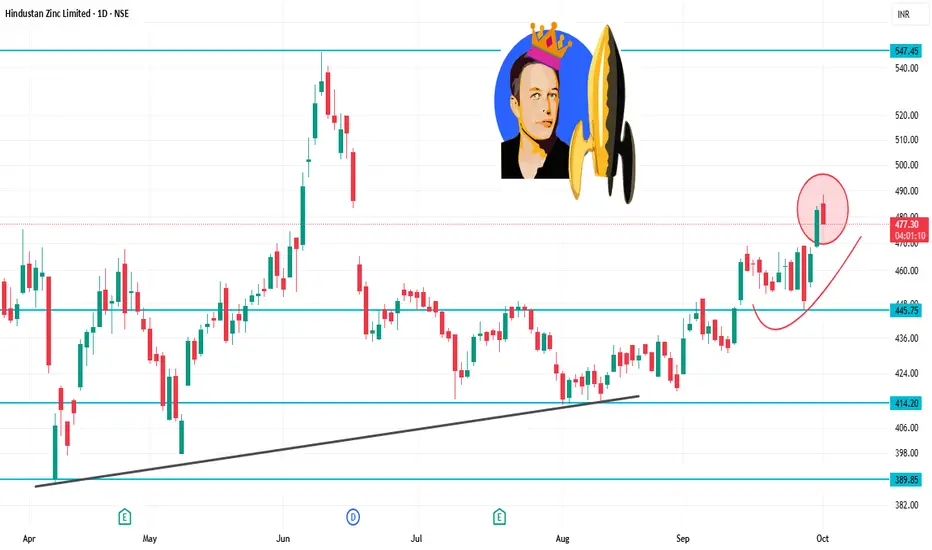
HINDZINC 1D Time frameDay Range: ₹478.35 – ₹488.40
52-Week Range: ₹378.15 – ₹575.40
Volume: 284,459 shares traded
📉 Trend Analysis
The stock is in a downtrend, characterized by:
Lower highs and lower lows.
Failure to break above resistance levels.
The short-term trend remains bearish.
🔮 Conclusion
Hindustan Zinc is in a downtrend with weak momentum.
Break below ₹470.00 could lead to further decline toward ₹460.00.
Break above ₹495.00 would indicate a potential trend reversal.
HEROMOTOCO 1D Time frame📌 Current Status
Closing Price: ₹5,410
Day Change: –35 points (–0.64%)
Day’s High: ₹5,470
Day’s Low: ₹5,380
52-Week Range: ₹4,800 – ₹6,050
🔍 Chart & Price Action Insights
Price is moving sideways, bouncing between support and resistance.
Bulls are defending ₹5,380
Sellers resist above ₹5,470
Watch for a break above ₹5,470 for potential upward momentum
Break below ₹5,380 may trigger a short-term decline toward ₹5,330

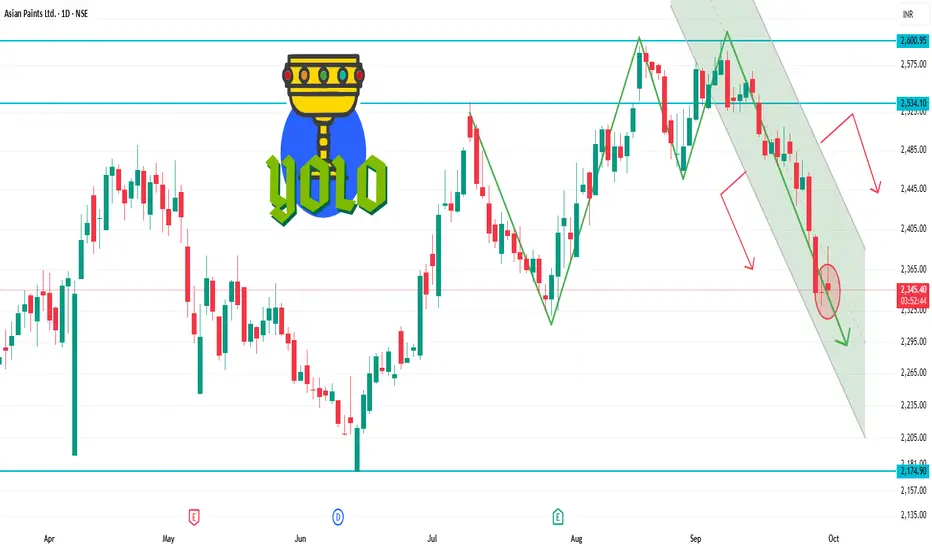
ASIANPAINT 1D Time frameCurrent Price Snapshot
Current Price: ₹2,345.50
Day’s Range: ₹2,342.00 – ₹2,388.80
52-Week Range: ₹2,124.75 – ₹3,358.00
Technical Indicators
RSI (14-day): 44.19 — indicates a neutral to slightly bearish momentum.
MACD: -4.010 — suggests bearish momentum.
Moving Averages:
5-day: ₹2,396.00 — indicates a Sell signal.
50-day: ₹2,389.00 — indicates a Sell signal.
200-day: ₹2,350.00 — indicates a Neutral signal.
Technical Summary: Predominantly Sell signals across various indicators.
Summary
Above ₹2,388.80: Potential rise toward ₹2,400 – ₹2,420.
Below ₹2,342.00: Potential fall toward ₹2,320 – ₹2,300.
Between ₹2,300 – ₹2,380: Likely range-bound movement.