Option Trading Introduction to Options Trading
Imagine you want to buy a house. You like one particular property, but you don’t want to commit right away. Instead, you tell the seller:
"Here’s ₹1 lakh. Keep this house reserved for me for the next 6 months. If I decide to buy, I’ll pay you the agreed price. If not, you can keep this ₹1 lakh."
That ₹1 lakh you gave is called a premium. The deal you made is an option — a contract that gives you the right but not the obligation to buy the house.
This is the core idea of options trading: you pay a small premium to get the right to buy or sell something (like stocks, indexes, commodities, etc.) at a fixed price in the future.
What is an Option?
An option is a contract between two parties:
Buyer of option (the one who pays the premium).
Seller of option (the one who receives the premium).
The buyer has the right (but not obligation) to buy or sell at a certain price. The seller has the obligation to fulfill the deal if the buyer exercises the option.
Key Terms:
Underlying Asset → The thing on which the option is based (stocks like Reliance, Infosys, indexes like Nifty, commodities, etc.).
Strike Price → The pre-decided price at which the buyer can buy or sell.
Premium → The cost of buying the option.
Expiry → The last date till which the option is valid.
Lot Size → Options are traded in fixed quantities, not single shares. Example: Nifty options lot = 50 shares.
HDFCBANK

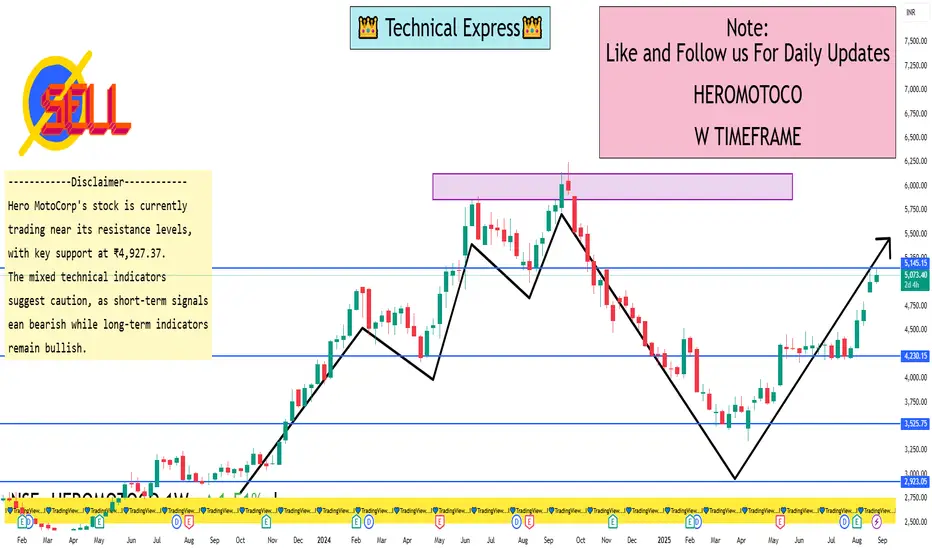
Heromotoco Ltd 1 Week ViewWeekly Support & Resistance Levels
Immediate Support: ₹4,927.37
Primary Support: ₹4,683.00
Immediate Resistance: ₹5,039.60
Primary Resistance: ₹5,216.60
These levels are derived from standard pivot point calculations and can serve as potential zones where the stock might experience buying or selling pressure.
Technical Indicators
Relative Strength Index (RSI): 67.39 – Neutral
MACD: 201.20 – Sell
Stochastic RSI: 89.90 – Sell
Moving Averages:
5-day: ₹5,066.46 – Sell
20-day: ₹4,624.92 – Buy
50-day: ₹4,408.96 – Buy
200-day: ₹4,125.66 – Buy
The overall technical outlook is mixed, with short-term indicators showing a sell signal and longer-term indicators indicating a buy.
Introduction to Stock Markets1. What is a Stock Market?
At its core, a stock market is a marketplace where buyers and sellers trade shares of publicly listed companies. A share represents a unit of ownership in a company, meaning that if you own a share, you essentially own a part of that company.
Stock markets serve multiple functions:
Raising Capital: Companies issue shares to raise funds for expansion, research, or debt repayment.
Liquidity: They allow investors to buy and sell shares easily.
Price Discovery: They determine the market value of companies based on supply and demand.
Investment Opportunities: They provide avenues for individuals and institutions to grow their wealth.
Two primary types of stock markets exist:
Primary Market: Where companies issue new shares through an Initial Public Offering (IPO) to raise capital.
Secondary Market: Where existing shares are traded among investors. Examples include the New York Stock Exchange (NYSE), NASDAQ, and India’s National Stock Exchange (NSE) and Bombay Stock Exchange (BSE).
2. History and Evolution of Stock Markets
The concept of stock markets dates back to the 17th century. The first organized stock exchange, the Amsterdam Stock Exchange, was established in 1602 for trading shares of the Dutch East India Company. Over time, stock markets spread globally, evolving into sophisticated institutions with advanced trading systems, regulations, and digital platforms.
Key milestones in stock market history include:
1792: The Buttonwood Agreement in New York, which marked the start of the NYSE.
1971: NASDAQ introduced electronic trading, revolutionizing speed and accessibility.
1990s: Introduction of online trading platforms, making markets accessible to retail investors.
3. Importance of Stock Markets
Stock markets are critical for both individual investors and the overall economy.
3.1 Economic Growth
Companies raise capital through stock issuance to expand operations, hire employees, and innovate.
Capital formation fuels industrial growth, increasing productivity and GDP.
3.2 Wealth Creation
Long-term investment in equities historically outperforms other asset classes like bonds or savings accounts.
Compound growth in stock investments allows individuals to accumulate substantial wealth over time.
3.3 Price Transparency
Stock markets provide real-time pricing based on supply and demand, reflecting the true value of companies.
Transparent markets reduce information asymmetry and promote investor confidence.
3.4 Corporate Governance
Listed companies must comply with regulatory norms and disclose financial information, ensuring accountability.
Shareholders gain a voice in company decisions through voting rights.
4. Types of Stocks
Stocks are not uniform. They vary based on ownership, risk, and returns. Common types include:
4.1 Common Stocks
Represent ownership in a company with voting rights.
Returns come in the form of dividends and capital appreciation.
4.2 Preferred Stocks
Offer fixed dividends but limited voting rights.
Generally less volatile than common stocks.
4.3 Growth vs. Value Stocks
Growth Stocks: Companies expected to grow faster than the market average. Returns are mostly capital gains.
Value Stocks: Companies trading below their intrinsic value, often providing steady dividends.
4.4 Blue-Chip Stocks
Large, financially stable companies with strong performance histories.
Example: Reliance Industries, Apple, Microsoft.
5. How the Stock Market Works
The stock market operates on the principles of supply and demand. Prices rise when demand exceeds supply and fall when supply exceeds demand.
5.1 Market Participants
Retail Investors: Individuals trading for personal wealth creation.
Institutional Investors: Banks, mutual funds, hedge funds trading in large volumes.
Traders: Short-term participants aiming to profit from price movements.
Market Makers: Entities that ensure liquidity by buying and selling securities.
5.2 Stock Exchanges
A stock exchange is a regulated platform where stocks are bought and sold.
Examples include NYSE, NASDAQ, NSE, and BSE.
Exchanges maintain transparency, liquidity, and security of transactions.
5.3 Trading Process
Placing an Order: Investors place buy/sell orders through brokers.
Matching Orders: Exchanges match buy and sell orders based on price and time priority.
Settlement: Transfer of ownership and funds between buyer and seller, usually within 2–3 days.
6. Factors Affecting Stock Prices
Stock prices fluctuate constantly. Factors include:
Company Performance: Revenue, profits, and management quality influence investor sentiment.
Economic Indicators: GDP growth, inflation, and unemployment rates impact markets.
Market Sentiment: Investor psychology, fear, and greed can cause volatility.
Global Events: Wars, pandemics, and geopolitical tensions affect prices.
Interest Rates: Higher rates can reduce investment in equities.
7. Stock Market Indices
A stock market index measures the performance of a group of stocks. Examples:
Nifty 50 (India): Represents 50 large companies listed on NSE.
Sensex (India): Comprises 30 leading BSE-listed companies.
S&P 500 (USA): Tracks 500 major US companies.
Indices provide a snapshot of market trends and investor sentiment.
8. Investment Strategies
Investors use various strategies to achieve their financial goals.
8.1 Long-Term Investing
Focused on wealth creation over years.
Often involves buying and holding blue-chip or growth stocks.
8.2 Trading
Short-term buying and selling to profit from price fluctuations.
Types include day trading, swing trading, and momentum trading.
8.3 Value Investing
Buying undervalued stocks based on fundamental analysis.
Popularized by Warren Buffett.
8.4 Growth Investing
Focused on companies with high growth potential.
Prioritizes capital gains over dividends.
9. Risks in the Stock Market
Investing in stocks involves risk. Common risks include:
Market Risk: Overall market movements affect stock prices.
Company Risk: Poor management or declining performance can lead to losses.
Liquidity Risk: Difficulty in selling stocks without affecting price.
Interest Rate Risk: Rising rates may reduce stock prices.
Inflation Risk: High inflation can erode real returns.
Risk management strategies, such as diversification and stop-loss orders, are crucial.
10. Regulatory Framework
Stock markets are heavily regulated to protect investors and maintain stability. Key regulatory bodies include:
SEBI (India): Securities and Exchange Board of India.
SEC (USA): Securities and Exchange Commission.
FCA (UK): Financial Conduct Authority.
These organizations enforce rules on listing, trading, disclosures, insider trading, and investor protection.
Conclusion
The stock market is a powerful tool for wealth creation, economic growth, and corporate financing. Understanding its structure, functions, and risks is essential for any investor. While markets can be volatile and unpredictable, disciplined investing, research, and risk management can make the stock market a reliable avenue for achieving financial goals.
Investing in stocks is not just about money—it’s about knowledge, patience, and strategic decision-making. By embracing these principles, anyone can navigate the stock market successfully, turning it into a lifelong tool for financial empowerment.
Options Trading Basics1. Introduction: What Are Options?
When you hear the word “options” in trading, it might sound complicated. But the truth is, options are just financial contracts that give you a choice.
The word “option” itself means a choice or possibility. In the stock market, options give you the right (but not the obligation) to buy or sell an asset (like stocks, index, or commodity) at a fixed price within a specific time.
If you buy an option, you’re buying the right to do something in the market.
If you sell (write) an option, you’re giving someone else that right.
Think of it like booking a movie ticket online. You pay ₹200 to book a seat (premium). If you go to the movie, great. If you skip it, you lose the ₹200 booking fee. That’s how options work—you pay for the right, but you don’t have to use it.
2. Why Do People Trade Options?
Options are popular because they offer flexibility and leverage. Traders and investors use options for three main reasons:
Speculation (to make profits) – Betting on stock prices moving up or down.
Hedging (to protect investments) – Like insurance for your portfolio.
Income generation – Selling options to earn premiums regularly.
Example:
Suppose you think Reliance stock (currently ₹2,500) will rise to ₹2,700. Instead of buying 100 shares (₹2,50,000 required), you can buy a call option by paying just ₹5,000 premium. If Reliance rises, your profit can be huge compared to the small amount invested.
That’s why options are powerful. But with power comes risk, so you need to understand the basics deeply.
3. Key Terms in Options Trading
Before diving deeper, let’s learn the basic vocabulary:
Underlying Asset: The stock or index on which the option is based (like Reliance, TCS, or Nifty50).
Strike Price: The fixed price at which you can buy/sell the asset using the option.
Expiry Date: The last date until the option is valid.
Premium: The price you pay to buy an option.
Lot Size: Options are traded in fixed quantities called lots (e.g., Nifty option lot size = 50 units).
In-the-Money (ITM): When exercising the option is profitable.
Out-of-the-Money (OTM): When exercising the option gives no benefit.
At-the-Money (ATM): When the strike price is the same as the market price.
Keep these terms in mind—we’ll use them often.
4. Two Types of Options: Call & Put
There are only two types of options you need to remember:
a) Call Option (Right to Buy)
A call option gives the buyer the right (not obligation) to buy a stock at a fixed strike price.
You buy a call when you expect the stock price will go up.
Example:
Reliance is at ₹2,500.
You buy a Reliance Call option with strike price ₹2,600 by paying ₹50 premium.
If Reliance goes to ₹2,700, your option is profitable.
If Reliance stays below ₹2,600, you lose only the premium (₹50).
b) Put Option (Right to Sell)
A put option gives the buyer the right (not obligation) to sell a stock at a fixed strike price.
You buy a put when you expect the stock price will go down.
Example:
Infosys is at ₹1,400.
You buy a Put option with strike price ₹1,380 for ₹20 premium.
If Infosys falls to ₹1,350, your put option is profitable.
If Infosys goes above ₹1,380, you lose only the premium.
5. Who Are the Players in Options Trading?
There are two sides in every option contract:
Option Buyer – Pays premium, gets the right (call = buy, put = sell).
Limited risk (only the premium).
Unlimited profit potential.
Option Seller (Writer) – Receives premium, gives the right.
Limited profit (only the premium).
Unlimited risk potential.
This is like insurance:
Buyer = person buying insurance (pays premium).
Seller = insurance company (earns premium but takes big risk).
6. How Options Work in Real Life (Simple Example)
Let’s simplify with a real-life analogy.
Imagine you want to buy a flat worth ₹50 lakhs, but you’re not sure. So, you sign an agreement with the owner:
You pay ₹2 lakhs today as an advance (premium).
The agreement says: Within 6 months, you can buy the flat at ₹50 lakhs (strike price).
If flat prices rise to ₹60 lakhs, you can still buy it for ₹50 lakhs—huge profit!
If flat prices drop to ₹45 lakhs, you won’t buy. You just lose the ₹2 lakhs advance.
That’s exactly how options trading works.
7. How to Read an Option Quote
Let’s say you see this on NSE:
Nifty 18,000 CE @ ₹120, Expiry 30-August
Breaking it down:
Nifty = Underlying asset
18,000 = Strike price
CE = Call Option
₹120 = Premium (price of the option)
30-August = Expiry date
So, if you buy this option, you are paying ₹120 × 50 (lot size) = ₹6,000 to get the right to buy Nifty at 18,000 before expiry.
8. How Option Prices Are Decided
Option premiums are influenced by:
Intrinsic Value – The real value (how much profit if exercised now).
Time Value – Extra premium for the time left until expiry.
Volatility – If stock moves a lot, option premiums become expensive.
Interest rates & demand-supply – Minor factors.
9. Payoff Scenarios: Buyer vs Seller
Call Option Buyer
Profit if price rises above strike + premium.
Loss limited to premium.
Call Option Seller
Profit limited to premium received.
Loss unlimited if price rises sharply.
Put Option Buyer
Profit if price falls below strike - premium.
Loss limited to premium.
Put Option Seller
Profit limited to premium received.
Loss unlimited if price crashes.
10. Options vs Futures vs Stocks
Stocks: Buy & hold actual shares.
Futures: Agreement to buy/sell at fixed price in future (obligation).
Options: Right, but not obligation, to buy/sell.
That “no obligation” part makes options unique.
11. Strategies in Options Trading (Basics)
You don’t always have to just buy or sell a single option. Traders use strategies by combining call & put options.
Some basic strategies:
Buying Calls – When you expect big upward movement.
Buying Puts – When you expect big downward movement.
Covered Call – Holding stock + selling call to earn income.
Protective Put – Holding stock + buying put as insurance.
Straddle – Buy call + put at same strike (expecting big movement either side).
Iron Condor – Complex strategy to earn steady premium in range-bound market.
12. Advantages of Options Trading
Leverage – Small capital, big exposure.
Limited Risk for Buyers – Risk only the premium.
Flexibility – Can profit in up, down, or sideways markets.
Hedging Tool – Protects portfolio.
Income Generation – Selling options brings regular premium income.
Conclusion
Options trading is like a double-edged sword. Used wisely, it can give you high returns, protection, and steady income. Used recklessly, it can lead to massive losses.
So, learn the basics, understand risk, and start step by step. Once you master it, options become one of the most powerful tools in the financial market.
Part 2 Support and ResistanceWhy Trade Options? (Advantages)
Leverage: Small capital controls big positions.
Hedging: Protect stock portfolio from losses.
Flexibility: Profit in bullish, bearish, or sideways markets.
Income: Selling options generates consistent premiums.
Risk Control: Losses can be predefined by structuring trades.
8. Risks of Options Trading
Time Decay (Theta): Options lose value as expiration approaches.
Liquidity Risk: Not all options are actively traded.
Complexity: Strategies can be difficult for beginners.
Unlimited Risk (for sellers): Selling naked calls can wipe out capital.
Over-leverage: Small margin requirements may encourage oversized positions.

PCR Trading StrategyKey Terms in Options Trading
Before diving into strategies, let’s master some core concepts:
Underlying Asset: The stock/index/commodity on which the option is based.
Strike Price: The price at which the option can be exercised.
Expiration Date: The date on which the option contract ends.
Premium: The price paid by the option buyer to the seller (writer) for the contract.
In-the-Money (ITM): Option has intrinsic value (profitable if exercised).
At-the-Money (ATM): Underlying price = Strike price.
Out-of-the-Money (OTM): Option has no intrinsic value yet (not profitable to exercise).
Lot Size: Options are traded in lots (e.g., Nifty option has a fixed lot of 50 units).
Leverage: Options allow control of large positions with smaller capital.
How Options Work
Options are like insurance. Imagine you own a house worth ₹50 lakh and buy insurance. You pay a small premium so that if the house burns down, you can recover your value. Similarly:
A call option is like paying for the right to buy a stock cheaper later.
A put option is like insurance against stock prices falling.

Options Trading Strategies1. Introduction to Options Trading
Options are one of the most versatile financial instruments available in the stock market. Unlike straightforward stock trading, where you buy or sell shares, options give you the right but not the obligation to buy or sell an underlying asset at a pre-determined price within a specific time.
Because of their flexibility, options allow traders to:
Hedge against risk,
Generate income,
Speculate on market direction, or
Even profit from volatility itself.
Options trading strategies are structured combinations of options (calls, puts, or both) that help traders tailor risk and reward according to their outlook. Understanding these strategies is essential because options are a double-edged sword: they can multiply profits but also magnify risks if used incorrectly.
2. Basics of Options
Before diving into strategies, let’s recap the key concepts:
Call Option → Right to buy the asset at a certain price. (Bullish in nature)
Put Option → Right to sell the asset at a certain price. (Bearish in nature)
Strike Price → Pre-decided price at which the option can be exercised.
Premium → Cost of buying the option.
Expiry → The date on which the option contract ends.
In the Money (ITM) → Option has intrinsic value.
Out of the Money (OTM) → Option has no intrinsic value, only time value.
Understanding these basics is critical because all option strategies are built using calls and puts in different combinations.
3. Why Use Option Strategies?
Traders and investors don’t just buy calls and puts randomly. Instead, they use structured strategies to achieve specific goals:
Hedging: Protecting a stock portfolio against downside risk.
Income Generation: Earning premium by selling options.
Speculation: Taking directional bets with limited risk.
Volatility Trading: Profiting from changes in implied volatility regardless of direction.
4. Categories of Option Strategies
Option strategies can be grouped into four main categories:
Bullish Strategies → Profit when the market rises (e.g., Bull Call Spread, Covered Call).
Bearish Strategies → Profit when the market falls (e.g., Bear Put Spread, Protective Put).
Neutral Strategies → Profit when the market stays in a range (e.g., Iron Condor, Butterfly).
Volatility Strategies → Profit from volatility expansion/contraction (e.g., Straddle, Strangle).
5. Popular Options Trading Strategies
Let’s dive into some of the most commonly used strategies with examples, payoff logic, pros, and cons.
5.1 Covered Call (Income Strategy)
How it works: Hold the stock + sell a call option.
Example: Own 100 shares of Reliance at ₹2,500. Sell a call with strike ₹2,600 for ₹30 premium.
Payoff:
If Reliance stays below ₹2,600 → keep shares + earn ₹30 premium.
If Reliance rises above ₹2,600 → shares are sold at ₹2,600 but you still keep the premium.
Pros: Steady income, reduces cost of holding.
Cons: Caps upside potential.
5.2 Protective Put (Insurance Strategy)
How it works: Hold stock + buy a put option.
Example: Buy Infosys at ₹1,400. Buy a put with strike ₹1,350 at ₹20 premium.
Payoff:
If stock rises → unlimited upside, only premium lost.
If stock falls → downside limited at strike price.
Pros: Protects against big losses.
Cons: Premium cost reduces profit.
5.3 Bull Call Spread (Moderately Bullish)
How it works: Buy a lower strike call + Sell a higher strike call.
Example: Buy Nifty 19,800 Call at ₹200, Sell 20,200 Call at ₹80. Net cost = ₹120.
Payoff:
Max profit = Difference in strikes – net premium = ₹400 – ₹120 = ₹280.
Max loss = ₹120 (premium paid).
Pros: Limited risk, limited reward.
Cons: Capped profit even if market rallies big.
5.4 Bear Put Spread (Moderately Bearish)
How it works: Buy a higher strike put + sell a lower strike put.
Example: Buy 19,800 Put at ₹220, Sell 19,400 Put at ₹100. Net cost = ₹120.
Payoff:
Max profit = Difference in strikes – net premium = ₹400 – ₹120 = ₹280.
Max loss = ₹120 (premium).
Pros: Controlled bearish play.
Cons: Capped profit.
5.5 Straddle (Volatility Play)
How it works: Buy 1 Call + 1 Put of the same strike.
Example: Nifty at 20,000 → Buy 20,000 Call (₹200) + Buy 20,000 Put (₹180). Total = ₹380.
Payoff:
If Nifty moves sharply either side (>₹380), profit.
If Nifty stays near 20,000, loss of premium.
Pros: Profits from big moves.
Cons: Expensive, time decay hurts if market is flat.
5.6 Strangle (Cheaper Volatility Play)
How it works: Buy OTM Call + OTM Put.
Example: Buy 20,200 Call (₹120) + Buy 19,800 Put (₹100). Cost = ₹220.
Payoff: Needs larger move than straddle, but cheaper.
Pros: Lower cost.
Cons: Requires significant market move.
5.7 Iron Condor (Range-Bound Strategy)
How it works: Combine a Bull Put Spread + Bear Call Spread.
Example:
Sell 19,800 Put, Buy 19,600 Put.
Sell 20,200 Call, Buy 20,400 Call.
Payoff: Profit if Nifty stays between 19,800–20,200.
Pros: Income from stable markets.
Cons: Risk if market breaks range.
5.8 Butterfly Spread (Range-Bound, Low Risk)
How it works: Buy 1 ITM Call, Sell 2 ATM Calls, Buy 1 OTM Call.
Example:
Buy 19,800 Call, Sell 2×20,000 Calls, Buy 20,200 Call.
Payoff: Max profit if expiry near middle strike (20,000).
Pros: Low risk, good for low-volatility outlook.
Cons: Limited reward, needs precise prediction.
5.9 Collar Strategy (Hedged Investment)
How it works: Own stock + Buy Put + Sell Call.
Purpose: Locks range of returns.
Example: Own stock at ₹1,000. Buy 950 Put, Sell 1,050 Call.
Pros: Protects downside at low cost.
Cons: Caps upside.
5.10 Calendar Spread (Time-based Play)
How it works: Sell near-term option + Buy long-term option of same strike.
Profit: From time decay of short option while holding longer-term exposure.
Best used: In low-volatility environments.
6. Risk-Reward Analysis
Limited Risk Strategies: Spreads, Condors, Butterflies.
Unlimited Profit Potential: Long Calls, Long Puts, Straddles.
Income-Oriented: Covered Calls, Iron Condor, Credit Spreads.
Hedging-Oriented: Protective Puts, Collars.
7. How to Choose the Right Strategy
Factors to consider:
Market View (Bullish, Bearish, Neutral).
Volatility Outlook (High, Low, Expected to rise/fall).
Risk Appetite (Aggressive vs Conservative).
Capital Availability (Some require margin).
8. Common Mistakes in Option Strategies
Over-leveraging (buying too many contracts).
Ignoring time decay (theta).
Trading only naked options without strategy.
Not adjusting positions when market moves.
Misjudging volatility.
9. Advanced Insights
Option Greeks: Delta, Gamma, Theta, Vega, Rho – help measure sensitivity to price, time, and volatility.
Implied Volatility (IV): Crucial in pricing; high IV inflates premiums, low IV reduces them.
Adjustments: Rolling options, converting spreads to condors, hedging with futures.
10. Conclusion
Options trading strategies are powerful tools. They allow traders to make money in bullish, bearish, sideways, or volatile markets – but only if used with discipline. A successful trader doesn’t just guess direction; they analyze market conditions, volatility, risk tolerance, and then select the appropriate strategy.
The beauty of options lies in flexibility: you can limit risk, enhance returns, or even profit from time and volatility itself. But the danger lies in misuse – options should be treated as structured financial instruments, not lottery tickets.

Futures Trading ExplainedIntroduction
Futures trading is one of the most powerful financial instruments in the world of investing and trading. Unlike traditional stock buying where you own a piece of a company, futures are derivative contracts that allow you to speculate on the price movement of commodities, currencies, indices, and financial assets without owning them directly.
The futures market plays a crucial role in global finance by providing price discovery, risk management (hedging), and speculative opportunities. From farmers locking in prices for crops to institutional traders speculating on crude oil, futures are everywhere in the financial ecosystem.
In this guide, we’ll explore futures trading in detail, covering everything from the basics to advanced strategies, with real-world examples.
1. What are Futures?
A futures contract is a legally binding agreement to buy or sell an underlying asset at a predetermined price at a specific time in the future.
Key points:
Underlying asset: The thing being traded (wheat, crude oil, gold, stock index, currency, etc.).
Standardized contract: The size, quality, and delivery date are pre-defined by the exchange.
Leverage: Traders can control large positions with small capital (margin).
Cash-settled or physical delivery: Some futures end with cash settlement, others with delivery of the actual asset.
For example:
A wheat farmer agrees to sell 1000 bushels of wheat at $7 per bushel for delivery in 3 months. The buyer agrees to purchase it. Regardless of where the price goes, both are bound to the contract terms.
2. History and Evolution of Futures
Futures are not new – they date back centuries.
Japan (1700s): The Dojima Rice Exchange in Osaka is considered the birthplace of futures. Rice merchants used contracts to stabilize income.
Chicago Board of Trade (1848): Modern futures trading started in the U.S. with grain contracts.
20th Century: Expansion into metals, livestock, and energy.
Late 20th to 21st Century: Financial futures (currencies, indices, interest rates) became dominant.
Today, futures are traded worldwide on major exchanges like CME (Chicago Mercantile Exchange), ICE (Intercontinental Exchange), and NSE (National Stock Exchange of India).
3. Futures vs. Other Instruments
To understand futures better, let’s compare them with other markets:
Futures vs. Stocks
Stocks = Ownership of a company.
Futures = Contract to trade an asset, no ownership.
Stocks are unleveraged by default; futures use leverage.
Futures vs. Options
Options = Right but not obligation.
Futures = Obligation for both buyer and seller.
Options limit risk (premium paid); futures have unlimited risk.
Futures vs. Forwards
Forwards = Customized, private contracts (OTC).
Futures = Standardized, exchange-traded, regulated.
4. How Futures Trading Works
Let’s break down the mechanics:
a) Contract Specifications
Every futures contract specifies:
Underlying asset (Gold, Nifty index, Crude oil, etc.)
Contract size (e.g., 100 barrels of oil)
Expiration date (e.g., March 2025 contract)
Tick size (minimum price movement)
Settlement type (cash/physical)
b) Margin and Leverage
Traders don’t pay full value; they post margin (a percentage, usually 5–15%).
Example: 1 crude oil futures contract = 100 barrels. If price = $80, contract value = $8,000. Margin required may be $800. You control $8,000 with just $800.
c) Mark-to-Market (MTM)
Futures are settled daily. Profits and losses are adjusted every day.
If your trade is in profit, money is credited; if in loss, debited.
d) Long and Short Positions
Long = Buy (expecting price rise).
Short = Sell (expecting price fall).
Unlike stocks, short selling in futures is easy because contracts don’t require ownership of the asset.
5. Participants in Futures Market
The market brings together different players:
Hedgers – Reduce risk.
Example: A farmer sells wheat futures to lock in price; an airline buys crude oil futures to hedge fuel cost.
Speculators – Profit from price movements.
Traders, investors, hedge funds.
They provide liquidity but assume higher risk.
Arbitrageurs – Exploit price differences.
Example: Buy in spot market and sell futures if mispricing exists.
6. Types of Futures Contracts
Futures are available across asset classes:
a) Commodity Futures
Agricultural: Wheat, corn, soybeans, coffee.
Energy: Crude oil, natural gas.
Metals: Gold, silver, copper.
b) Financial Futures
Index futures (Nifty, S&P 500).
Currency futures (USD/INR, EUR/USD).
Interest rate futures (10-year bond yields).
c) Other Emerging Futures
Volatility index futures (VIX).
Crypto futures (Bitcoin, Ethereum).
7. Futures Trading Strategies
Futures are flexible and allow many trading approaches:
a) Directional Trading
Going long if expecting price rise.
Going short if expecting price fall.
b) Hedging
Farmers hedge crop prices.
Exporters/importers hedge currency fluctuations.
Investors hedge stock portfolios with index futures.
c) Spread Trading
Buy one contract, sell another.
Example: Buy December crude oil futures, sell March crude oil futures (calendar spread).
d) Arbitrage
Exploiting mispricing between spot and futures.
Example: If Gold futures are overpriced compared to spot, arbitrageurs sell futures and buy spot.
e) Advanced Strategies
Pairs trading: Trade correlated futures.
Hedged positions: Combining futures with options.
8. Advantages of Futures Trading
High Leverage: Amplifies potential returns.
Liquidity: Major futures markets have deep liquidity.
Transparency: Regulated by exchanges.
Flexibility: Can trade both rising and falling markets.
Hedging tool: Reduces risk exposure.
9. Risks in Futures Trading
While powerful, futures are risky:
Leverage risk: Losses are amplified just like profits.
Volatility risk: Futures can swing widely.
Margin calls: If losses exceed margin, traders must add funds.
Liquidity risk: Some contracts may have low volume.
Unlimited losses: Unlike options, risk is not capped.
Example: If you short crude oil at $80 and it rises to $120, your losses are massive.
10. Practical Example of Futures Trade
Imagine you believe gold prices will rise.
Gold futures contract size: 100 grams.
Current price: ₹60,000 per 10 grams → Contract value = ₹600,000.
Margin requirement: 10% = ₹60,000.
You buy one contract at ₹60,000.
If gold rises to ₹61,000 → Profit = ₹1,000 × 10 = ₹10,000.
If gold falls to ₹59,000 → Loss = ₹10,000.
A small move in price leads to large gains or losses due to leverage.
Conclusion
Futures trading is a double-edged sword – a tool of immense power for hedging and speculation, but equally capable of wiping out capital if misused. Traders must understand contract mechanics, manage leverage wisely, and apply strict risk management.
For professionals and disciplined traders, futures offer unparalleled opportunities. For careless traders, they can be disastrous.
The bottom line:
Learn the basics thoroughly.
Start small with proper risk controls.
Treat futures trading as a skill to master, not a gamble.
If used smartly, futures trading can become a gateway to financial growth and protection against market uncertainty.
Risk Smart, Grow Fast (Small Account Trading)Introduction
Most traders dream of becoming full-time, financially free traders. But there’s a common challenge: many start with small accounts. When you have a small account, every dollar matters, and one bad trade can wipe out weeks or months of progress. At the same time, you want to grow your account quickly.
This creates a tough balance: How do you grow fast without blowing up your account?
The answer lies in being risk smart. Trading is not about taking the biggest bets; it’s about protecting your capital while allowing your money to grow steadily. The smaller the account, the more discipline and precision you need.
In this guide, we’ll explore everything you need to know about small account trading, from psychology and risk management to strategies, tools, and growth plans.
Chapter 1: The Psychology of a Small Account
Trading a small account is more mental than technical. Let’s face it:
A $100 profit may look tiny compared to the big players making thousands per day.
Losses feel heavier because you have less cushion.
Impatience is stronger—you want to grow fast.
Here are some psychological traps:
Overtrading: You feel like you must take every trade to “make it big.”
Revenge Trading: After a loss, you double down to recover quickly.
Comparing with others: Seeing other traders’ big profits makes you greedy.
Fear of missing out (FOMO): You jump into trades without analysis because you don’t want to “miss the move.”
👉 The key mindset: Small gains compound into big growth. If you focus on risk management and consistency, your account will grow—not overnight, but steadily.
Chapter 2: Why Small Accounts Blow Up
Let’s talk honestly. Most small accounts don’t survive because traders break these rules:
Too much risk per trade (risking 20–50% of the account).
No stop-loss, leading to one trade wiping everything out.
Chasing unrealistic returns, expecting to double the account in a week.
Ignoring fees & commissions (especially in options or futures).
Trading without a plan—just reacting to charts.
For a small account, survival is victory. If you survive, you get time to grow. If you blow up, game over.
Chapter 3: The Risk Smart Formula
When you trade small accounts, risk is your shield. Here’s a simple formula:
Risk 1–2% of your account per trade.
Example: On a $500 account, risk only $5–$10 per trade.
That way, 10 losing trades in a row won’t kill your account.
Use stop-loss orders always.
Decide your maximum loss before entering.
Don’t move stops because of “hope.”
Focus on high-probability setups.
Don’t trade every move. Trade only when risk/reward is clear (at least 1:2 or 1:3).
Position sizing is everything.
If your stop-loss is $0.50 and you can risk $10, buy only 20 shares.
Adjust size to protect capital.
This is how small traders survive long enough to grow.
Chapter 4: The Power of Compounding
Small gains look boring—but they multiply.
Example:
If you make just 2% per week, on a $1,000 account, that’s $20/week.
In one year, it grows to $2,700+.
In five years, it becomes $30,000+.
This is the hidden power of being risk smart. While others blow up accounts chasing 100% returns, you quietly build wealth.
Chapter 5: Strategies for Small Accounts
Now, let’s look at practical strategies you can use.
1. Scalping & Day Trading
Take small, quick profits (0.5%–2% per trade).
Works well because small accounts can’t handle long drawdowns.
Best in liquid stocks or indices (Nifty, Bank Nifty, SPY, AAPL, etc.).
2. Swing Trading
Hold trades for a few days to weeks.
Good if you can’t sit in front of screens all day.
Focus on strong trends and tight risk.
3. Options Trading (Careful!)
Options allow leverage, which is good for small accounts.
But they’re risky if you don’t manage size.
Use defined-risk strategies like debit spreads or buying calls/puts with small capital.
4. Futures / Micro Contracts
Some markets offer micro futures (like Micro E-mini S&P).
They let small accounts trade big markets with low risk.
5. Focus on One Setup
Small account traders shouldn’t try 10 strategies.
Pick one high-probability pattern (breakouts, pullbacks, VWAP bounces, etc.).
Master it.
Chapter 6: The Growth Blueprint
Here’s a step-by-step growth plan for a $500–$2,000 account.
Stage 1: Survival (First 3–6 months)
Goal: Don’t blow up.
Focus on risk control and discipline.
Take small positions, learn patterns, and build consistency.
Stage 2: Consistency (6–12 months)
Goal: Be profitable monthly.
Focus on taking only A+ setups.
Increase position size slowly.
Stage 3: Scaling (1–3 years)
Goal: Grow account steadily.
Reinvest profits back.
Gradually add more size once consistent.
Stage 4: Freedom (3+ years)
Goal: Trade for living.
Now the account is large enough to provide income.
Chapter 7: Tools Every Small Account Trader Needs
Broker with low commissions: Fees eat small accounts alive.
Charting platform: TradingView, ThinkOrSwim, Zerodha Kite.
Stop-loss automation: Never rely on “mental stops.”
Journal: Track every trade (why you entered, risk, result).
Risk calculator: Helps decide position size.
Chapter 8: Risk Smart Habits
Always pre-plan trades (entry, stop, target).
Avoid over-leverage.
Respect stop-loss like a religion.
Don’t trade to “make money fast.” Trade to protect capital.
Review weekly: Look at what worked, what didn’t.
Chapter 9: Case Studies
Trader A: Greedy Approach
Account: $1,000
Risk per trade: $200 (20%).
Lost 3 trades in a row → account down to $400.
Tried revenge trading → account blown in 1 month.
Trader B: Risk Smart
Account: $1,000
Risk per trade: $10 (1%).
Trades 50 times in 3 months.
Wins 30 trades with 1:2 risk/reward.
End result: $1,300 account (30% growth).
Still alive, compounding.
👉 Which trader has a future? Clearly, Trader B.
Chapter 10: How to Grow Fast Without Blowing Up
Here’s the balance you’re looking for:
Trade high-probability setups only.
Add leverage carefully. Start small, increase size only when consistent.
Withdraw profits rarely. Reinvest to compound faster.
Diversify income streams. Don’t rely only on one style (maybe mix swing & options).
Conclusion
Small account trading is tough—but not impossible.
The secret is to be risk smart: protect your capital, take small but consistent gains, and avoid greed. By doing this, you’ll build discipline, confidence, and a growing account.
The formula is simple:
Risk small.
Stay consistent.
Compound gains.
Grow fast—but safely.
Remember: You don’t have to trade big to trade smart. But if you trade smart, one day you’ll trade big.

Trading Master Class With ExpertsTips for Beginners in Options Trading
Start with buying calls/puts before selling.
Trade liquid instruments like Nifty/Bank Nifty.
Learn Greeks slowly, don’t jump into complex strategies.
Avoid naked option selling without hedging.
Paper trade before risking real capital.
Role of Volatility in Options
Volatility is the lifeblood of options.
High Volatility = Expensive Premiums.
Low Volatility = Cheap Premiums.
Traders often use Implied Volatility (IV) to decide whether to buy (when IV is low) or sell (when IV is high).
Mastering Options
Options are like a Swiss Army Knife of trading—one tool with multiple uses: speculation, hedging, and income generation. But with great power comes great responsibility.
To succeed in options trading:
Understand the basics thoroughly.
Start small and simple.
Master risk management.
Use strategies suited to your market outlook.
Keep emotions under control.
With practice and discipline, options can become a game-changer in your trading journey.

Part 6 Learn Institutional TradingOptions in Indian Markets
In India, options are traded on NSE and BSE, primarily on:
Index Options: Nifty, Bank Nifty (most liquid).
Stock Options: Reliance, TCS, Infosys, etc.
Weekly Expiry: Every Thursday (Nifty/Bank Nifty).
Lot Sizes: Fixed by exchanges (e.g., Nifty = 50 units).
Practical Example – Nifty Options Trade
Scenario:
Nifty at 20,000.
You expect big movement after RBI policy.
Strategy: Buy straddle (20,000 call + 20,000 put).
Cost = ₹200 (call) + ₹180 (put) = ₹380 × 50 = ₹19,000.
If Nifty moves to 20,800 → Call worth ₹800, Put worthless. Profit = ₹21,000.
If Nifty stays at 20,000 → Both expire worthless. Loss = ₹19,000.
Option Trading Psychology
Patience: Many options expire worthless, don’t chase every trade.
Discipline: Stick to stop-loss and position sizing.
Avoid Greed: Sellers earn small consistent income but risk blow-up if careless.
Stay Informed: News, earnings, and events impact volatility.

Part 2 Ride The Big Moves Why Trade Options? (Advantages)
Leverage: Small capital controls big positions.
Hedging: Protect stock portfolio from losses.
Flexibility: Profit in bullish, bearish, or sideways markets.
Income: Selling options generates consistent premiums.
Risk Control: Losses can be predefined by structuring trades.
Risks of Options Trading
Time Decay (Theta): Options lose value as expiration approaches.
Liquidity Risk: Not all options are actively traded.
Complexity: Strategies can be difficult for beginners.
Unlimited Risk (for sellers): Selling naked calls can wipe out capital.
Over-leverage: Small margin requirements may encourage oversized positions.

Global Events & Market ImpactIntroduction
Financial markets are like living organisms—sensitive, reactive, and constantly adapting to external influences. While company fundamentals, earnings, and investor psychology play a large role in stock price movements, global events often serve as the real catalysts for dramatic market swings.
A political decision in Washington, a sudden military conflict in the Middle East, a central bank announcement in Europe, or even a natural disaster in Asia can ripple across global financial markets within minutes. In today’s hyper-connected economy, where capital flows across borders instantly and news spreads in real time, no country or investor is fully insulated from worldwide developments.
This article explores in detail how different global events—ranging from geopolitical tensions, pandemics, and trade wars to central bank policies, technological revolutions, and climate change—affect financial markets. We’ll also study both short-term volatility and long-term structural shifts that such events trigger.
1. The Nature of Market Sensitivity to Global Events
Markets are essentially forward-looking. They do not simply react to present conditions but rather try to price in future risks and opportunities. This is why even rumors of a war, speculation about interest rate changes, or forecasts of a hurricane can cause markets to swing before the actual event occurs.
Three key characteristics define market responses to global events:
Speed – In the era of high-frequency trading and global media, reactions can happen within seconds.
Magnitude – The scale of reaction depends on how “systemic” the event is (for example, the 2008 financial crisis vs. a localized earthquake).
Duration – Some events cause short-term panic but markets recover quickly; others reshape the global economy for decades.
2. Categories of Global Events Affecting Markets
Global events can be broadly classified into several categories, each with distinct market impacts:
Geopolitical Events – wars, terrorism, political instability, sanctions, and diplomatic conflicts.
Economic Policies & Central Bank Decisions – interest rate changes, fiscal stimulus, tax reforms.
Global Trade & Supply Chain Disruptions – tariffs, trade wars, port blockages, shipping crises.
Natural Disasters & Climate Change – hurricanes, floods, wildfires, long-term climate risks.
Health Crises & Pandemics – global spread of diseases like COVID-19, SARS, Ebola.
Technological Disruptions – breakthroughs in AI, energy, and digital finance.
Commodity Shocks – sudden movements in oil, gold, or food prices.
Financial Crises & Systemic Shocks – banking collapses, currency devaluations, debt crises.
Let’s examine each in detail.
3. Geopolitical Events
Wars and Conflicts
Wars often cause energy and commodity prices to spike, especially when they involve major producers.
Example: The Russia-Ukraine war (2022) sent oil, gas, and wheat prices soaring, creating inflationary pressures worldwide.
Defense stocks usually rally, while riskier assets like emerging markets decline.
Political Instability
Elections, regime changes, and coups often create uncertainty.
Example: Brexit (2016) caused volatility in the pound sterling, reshaped European equity flows, and influenced global trade policy.
Terrorism
Major attacks (e.g., 9/11) often trigger immediate sell-offs in equity markets, with a flight to safe-haven assets like gold and US Treasury bonds.
4. Economic Policies & Central Banks
Interest Rate Decisions
Central banks like the US Federal Reserve, European Central Bank (ECB), and RBI (India) are powerful drivers of markets.
When rates rise, borrowing becomes expensive, which usually depresses stock markets but strengthens the currency.
Conversely, rate cuts often boost equities but weaken currencies.
Quantitative Easing (QE)
During crises (2008, COVID-19), central banks injected liquidity into markets, which drove asset prices upward.
Fiscal Stimulus & Taxation
Government spending plans, subsidies, or corporate tax cuts influence corporate earnings expectations and therefore stock valuations.
5. Global Trade & Supply Chains
Trade Wars
Example: The US-China trade war (2018–2019) disrupted global technology and manufacturing supply chains, causing volatility in stock markets and commodity markets.
Supply Chain Disruptions
COVID lockdowns in China created shortages in semiconductors and other goods, which impacted global auto and electronics industries.
Shipping & Logistics
Events like the Suez Canal blockage (2021) caused billions in losses and exposed how dependent markets are on smooth global logistics.
6. Natural Disasters & Climate Change
Natural Disasters
Hurricanes, tsunamis, or earthquakes often create localized stock market declines.
Example: The 2011 Japan earthquake & Fukushima nuclear disaster had global impacts on energy and auto supply chains.
Climate Change
Increasingly, investors are pricing climate risk into valuations.
Companies in fossil fuel industries face long-term risks, while renewable energy firms attract capital.
ESG (Environmental, Social, Governance) investing has emerged as a global trend.
7. Health Crises & Pandemics
COVID-19 (2020–2022)
One of the most impactful global events in modern history.
Stock markets initially crashed in March 2020 but rebounded sharply due to massive fiscal and monetary support.
Certain sectors like airlines, hotels, and oil were devastated, while tech and healthcare boomed.
Past Examples
SARS (2003) hit Asian markets temporarily.
Ebola (2014) affected African economies but had limited global effect compared to COVID.
8. Technological Disruptions
Innovations Driving Markets
The dot-com bubble (1999–2000) showed how technology hype can inflate markets.
More recently, AI and EV (Electric Vehicles) have created massive rallies in companies like Nvidia and Tesla.
Risks from Technology
Cyberattacks on financial institutions or major corporations can cause sudden market dips.
Example: Ransomware attacks or hacking of exchanges.
9. Commodity Shocks
Oil Price Volatility
Oil remains one of the most geopolitically sensitive commodities.
Example: The 1973 oil crisis caused stagflation globally.
In 2020, oil futures briefly turned negative due to demand collapse.
Gold as a Safe Haven
During uncertainty, gold prices usually rise.
Investors view it as a hedge against inflation, currency depreciation, and geopolitical risks.
Food Commodities
Droughts or export bans (e.g., India restricting rice exports) can push global food inflation higher.
10. Financial Crises & Systemic Shocks
Global Financial Crisis (2008)
Triggered by the collapse of Lehman Brothers, this event led to the worst global recession since the Great Depression.
Stock markets fell over 50%, but also created long-term changes in regulation and central bank behavior.
Asian Financial Crisis (1997)
Currency devaluations in Thailand, Indonesia, and South Korea triggered capital flight and market crashes.
European Debt Crisis (2010–2012)
Greece’s sovereign debt problems shook confidence in the Eurozone and created long-term structural reforms.
Conclusion
Global events are unavoidable in financial markets. While some are unpredictable “black swan” shocks, others evolve slowly, giving investors time to adjust. Understanding how markets react to wars, pandemics, central bank decisions, and technological disruptions can help investors navigate uncertainty more effectively.
In the short term, markets may appear chaotic. But history shows that crises often accelerate long-term transformations in economies and industries. The winners are those who maintain discipline, manage risk, and adapt strategies as global dynamics shift.

Part 2 Trading MasterclassOption Trading vs Stock Trading
Stocks = Ownership, long-term growth, dividends.
Options = Contracts, leverage, flexible strategies.
Stocks = Simpler, but capital-intensive.
Options = Complex, but require less capital and offer hedging.
For example:
Buying 100 shares of Reliance at ₹2500 = ₹2,50,000.
Buying 1 call option of Reliance at ₹100 premium with lot size 250 = only ₹25,000.
This leverage makes options attractive—but also riskier.
Real-Life Examples & Case Studies
Case 1: Bull Market
A trader buys Nifty 20000 Call at ₹200 premium. Nifty rallies to 20500. Profit = ₹300 (500 – 200). Huge return on a small premium.
Case 2: Bear Market
Investor holds TCS shares but fears a fall. Buys a protective put. When stock drops, put increases in value, reducing losses.
Case 3: Neutral Market
Trader sells an Iron Condor on Bank Nifty, betting price will stay range-bound. Premium collected = profit if market stays sideways.

Divergence SecretsRisks & Rewards in Option Trading
Option trading can be thrilling, but it’s not without risks.
For Buyers:
Maximum loss = premium paid.
Maximum profit = potentially unlimited (for calls) or huge (for puts).
For Sellers:
Maximum gain = premium received.
Maximum loss = unlimited (for calls) or very large (for puts).
Risks also come from:
Time decay (options lose value daily).
Volatility crush (sudden drop in implied volatility can reduce premiums).
Liquidity issues (wide bid-ask spreads can hurt execution).
That’s why risk management (stop-losses, proper sizing, hedging) is crucial.
Option Trading vs Stock Trading
Stocks = Ownership, long-term growth, dividends.
Options = Contracts, leverage, flexible strategies.
Stocks = Simpler, but capital-intensive.
Options = Complex, but require less capital and offer hedging.
For example:
Buying 100 shares of Reliance at ₹2500 = ₹2,50,000.
Buying 1 call option of Reliance at ₹100 premium with lot size 250 = only ₹25,000.
This leverage makes options attractive—but also riskier.

Option Trading Option Pricing & The Greeks
Options are not priced randomly. Their value comes from several factors:
Intrinsic Value: The real, tangible value (difference between stock price and strike).
Time Value: Extra premium paid for the possibility of future movement.
Volatility: The higher the uncertainty, the higher the option premium.
Option Greeks – the essential toolkit:
Delta – Measures how much an option’s price changes with a change in stock price. (Think: sensitivity to price).
Gamma – Measures how much Delta itself changes.
Theta – Time decay. Shows how much an option loses value each day as expiration approaches.
Vega – Sensitivity to volatility. Higher volatility = higher option price.
Rho – Sensitivity to interest rates (less relevant for short-term traders).
Understanding Greeks is like knowing the gears of a car—they help control risk.
Option Trading Strategies
Here’s where things get exciting. Options are like Lego blocks—you can combine them in different ways to create powerful strategies.
A. Basic Strategies
Buying Calls – Bullish bet.
Buying Puts – Bearish bet.
Covered Call – Holding a stock and selling calls to earn income.
Protective Put – Owning stock and buying puts to insure against loss.
B. Intermediate Strategies
Straddle – Buy a call + put at same strike, betting on big movement (either direction).
Strangle – Similar to straddle but different strikes, cheaper.
Bull Call Spread – Buy one call, sell a higher strike call. Profits capped but cheaper.
Bear Put Spread – Buy a put, sell lower strike put.
C. Advanced Strategies
Iron Condor – Selling an OTM call spread + OTM put spread, betting on low volatility.
Butterfly Spread – Combining multiple options to profit if stock stays near a target price.
Calendar Spread – Exploiting time decay by selling short-term and buying long-term options.
Each strategy has a risk-reward profile and works best in specific market conditions.

PCR Trading StrategyHow Options Work
Let’s break it down simply:
If you buy a call, you are betting that the price of the stock will go up.
If you buy a put, you are betting that the price of the stock will go down.
If you sell (write) a call, you are taking the opposite bet—that the stock won’t rise much.
If you sell (write) a put, you are betting that the stock won’t fall much.
Here’s a quick example:
Stock XYZ trades at ₹100.
You buy a 1-month call option with a strike price of ₹105 by paying a ₹5 premium.
If the stock rises to ₹120, your option is worth ₹15 (120 – 105). Since you paid ₹5, your profit = ₹10.
If the stock stays below ₹105, the option expires worthless, and you lose your premium of ₹5.
This example shows that options can magnify profits if you’re right, but they can also cause losses (limited to the premium paid for buyers, unlimited for sellers).
Types of Options
A. Call Options
Right to buy.
Used when you expect prices to rise.
Buyers have limited risk (premium) but unlimited upside.
Sellers (writers) have limited gain (premium received) but unlimited risk.
B. Put Options
Right to sell.
Used when you expect prices to fall.
Buyers have limited risk but big upside if stock falls sharply.
Sellers have limited gain (premium) but large risk if stock collapses.

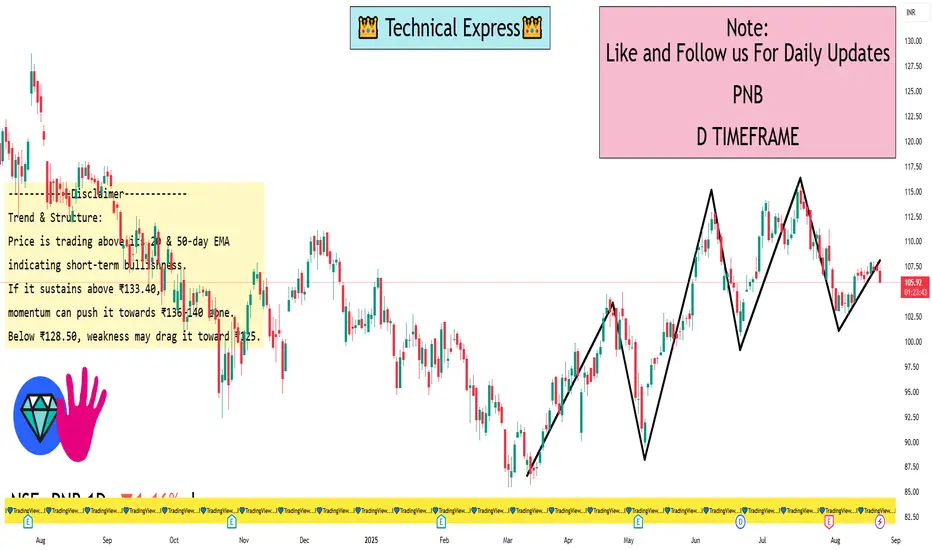
PNB 1 Day ViewSupport Levels:
₹128.50 – Immediate support (recent swing low)
₹125.20 – Strong demand zone
₹121.80 – Major support
Resistance Levels:
₹133.40 – Immediate hurdle
₹136.20 – Strong resistance (recent high area)
₹140.00 – Psychological & breakout level
📈 Trend & Structure:
Price is trading above its 20 & 50-day EMA, indicating short-term bullishness.
If it sustains above ₹133.40, momentum can push it towards ₹136–140 zone.
Below ₹128.50, weakness may drag it toward ₹125.
EIEL 1 Day ViewPrice Action Snapshot (22 Aug 2025)
According to Moneycontrol, the current day’s trading range for EIEL is ₹260.95 – ₹274.00.
Investing.com data confirms a real-time price of ₹268.30, with the same daily range and a 52-week range of ₹182.00–₹391.60.
Economic Times reports a 1-day return of +3.3%, with the current price around ₹268.05–₹268.30.
Technical Signals
TradingView labels the 1-day technical rating for EIEL as Neutral, based on a combination of oscillators and moving averages.
Investing.com India provides a more bullish interpretation:
RSI (14-day): ~69.38 — indicating a "Buy" zone.
MACD: 3.060 — a bullish signal.
All moving averages (5-, 50-, 200-day) are suggesting "Buy".
Overall, the daily technical outlook is “Strong Buy”.
What Does "L 1 Day Time Frame Level" Mean?
You might be exploring the technical level or sentiment over a 1-day timeframe for EIEL. From the data:
TradingView summarizes the technical indicators as Neutral.

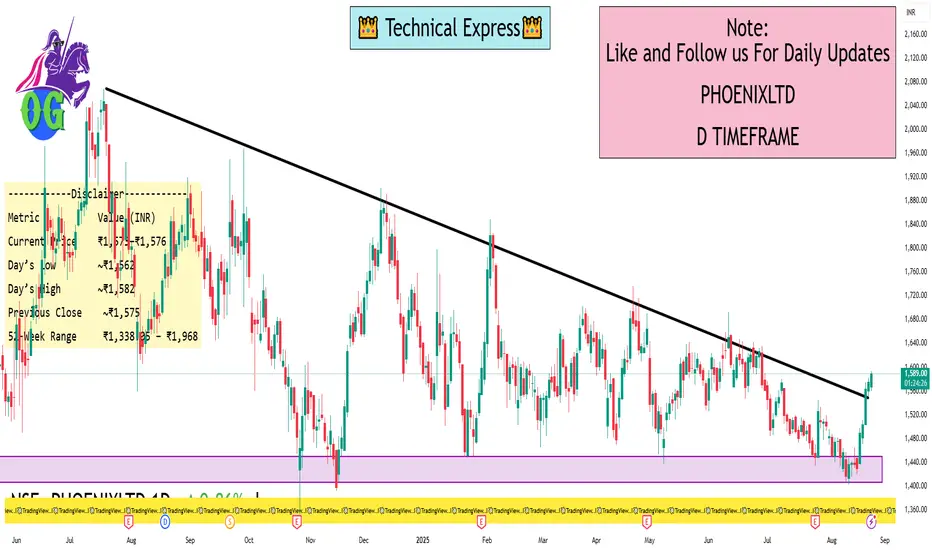
Phoenix 1 Day ViewHere’s a summary of the latest intraday data:
Current price: Approximately ₹1,573.00–₹1,576.00
Daily range: Between ₹1,562.00 (low) and ₹1,582.50 (high)
Previous closing price: Around ₹1,575.50
52-week range: ₹1,338.05 — ₹1,968.00
Specifically:
TradingView reports a current price of ₹1,575.50, showing a gain of ~0.76% in the last 24 hours. Day’s range is consistent with ₹1,562.00–₹1,582.50
Screener shows the price at ₹1,573 as of 10:44 a.m. IST today
Investing.com indicates the stock is trading at ₹1,575.50, with day’s range and 52-week range matching other sources
Financial Times Markets Data confirms intraday trading between ₹1,560.40 and ₹1,582.50, with previous close at₹1,575.00
Suggested Next Steps
Charting Platforms – Sites like TradingView, Investing.com, or Moneycontrol offer real-time intraday charts. These let you analyze key levels such as open, high, low, VWAP, and volume trends.
Technical Indicators – To identify support and resistance, you might want to apply indicators like moving averages (e.g., 20/50 EMA), RSI, or VWAP.
Alerts and Watchlists – Set price alerts around critical levels (e.g., ₹1,562 or ₹1,582) to stay informed of key moves.
Volume Analysis – Intraday volume can confirm the strength behind any move—higher volume on breakouts or dips is particularly telling.
Difference Between Investing and TradingIntroduction
In the world of finance, two of the most common approaches people take to grow their wealth are investing and trading. At first glance, these two activities may look similar—both involve putting money into financial instruments like stocks, bonds, mutual funds, or derivatives with the aim of making a profit. However, when we look deeper, the philosophies, time horizons, risk appetites, strategies, and outcomes of investing and trading are very different.
To put it simply:
Investing is about building wealth steadily over time, often with a long-term horizon.
Trading is about taking advantage of short-term opportunities in the market to generate quick returns.
Understanding the difference is essential because choosing the wrong path for your personality, goals, and risk tolerance can not only hurt your financial performance but also cause emotional stress.
This essay will take you through a detailed journey into what investing and trading mean, their similarities, differences, strategies, risks, psychology, and real-world examples, so you can decide which path (or combination) best suits you.
What is Investing?
Investing is the act of committing money for the long term with the expectation of receiving returns in the future. Investors typically focus on assets that are expected to grow steadily over years or decades, such as:
Stocks (Equities) – Shares in companies that appreciate over time and may pay dividends.
Bonds – Fixed-income securities that provide interest.
Mutual Funds/ETFs – Diversified portfolios managed by professionals.
Real Estate – Property investments that generate rental income and appreciate.
Commodities & Precious Metals – Gold, silver, etc., often used as hedges.
The core philosophy of investing is wealth accumulation through compounding. Albert Einstein famously called compounding the "eighth wonder of the world," and investors rely on this principle.
For example:
If you invest ₹1,00,000 at a 12% annual return (average Indian equity market return), in 20 years it grows to over ₹9,64,000. That’s the power of compounding without needing to buy and sell constantly.
Types of Investing
Value Investing – Buying undervalued stocks (e.g., Warren Buffett).
Growth Investing – Focusing on high-growth companies (e.g., tech firms).
Dividend Investing – Choosing companies with steady dividend payouts.
Index/Passive Investing – Investing in index funds for market-average returns.
Mindset of an Investor
Patient, long-term focused.
More concerned with company fundamentals than short-term price moves.
Sees market downturns as opportunities.
“Buy and hold” is the mantra.
What is Trading?
Trading is the act of buying and selling financial instruments within shorter timeframes to capture profits from market fluctuations. Unlike investing, traders don’t usually care about the long-term potential of an asset; they focus on short-term movements driven by demand-supply, news, or technical patterns.
Common Trading Styles
Scalping – Holding positions for seconds to minutes.
Day Trading – Buying and selling within a single trading day.
Swing Trading – Holding for days or weeks to capture medium-term trends.
Position Trading – Holding for weeks to months (a mix between trading and investing).
Tools Traders Use
Technical Analysis: Chart patterns, indicators (RSI, MACD, Bollinger Bands).
Volume Analysis: Understanding buying/selling pressure.
News & Events: Earnings announcements, Fed decisions, global crises.
Risk Management: Stop-loss, position sizing, leverage control.
Mindset of a Trader
Short-term profit focused.
Quick decision-making and adaptability.
High tolerance for risk and volatility.
Needs discipline and emotional control.
Strategies in Investing vs Trading
Investing Strategies
Buy and Hold – Holding quality stocks for decades.
SIP (Systematic Investment Plan) – Regular investments in mutual funds.
Portfolio Diversification – Reducing risk by spreading across assets.
Rebalancing – Adjusting portfolio periodically.
Trading Strategies
Momentum Trading – Riding strong trends.
Breakout Trading – Entering when price breaks support/resistance.
Mean Reversion – Betting price will revert to its average.
Options Strategies – Using derivatives like straddles, spreads, iron condors.
Risks in Investing vs Trading
Investing Risks
Market crashes (e.g., 2008, 2020).
Inflation risk eroding returns.
Poor stock selection (choosing weak companies).
Overconcentration in one asset.
Trading Risks
High volatility losses.
Leverage amplifying both gains and losses.
Overtrading and emotional decisions.
Sudden news shocks (war, government bans).
Key difference: Investors lose slowly, traders can lose instantly.
Psychology of Investing vs Trading
Investor Psychology: Requires patience, belief in long-term growth, ability to ignore short-term volatility. Successful investors avoid panic-selling.
Trader Psychology: Requires emotional discipline, quick thinking, sticking to risk limits, and accepting frequent small losses. Greed and fear are dangerous here.
Both require discipline, but in different ways.
Case Studies
Case Study 1: Investor Success
Warren Buffett invested in Coca-Cola in 1988.
Initial investment: $1.3 billion.
Today’s value: Over $25 billion plus billions in dividends.
Lesson: Patience and compounding create massive wealth.
Case Study 2: Trader Success
Paul Tudor Jones, a famous trader, predicted the 1987 crash.
He shorted the market and earned around $100 million in one day.
Lesson: Quick action, timing, and risk management can lead to big rewards.
Case Study 3: Investor Loss
Many who invested in companies like Enron or Yes Bank without research faced near-total losses.
Case Study 4: Trader Loss
Retail traders using high leverage during COVID crash wiped out accounts overnight.
Which is Better – Investing or Trading?
There’s no universal answer—it depends on your goals:
If you want steady long-term wealth → Choose Investing.
If you want active income and thrill → Choose Trading (but master risk control).
Many professionals do a mix: 80% long-term investing, 20% trading for extra income.
Conclusion
The difference between investing and trading lies in time horizon, mindset, risk tolerance, and strategy. Investing is like planting a tree and waiting for it to grow into a forest. Trading is like surfing waves—you ride them quickly, but must always be alert.
Both paths can be profitable, but both come with risks. The key is knowing yourself: Are you patient and disciplined for long-term gains, or energetic and risk-tolerant for short-term opportunities?
Ultimately, wealth creation often comes from investing, while trading can generate active cash flow if done with discipline. The wisest approach may be blending the two—secure your future with investments, and fuel your present with well-managed trading.
Risk Smart, Grow Fast: Survival Guide for Small Account TradersIntroduction
Trading is an arena that excites many with the promise of financial freedom, rapid wealth creation, and independence from traditional jobs. But the harsh truth is that most new traders lose money, especially those starting with small accounts. A small account brings its own set of challenges: limited capital, strict margin restrictions, emotional pressure, and the risk of blowing up quickly. Yet, history and countless success stories prove that small accounts can grow into big ones—if approached with discipline, risk management, and strategy.
This survival guide is written with one mission: to help small account traders trade smart, protect their capital, and accelerate growth without succumbing to the pitfalls that destroy most beginners.
Chapter 1: The Reality of Trading Small Accounts
Trading with a small account is different from trading with a large one. With limited funds, every decision matters. A small loss feels heavy, a bad trade can wipe out days or weeks of progress, and transaction costs hurt more.
Key challenges small account traders face:
Capital Constraint – With only ₹10,000–₹50,000 (or a few hundred dollars), position sizing becomes tricky. You cannot afford large drawdowns.
Emotional Pressure – Fear of losing and greed for doubling the account often drive impulsive trades.
Leverage Temptation – Brokers offer leverage, but small traders misuse it, leading to margin calls.
Risk of Ruin – One or two bad trades with no stop-loss can blow up the account completely.
Survival begins with accepting this reality: your first goal isn’t to make money fast—it’s to not lose money unnecessarily.
Chapter 2: The Mindset of a Survivor
Most traders fail not because of poor strategies, but because of poor psychology. Small account traders must adopt a “capital preservation” mindset before thinking about profits.
Think Like a Risk Manager – Ask: How much can I lose? before asking How much can I make?
Detach from Ego – Your account size doesn’t define your skill. Stay humble, focus on learning.
Play the Long Game – Compounding works wonders, but only if you survive long enough.
Embrace Boring Consistency – Avoid chasing thrill trades. Professional traders trade boring setups repeatedly.
Chapter 3: Risk Management is Your Lifeline
With a small account, risk management is the difference between survival and destruction.
1. The 1% Rule
Risk no more than 1–2% of your capital on a single trade.
Account: ₹25,000
1% Risk: ₹250
If your stop-loss is 5 points away, you can only take 50 shares.
This way, even after 10 losing trades, you lose only 10% of capital, not the whole account.
2. Stop-Loss is Non-Negotiable
Never enter a trade without a predefined stop-loss. Markets are unpredictable. Stop-loss is your insurance.
3. Position Sizing Formula
Position Size = (Account Risk × % Risk per Trade) ÷ Stop-Loss Distance
This ensures you don’t oversize.
4. Risk/Reward Ratio
Take trades only when reward is at least 2x the risk. Example: risking ₹500 to make ₹1,000.
5. Avoid Overtrading
Chapter 4: Strategies That Work for Small Accounts
Not all strategies are suitable for small traders. Complex multi-leg option spreads, long-term positional trades, or capital-heavy setups may be unfit. Instead, focus on high-probability, low-risk strategies.
1. Scalping with Discipline
Small, quick trades capturing 0.3–1% moves.
Works best in liquid instruments like Nifty, BankNifty, Reliance, HDFC Bank.
Needs strict stop-loss, otherwise one bad trade kills multiple small wins.
2. Breakout Trading
Enter when price breaks strong support/resistance.
High risk/reward if you wait for confirmed breakout with volume.
3. Intraday Option Buying
Cheap premiums, limited risk (premium paid), unlimited potential.
Works best with momentum days after news, events, or opening range breakouts.
4. Swing Trading
Holding positions for 2–10 days with stop-loss.
Helps small traders avoid intraday noise and transaction costs.
5. Volume Profile + Price Action
Identify where institutions are active.
Trade only when market structure supports your bias.
Avoid random entries.
Chapter 5: The Power of Compounding – From Small to Big
Growing a small account requires patience. Let’s see how small consistent returns compound:
₹25,000 with 5% monthly growth → ₹52,700 in 1 year → ₹1.11 lakh in 2 years → ₹2.36 lakh in 3 years.
Compounding turns modest returns into life-changing results.
The key: Protect the downside. Without survival, compounding is impossible.
Chapter 6: Tools & Tactics for Small Account Traders
Broker Selection – Choose brokers with low commissions, no hidden charges, and seamless platforms.
Charting Platforms – Use TradingView or equivalent for better analysis.
Journaling – Record every trade: entry, exit, stop-loss, reasoning. This builds discipline.
Avoid F&O Overexposure – Don’t jump into naked futures without experience.
Cash is Also a Position – Sometimes the best trade is no trade.
Chapter 7: Common Mistakes Small Traders Make
Over-leverage – Blowing up accounts by using margin excessively.
Revenge Trading – Doubling down after a loss to “recover fast.”
No Risk Plan – Trading without stop-loss or risk limits.
Following Tips Blindly – Copying Telegram/WhatsApp calls without analysis.
Impatience – Expecting to turn ₹10,000 into ₹1 lakh in 1 month.
Chapter 8: Building Discipline & Routine
Trading success isn’t about finding a “holy grail strategy.” It’s about developing habits.
Morning Preparation – Identify levels, mark support/resistance.
Defined Trading Hours – Trade only when market is active.
Post-Market Review – Log trades, analyze mistakes.
Mental Fitness – Meditation, walks, or journaling to control emotions.
Consistency in routine = Consistency in profits.
Chapter 9: Scaling Up – When to Increase Lot Size
Don’t rush. Scale gradually.
Rule: Increase position size only when account grows by 25–30%.
Example: If you start with ₹25,000, increase lot size only after reaching ₹32,500+.
Never double size overnight—it kills accounts.
Chapter 10: The Trader’s Code of Survival
To grow fast while being risk smart, every small account trader should follow this code:
Protect capital first, profits second.
Trade only setups with favorable risk/reward.
Never risk more than 1–2% per trade.
Keep emotions in check—stick to plan.
Journal trades, learn continuously.
Compound with patience, scale gradually.
Conclusion
Trading a small account is like sailing a fragile boat in stormy waters—you must be extra cautious, disciplined, and skillful to survive. Many traders fail because they chase fast riches, ignore risk management, and trade emotionally. But those who respect risk, stay patient, and stick to disciplined strategies can not only survive but thrive.
Remember: Your small account isn’t a limitation—it’s your training ground. Survive long enough, grow consistently, and one day, the small account you’re protecting today will be the large account that gives you freedom tomorrow.
Part 6 Institutional Trading When to Use Each Strategy
Bullish Market → Long Call, Bull Call Spread, Covered Call.
Bearish Market → Long Put, Bear Put Spread.
Sideways Market → Iron Condor, Butterfly, Covered Call.
High Volatility → Straddle, Strangle.
Low Volatility → Credit Spreads, Iron Condor.
Risk Management in Options
Options can be dangerous if used blindly. Key risk management rules:
Never sell naked options without hedge (unlimited risk).
Use position sizing – don’t risk more than 2–5% of capital in one trade.
Always track Greeks:
Delta (directional risk),
Theta (time decay),
Vega (volatility risk),
Gamma (rate of change).
Use stop-loss even in options.
