Part 2 Ride The Big MovesBasics of Options
Before jumping into strategies, let’s revisit some fundamentals:
Call Option: Gives the buyer the right to buy the asset at a specific strike price.
Put Option: Gives the buyer the right to sell the asset at a specific strike price.
Option Premium: The price paid to buy an option.
Strike Price: The price at which the underlying can be bought/sold.
Expiry Date: The last date the option can be exercised.
ITM (In-the-Money): Option has intrinsic value (profitable if exercised).
OTM (Out-of-the-Money): Option has no intrinsic value (not profitable if exercised).
ATM (At-the-Money): Strike price is very close to current market price.
💡 Quick Example:
Nifty is at 22,000. You buy a 22,000 Call Option for ₹200 premium. If Nifty rises to 22,500, your option has value (ITM). If Nifty stays flat or goes down, you may lose the premium.
Now, depending on whether you buy or sell Calls/Puts, you can build hundreds of strategies.
Why Traders Use Options
Options are powerful because they can serve three main purposes:
Hedging – Protecting an existing portfolio from adverse price moves.
Example: A long-term investor holding Infosys shares may buy a Put option to protect against a fall.
Speculation – Betting on market direction with limited capital.
Example: Buying a Call if you expect bullish momentum.
Income Generation – Selling options to collect premium regularly.
Example: Writing Covered Calls on stocks you own.
The same instrument (options) can be used very differently by traders with different goals. That’s why strategies matter.
HDFCBANK

Part 2 Candle Stick Pattern Introduction to Options Trading
In the world of financial markets, traders are always looking for ways to manage risk, generate income, or profit from price movements. Stocks, bonds, and futures are common instruments, but options trading adds a completely new layer of flexibility.
An option is a financial contract that gives the buyer the right, but not the obligation, to buy or sell an underlying asset at a specific price (called the strike price) on or before a certain date (called the expiry date).
Unlike stocks, which represent ownership in a company, options are derivative contracts—their value is derived from the movement of an underlying asset such as Nifty, Bank Nifty, Reliance Industries, Tesla, Gold, Crude Oil, etc.
The beauty of options is that they allow traders to benefit in bullish, bearish, or even sideways markets, depending on the strategy used. That’s why understanding option trading strategies is like learning the different moves in a chess game—you pick the right one for the right situation.
Basics of Options
Before jumping into strategies, let’s revisit some fundamentals:
Call Option: Gives the buyer the right to buy the asset at a specific strike price.
Put Option: Gives the buyer the right to sell the asset at a specific strike price.
Option Premium: The price paid to buy an option.
Strike Price: The price at which the underlying can be bought/sold.
Expiry Date: The last date the option can be exercised.
ITM (In-the-Money): Option has intrinsic value (profitable if exercised).
OTM (Out-of-the-Money): Option has no intrinsic value (not profitable if exercised).
ATM (At-the-Money): Strike price is very close to current market price.
💡 Quick Example:
Nifty is at 22,000. You buy a 22,000 Call Option for ₹200 premium. If Nifty rises to 22,500, your option has value (ITM). If Nifty stays flat or goes down, you may lose the premium.
Now, depending on whether you buy or sell Calls/Puts, you can build hundreds of strategies.

Bitcoin 1 Day view Support Levels:
$112,000 — a critical short-timeframe level; a sweep below this could trigger opportunities according to @CryptoMichNL.
$113,000–$114,000 — active support zone where traders are positioning, as noted by Greeks.Live.
$111,200–$112,700 — a daily + 4-hour Fair Value Gap (FVG) support area. Holding this region may prevent further downside.
Resistance Levels:
$115,000 — identified as a pressure zone by crypto observers; its breach could lead to renewed momentum.
$115,700–$116,100 — Fibonacci-style resistance tiers from Barchart’s pivot-point analysis.
What to Watch Next
If BTC holds above $112,700–$113,000: Could attract buyers looking for a bounce, possibly aiming toward $115K+.
If BTC breaks below $112K: Risk of deeper correction; next meaningful stop near $111K.
If BTC clears $115K: Likely opens the path toward the $115.7–$116.1 zone and beyond.

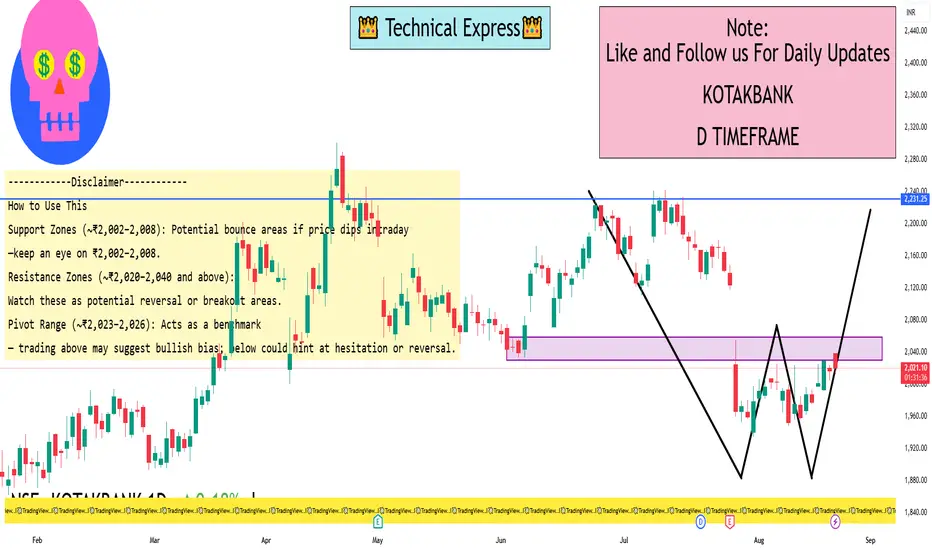
Kotak Bank 1 Day ViewImmediate Support 1: ₹1,815 – ₹1,820 (near short-term demand zone)
Support 2: ₹1,795 (important swing low base)
Support 3: ₹1,770 (major downside protection, if broken momentum can accelerate)
Immediate Resistance 1: ₹1,845 – ₹1,850 (near-term supply zone, multiple rejections)
Resistance 2: ₹1,870 (strong hurdle, breakout level)
Resistance 3: ₹1,895 – ₹1,900 (psychological round number + previous high)
Market Structure Insight
Price is consolidating in a tight range between ₹1,815 – ₹1,850 on the 1-hour chart.
A decisive breakout above ₹1,850 could trigger momentum toward ₹1,870–₹1,900.
A breakdown below ₹1,815 may open room toward ₹1,795–₹1,770.
Volume profile shows higher participation near ₹1,820–₹1,830, meaning it’s the key control zone to watch.
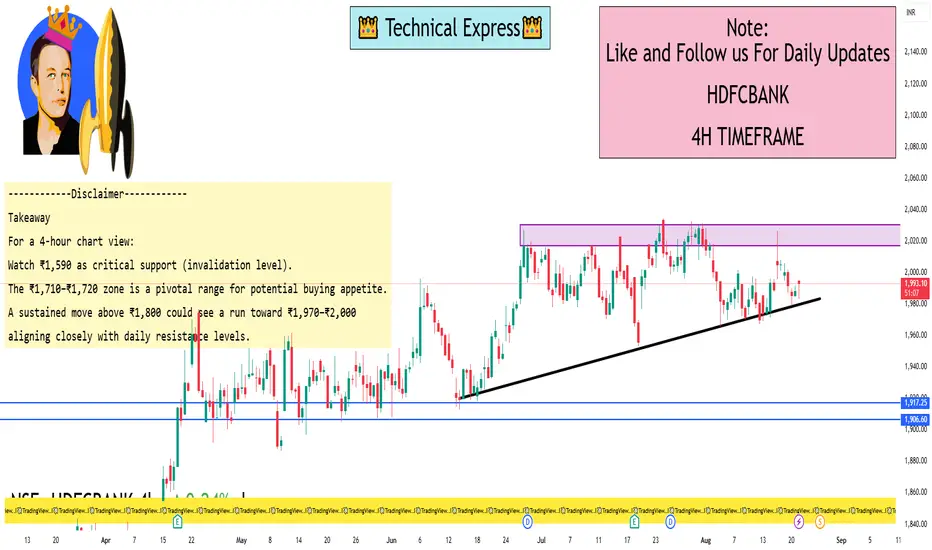
HDFC Bank 4 Hour ViewCurrent Price (Pre-Opening): ₹1,992.60 (an increase of 4.40, or 0.22%)
Previous Close: ₹1,988.20
Day’s Range: ₹1,983.20 – ₹1,997.50
52-Week Range: ₹1,613.00 – ₹2,037.70
4-Hour Time-Frame Levels (Support & Resistance)
While I couldn’t find a source specifically providing 4-hour timeframe levels for HDFC Bank, here's a useful Elliott Wave–based analysis on the 4-hour chart for guidance:
Support (Invalidation Level): ₹1,590 — if the stock dips below this, the current wave structure may be negated.
Key Pivot Zone: ₹1,710–₹1,720 — around here, bulls might regain control.
Upside Target: Break above ₹1,800 could trigger accelerated upward momentum, with a broader move toward ₹1,970–₹2,000 in progress.
Interpretation & Strategy Implications
Key short-term support lies near ₹1,590. A break below this invalidates the bullish wave setup and warrants caution.
If the stock holds above ₹1,710–₹1,720, buyers could step in, leading to upward momentum toward and beyond ₹1,800.
Daily resistance zones:
Immediate resistance: ₹2,030
Momentum breakout zone: ₹2,050
Major resistance: ₹2,100
Takeaway
For a 4-hour chart view:
Watch ₹1,590 as critical support (invalidation level).
The ₹1,710–₹1,720 zone is a pivotal range for potential buying appetite.
A sustained move above ₹1,800 could see a run toward ₹1,970–₹2,000, aligning closely with daily resistance levels.
PCR Trading How Option Trading Works
Let’s simplify with an example:
Stock Price: ₹1000
Call Option Strike: ₹1050
Premium: ₹20
Lot Size: 100 shares
If you buy the call option:
Break-even = Strike Price + Premium = ₹1070
If stock goes to ₹1100 → Profit = (1100-1050-20) × 100 = ₹3000
If stock stays below ₹1050 → You lose only the premium = ₹2000
If you sell (write) the call option:
You collect ₹2000 premium upfront.
If stock stays below 1050, you keep the entire premium as profit.
But if stock goes to ₹1100, you face unlimited loss: (1100-1050-20) × 100 = -₹3000.
👉 This shows: Option buyers have limited risk but unlimited profit potential, while sellers have limited profit but unlimited risk.

Divergence SecretsKey Terminologies in Option Trading
Before diving deep, let’s understand some essential terms:
Call Option: A contract that gives the buyer the right (but not the obligation) to buy an asset at the strike price before expiry.
Example: Buying a Reliance ₹2500 Call Option means you can buy Reliance shares at ₹2500 even if the market price rises to ₹2700.
Put Option: A contract that gives the buyer the right (but not the obligation) to sell an asset at the strike price before expiry.
Example: Buying a Nifty 19000 Put Option means you can sell Nifty at 19000 even if the market falls to 18500.
Premium: The price paid to buy the option contract.
Example: If a Nifty 20000 Call is trading at ₹150, that ₹150 is the premium.
Strike Price: The pre-decided price at which the option can be exercised.
Expiry Date: The last date on which the option contract is valid.
In-the-Money (ITM): Option that already has intrinsic value.
Example: Nifty at 20000 → 19500 Call is ITM.
Out-of-the-Money (OTM): Option that has no intrinsic value (only time value).
Example: Nifty at 20000 → 21000 Call is OTM.
At-the-Money (ATM): Option strike price is closest to current market price.
Lot Size: Options are traded in predefined lot sizes, not single shares.
Example: Bank Nifty option lot size = 15 units (as per 2025 rules).
Option Chain: A tabular representation showing available strikes, premiums, open interest, etc. for calls and puts.

Part 2 Support And ResistanceWhy Options Exist?
Options exist to manage risk and to create trading opportunities. Think of them as financial insurance. Just like you pay a premium for car insurance to protect against damage, in options trading, investors pay a premium to protect themselves against adverse price moves.
For Hedgers: Options act as insurance. A stock investor can buy a put option to protect his portfolio if the market falls.
For Speculators: Options provide leverage. With small capital, traders can take large directional bets.
For Arbitrageurs: Options open opportunities to exploit price inefficiencies between the spot, futures, and options markets.
Key Terminologies in Option Trading
Before diving deep, let’s understand some essential terms:
Call Option: A contract that gives the buyer the right (but not the obligation) to buy an asset at the strike price before expiry.
Example: Buying a Reliance ₹2500 Call Option means you can buy Reliance shares at ₹2500 even if the market price rises to ₹2700.
Put Option: A contract that gives the buyer the right (but not the obligation) to sell an asset at the strike price before expiry.
Example: Buying a Nifty 19000 Put Option means you can sell Nifty at 19000 even if the market falls to 18500.
Premium: The price paid to buy the option contract.
Example: If a Nifty 20000 Call is trading at ₹150, that ₹150 is the premium.
Strike Price: The pre-decided price at which the option can be exercised.
Expiry Date: The last date on which the option contract is valid.
In-the-Money (ITM): Option that already has intrinsic value.
Example: Nifty at 20000 → 19500 Call is ITM.
Out-of-the-Money (OTM): Option that has no intrinsic value (only time value).
Example: Nifty at 20000 → 21000 Call is OTM.
At-the-Money (ATM): Option strike price is closest to current market price.
Lot Size: Options are traded in predefined lot sizes, not single shares.
Example: Bank Nifty option lot size = 15 units (as per 2025 rules).
Option Chain: A tabular representation showing available strikes, premiums, open interest, etc. for calls and puts.

Part 1 Support And ResistanceIntroduction to Option Trading
The stock market offers multiple instruments to trade and invest—stocks, futures, commodities, currencies, and derivatives. Among these, Options have gained tremendous popularity worldwide because they give traders flexibility, leverage, and strategies to profit in all types of market conditions—bullish, bearish, or even sideways.
At its core, an Option is a contract that gives a buyer the right but not the obligation to buy or sell an asset at a predetermined price (called the strike price) before or on a specific date (called the expiry date).
This right comes at a cost, known as the premium, which is paid by the option buyer to the option seller (also called the writer).
Options are widely traded on stocks, indices, commodities, and currencies. In India, for example, options on Nifty 50, Bank Nifty, Sensex, and individual stocks are among the most liquid contracts.
Why Options Exist?
Options exist to manage risk and to create trading opportunities. Think of them as financial insurance. Just like you pay a premium for car insurance to protect against damage, in options trading, investors pay a premium to protect themselves against adverse price moves.
For Hedgers: Options act as insurance. A stock investor can buy a put option to protect his portfolio if the market falls.
For Speculators: Options provide leverage. With small capital, traders can take large directional bets.
For Arbitrageurs: Options open opportunities to exploit price inefficiencies between the spot, futures, and options markets.

Price Action Trading Strategies1. Introduction to Price Action Trading
In the world of trading, countless strategies exist—some rely heavily on indicators, some on algorithms, and others on fundamental data. But one timeless method stands apart: Price Action Trading.
At its core, price action trading is the art of making trading decisions solely based on the movement of price on the chart, without depending too much on lagging indicators like RSI, MACD, or moving averages. Instead, traders read the raw story of the market through candlestick structures, patterns, and levels.
Think of it as reading a book. Every candle tells a story:
Who is stronger—buyers or sellers?
Is the market trending or consolidating?
Is there a potential reversal or continuation?
This method has been used for decades by professional traders because price is the ultimate truth. Indicators may lag, news may be noisy, but price always reflects what’s happening in real time.
2. Core Principles of Price Action
Before diving into strategies, let’s build the foundation.
(a) Market Structure
Price moves in waves—higher highs & higher lows in an uptrend, lower highs & lower lows in a downtrend. Recognizing market structure helps you avoid trading against the dominant flow.
(b) Support and Resistance
These are the backbone of price action trading:
Support: A price level where demand is strong enough to stop a fall.
Resistance: A level where supply is strong enough to cap a rise.
Traders often mark these levels on daily, 4H, or 1H charts to identify potential entry zones.
(c) Supply and Demand Zones
Instead of flat lines, advanced traders look at zones (rectangular regions) where large buying/selling orders entered the market. Price often reacts strongly when revisiting these zones.
(d) Candlestick Psychology
Candlesticks show battle outcomes between bulls and bears. For example:
Long wick at bottom = buyers rejected lower prices.
Engulfing candle = strong reversal signal.
Understanding this psychology forms the essence of price action trading.
(e) Trendlines & Channels
Drawing trendlines helps in identifying trend continuation and potential breakout points. Price often respects channels before making strong moves.
3. Key Tools of Price Action
Unlike indicator-heavy traders, price action traders rely mainly on the chart itself. Key tools include:
Candlestick Patterns (Doji, Pin Bar, Engulfing, etc.)
Chart Patterns (Head & Shoulders, Double Top/Bottom, Triangles, Flags)
Breakouts & Retests
Volume Analysis (optional but powerful to confirm breakouts)
These tools are combined to form actionable strategies.
4. Popular Price Action Patterns
(a) Pin Bar (Rejection Candle)
Long wick + small body.
Signals rejection of a price level.
Example: A bullish pin bar at support indicates buyers defending the zone.
(b) Engulfing Pattern
A candle completely engulfs the previous one.
Bullish engulfing after a downtrend = reversal to upside.
Bearish engulfing after an uptrend = reversal to downside.
(c) Inside Bar
Small candle within the previous candle’s range.
Indicates indecision, often followed by strong breakout.
(d) Double Top & Double Bottom
Double Top: Price tests a resistance twice but fails → bearish reversal.
Double Bottom: Price tests support twice but fails → bullish reversal.
(e) Head and Shoulders
Classic reversal pattern indicating exhaustion of trend.
Head & Shoulders Top → bearish reversal.
Inverse Head & Shoulders → bullish reversal.
5. Price Action Trading Strategies
Now, let’s explore actionable strategies.
Strategy 1: Support & Resistance Bounce
Mark strong daily/weekly support and resistance.
Wait for price to test these levels.
Look for candlestick confirmation (pin bar, engulfing).
Trade in the direction of rejection.
👉 Example: Bank Nifty tests 45,000 support and forms bullish engulfing → buy with stop-loss below support.
Strategy 2: Breakout and Retest
Markets often consolidate before breaking out strongly.
Steps:
Identify a consolidation range.
Wait for breakout (above resistance / below support).
Don’t jump immediately—wait for retest of the broken level.
Enter trade in breakout direction.
👉 Example: Nifty breaks out of 20,000, comes back to retest 20,000 → strong buy.
Strategy 3: Trendline Trading
Draw a trendline connecting higher lows in an uptrend or lower highs in a downtrend.
Buy near trendline support in uptrend, sell near trendline resistance in downtrend.
Look for pin bars or engulfing candles as confirmation.
Strategy 4: Supply & Demand Zone Trading
Mark zones where strong rallies or falls originated.
Wait for price to revisit those zones.
Look for candlestick rejection.
Enter with stop-loss beyond zone.
👉 Example: Reliance stock rallies from ₹2,200 to ₹2,400. Mark demand zone at ₹2,200–₹2,220. When price revisits, buy again.
Strategy 5: Inside Bar Breakout
Find inside bar pattern (consolidation).
Place buy stop above high, sell stop below low.
Whichever breaks, enter trade.
Works best in trending markets.
Strategy 6: Fake Breakout (Stop Hunt Strategy)
Institutions often trigger stop-losses before moving price in real direction.
Spot false breakouts near key levels.
Enter in opposite direction after quick rejection.
👉 Example: Price breaks below support, instantly reverses with bullish engulfing → buy.
Strategy 7: Multi-Timeframe Price Action
Identify higher timeframe trend (daily/4H).
Drop to lower timeframe (15M/1H) for entry.
Align both trends for high probability setups.
Strategy 8: Range Trading
In sideways markets, mark horizontal support & resistance.
Buy near support, sell near resistance.
Exit at opposite boundary.
Strategy 9: Pullback Entry
In a trending market, avoid chasing moves.
Wait for pullback to support (uptrend) or resistance (downtrend).
Enter when trend resumes.
👉 Example: Nifty rallies, pulls back to 20EMA, forms bullish engulfing → buy continuation.
Strategy 10: Price Action with Volume
Combine volume with candlestick setups.
Breakout + high volume = strong move.
Pin bar rejection + high volume = reliable reversal.
6. Risk Management in Price Action Trading
No strategy works without proper risk control.
Always use stop-loss (below support for buys, above resistance for sells).
Risk only 1–2% of capital per trade.
Use risk-to-reward ratio (R:R) of at least 1:2.
Avoid overtrading—wait for high-quality setups.
7. Psychology in Price Action
Price action requires patience. Unlike indicator traders, price action traders must wait for price to tell its story.
Key psychological rules:
Don’t predict; react.
Avoid FOMO (fear of missing out).
Stick to your trading plan.
Journal every trade for review.
8. Advantages of Price Action Trading
Works across all markets (stocks, forex, commodities, crypto).
No dependency on lagging indicators.
Helps understand real market psychology.
Clean charts → better decision-making.
9. Limitations of Price Action
Subjective → two traders may draw different support/resistance.
Requires experience & screen time.
False signals in volatile markets.
Needs discipline to wait for confirmation.
10. Conclusion
Price action trading is a timeless and powerful method for understanding market movements. It doesn’t rely on fancy indicators but instead focuses on the raw truth: the price itself.
Whether you trade intraday, swing, or positional, mastering price action strategies—support/resistance, breakouts, pin bars, engulfing patterns, supply-demand zones—can give you an edge.
But remember: strategies alone don’t guarantee profits. Discipline, risk management, and patience are equally important. Price action is like learning a new language—the more you practice, the more fluent you become in reading the market’s story.
Stock Market & Trading Basics1. What is a Stock Market?
At its core, a stock market is a place where people buy and sell ownership of companies. When you buy a share, you are literally buying a tiny piece of that company. If the company grows, you benefit through price appreciation and dividends. If it fails, you share the loss.
Think of it as a giant marketplace – just like a vegetable market. Instead of potatoes and onions, here you trade shares of companies like Reliance, Infosys, or TCS.
The purpose of a stock market is simple:
Companies raise money for growth.
Investors get a chance to grow their wealth.
It is essentially a bridge between businesses and investors.
2. History and Evolution of Stock Markets
The concept of stock trading is centuries old.
The Amsterdam Stock Exchange (1602) is considered the world’s first official stock exchange, started by the Dutch East India Company.
In the U.S., the New York Stock Exchange (NYSE) was founded in 1792 under the famous “Buttonwood Agreement.”
In India, the Bombay Stock Exchange (BSE) was established in 1875, making it Asia’s oldest stock exchange. Later, the National Stock Exchange (NSE) launched in 1992, which brought electronic trading to India.
Over time, trading shifted from open outcry (shouting bids in trading pits) to today’s electronic screen-based trading where a smartphone is enough to trade.
3. Why Do Companies List Their Shares?
A company can grow in two ways:
Take loans from banks.
Raise money from investors by selling ownership (shares).
When a company issues shares for the first time through an IPO (Initial Public Offering), it becomes “listed” on a stock exchange. Once listed, anyone can buy or sell those shares.
Advantages for companies:
Easy access to large funds.
Increases credibility and brand value.
Provides liquidity to early investors.
4. How Investors Participate in the Market
Investors participate by opening a Demat and Trading Account with a broker (like Zerodha, Upstox, Angel One, etc.).
Trading Account = to buy/sell.
Demat Account = to store shares digitally (like a bank account for stocks).
Example: If you buy 10 shares of Infosys, they’ll reflect in your Demat account, and you can sell anytime through your trading account.
5. Primary Market vs Secondary Market
Primary Market → Where companies issue new shares via IPOs. Example: LIC IPO in India (2022).
Secondary Market → Where investors trade already issued shares. Example: Buying/selling Infosys shares daily on NSE.
In simple terms:
Primary = company → investor.
Secondary = investor → investor.
6. Key Stock Market Participants
The market has different types of players:
Retail Investors → Normal individuals like us.
Domestic Institutional Investors (DII) → Indian mutual funds, insurance companies.
Foreign Institutional Investors (FII) → Big international funds investing in India.
Market Makers / Brokers → Provide liquidity by facilitating trades.
Regulators (SEBI in India, SEC in USA) → Ensure fair play.
7. Basic Market Terminology
Some must-know terms:
Bull Market → Rising market.
Bear Market → Falling market.
Blue-chip stocks → Large, stable companies like TCS, Infosys.
Market Capitalization = Share Price × Total Shares.
Dividend = Profit sharing by company to shareholders.
Volume = Number of shares traded.
8. Types of Trading
Delivery Trading – Buy today, hold as long as you want.
Intraday Trading – Buy and sell on the same day.
Futures & Options (F&O) – Derivatives trading, betting on price movements without owning stock.
Commodities Trading – Gold, silver, crude oil.
Currency Trading – Forex pairs like USD/INR.
9. Understanding Indices
Indices are like “thermometers” of the stock market.
Sensex (BSE, 30 companies) → Oldest Indian index.
Nifty 50 (NSE, 50 companies) → Most popular benchmark in India.
Dow Jones (USA), S&P 500, Nasdaq → Global indices.
If Nifty is up, it usually means the overall market is healthy.
10. Market Orders
Different ways to buy/sell stocks:
Market Order – Execute instantly at current price.
Limit Order – Execute only at a specific price you set.
Stop Loss Order – Automatically sell if price falls below your set limit (risk management).
11. Stock Market Instruments
Equity Shares
Bonds / Debentures
Mutual Funds / ETFs
Derivatives (Futures, Options)
Commodities
Currencies
Each instrument has its own risk-return profile.
12. How Prices Move
Stock prices are driven by:
Demand & Supply → More buyers than sellers = price goes up.
News & Events → Quarterly results, elections, wars, etc.
Investor Sentiment → Greed vs fear.
13. Role of Regulators
In India, SEBI (Securities and Exchange Board of India) regulates markets.
Protects investors.
Ensures transparency.
Monitors insider trading and scams.
14. Trading Basics: Technical vs Fundamental Analysis
Fundamental Analysis → Studying a company’s financials, balance sheet, profits, growth potential. (Long-term investing).
Technical Analysis → Studying price charts, patterns, indicators (RSI, MACD, Moving Averages) to predict short-term moves.
Most traders use a mix of both.
15. Popular Trading Styles
Scalping → Very quick trades, seconds to minutes.
Intraday Trading → Same-day trading.
Swing Trading → Holding for days/weeks.
Position Trading → Holding for months/years.
Long-term Investing → Buy and hold for wealth creation.
Conclusion & Future of Trading
The stock market is not a casino – it is a platform for wealth creation. Yes, risks exist, but with the right knowledge, discipline, and strategy, it can be one of the most rewarding journeys.
The future of trading will be AI-driven, with algorithms, data analytics, and global connectivity shaping markets. But the basics – demand, supply, psychology – will always remain the same.
Part 2 Master Candle Sticks PatternIntroduction to Options Trading
In the world of financial markets, options trading is considered one of the most powerful and flexible forms of trading. Unlike simple stock buying and selling, options allow traders to control larger positions with less capital, hedge their risks, and design strategies that fit different market conditions — bullish, bearish, or even sideways.
An option is essentially a contract that gives the buyer the right, but not the obligation, to buy or sell an asset at a specific price (called the strike price) within a given period of time.
If you buy an option, you are purchasing a right.
If you sell (or write) an option, you are giving someone else that right and taking on an obligation.
Options are traded on stocks, indexes (like Nifty 50 or Bank Nifty in India), commodities, currencies, and even cryptocurrencies in some global markets.
They are widely used by:
Investors to hedge portfolios.
Speculators to make money from price moves.
Institutions to manage large exposures.

Part 4 Learn Institutional TradingParticipants in Options Market
Hedgers: Farmers, companies, or investors protecting against risk. Example: An airline hedging fuel cost with options.
Speculators: Traders betting on market moves with limited capital.
Arbitrageurs: Exploit mispricing between options and underlying.
Why Trade Options?
✅ Advantages:
Leverage: Small premium can control large value.
Flexibility: Can profit in any market condition.
Defined Risk: Buyer’s maximum loss = premium paid.
Income Strategies: Writing options to earn premium.
❌ Risks:
Time Decay: Options lose value daily.
Complexity: Many moving factors (Greeks, volatility).
Unlimited Losses (for Sellers): If selling naked options.

Part 2 Ride The Big MovesBasic Concepts & Terminology
Before going deeper, let’s simplify the core terms in options trading:
Strike Price: The fixed price at which the buyer can buy (call) or sell (put) the asset.
Expiry Date: The date on which the option contract expires (e.g., weekly or monthly).
Option Premium: The cost paid by the buyer to the seller for getting this right.
Lot Size: Options are traded in lots, not single shares. Example: Nifty option lot = 50 units.
In-the-Money (ITM): When exercising the option is profitable.
Out-of-the-Money (OTM): When exercising the option is not profitable.
At-the-Money (ATM): When the strike price = current price of the underlying asset.
Example:
Suppose Reliance is trading at ₹2,500.
A Call option with strike 2,400 is ITM (because you can buy at 2,400, lower than 2,500).
A Put option with strike 2,600 is ITM (because you can sell at 2,600, higher than 2,500).

Part 1 Ride The Big MovesIntroduction to Options Trading
In the world of financial markets, options trading is considered one of the most powerful and flexible forms of trading. Unlike simple stock buying and selling, options allow traders to control larger positions with less capital, hedge their risks, and design strategies that fit different market conditions — bullish, bearish, or even sideways.
An option is essentially a contract that gives the buyer the right, but not the obligation, to buy or sell an asset at a specific price (called the strike price) within a given period of time.
If you buy an option, you are purchasing a right.
If you sell (or write) an option, you are giving someone else that right and taking on an obligation.
Options are traded on stocks, indexes (like Nifty 50 or Bank Nifty in India), commodities, currencies, and even cryptocurrencies in some global markets.
They are widely used by:
Investors to hedge portfolios.
Speculators to make money from price moves.
Institutions to manage large exposures.

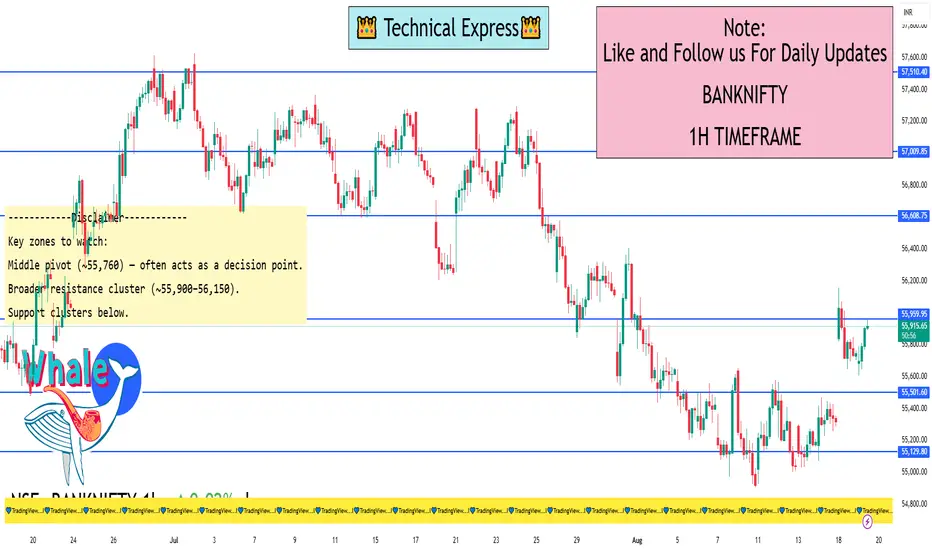
Banknifty 1 Hour Time Frame August MonthBank Nifty is moving within a descending channel on the 1-hour chart.
Immediate support: 55,000–55,200.
Intraday strength likely above 55,950, while weakness may emerge below 55,000.
Short-term Buy Setup: Buy above 55,820 → Targets: 55,910, 56,030, 56,150; Stop-loss: 55,650.
Short-term Sell Setup: Sell below 55,550 → Targets: 55,460, 54,305, 54,150; Stop-loss: 55,800
Positional Support / Resistance (Earnometer)
Support zones: 55,364, 54,865, 52,606.
Resistance zones: 55,899, 56,077, 56,261, 56,332, 56,500, 56,566
Pivot Levels (Investing.com India)
Classic pivots:
Support: S1 = 55,527.8; S2 = 55,586.85; S3 = 55,701.35
Pivot Point (PP): 55,760.4
Resistance: R1 = 55,874.9; R2 = 55,933.95; R3 = 56,048.45
Fibonacci pivots:
S1 = 55,586.85; S2 = 55,653.15; S3 = 55,694.1
PP = 55,760.4
R1 = 55,826.7; R2 = 55,867.65; R3 = 55,933.95
Options Trading & Popular Option Strategies1. Introduction to Options Trading
Options trading is one of the most powerful segments of financial markets. It combines flexibility, leverage, and risk management tools, allowing traders and investors to protect portfolios, generate income, or speculate on market movements.
Unlike stocks, which represent ownership in a company, options are derivative contracts. Their value is derived from an underlying asset such as stocks, indices, commodities, or currencies.
An option is a contract between two parties that gives the buyer the right (not obligation) to buy or sell an asset at a predetermined price (called strike price) before or on a specific date (called expiry date).
Options are widely used in India (on NIFTY, BANKNIFTY, stocks) and globally (on S&P500, commodities, forex). Their appeal comes from:
Small capital requirement compared to stocks.
Potential to profit in bullish, bearish, or sideways markets.
Ability to create tailored strategies using combinations.
2. Basics of Options
2.1 Types of Options
Call Option (CE) – gives the buyer the right to buy the underlying at the strike price.
Used when expecting prices to go up.
Put Option (PE) – gives the buyer the right to sell the underlying at the strike price.
Used when expecting prices to go down.
2.2 Option Buyers vs Sellers
Buyer: Pays premium, has limited risk (loss = premium paid), unlimited profit potential.
Seller (Writer): Receives premium, has limited profit (premium), but potentially large risk.
2.3 Key Terminologies
Strike Price – agreed price of the underlying.
Premium – cost of buying the option.
Expiry – last date on which option is valid.
Moneyness – relation of spot price to strike price.
ITM (In-the-money): Option already has intrinsic value.
ATM (At-the-money): Strike = spot.
OTM (Out-of-the-money): Option has no intrinsic value, only time value.
3. Why Trade Options?
Options serve three main purposes:
Speculation – Traders use options to bet on market direction with lower capital.
Example: Buying NIFTY 20000 Call if expecting NIFTY to rise.
Hedging – Investors protect their portfolios using options.
Example: Buying Put options to hedge stock portfolio during uncertain times.
Income Generation – Selling options to collect premium income.
Example: Covered Call writing by long-term investors.
4. Understanding Option Pricing (The Greeks)
Option prices are influenced by several factors. The "Greeks" help traders understand risks:
Delta – sensitivity to price movement of underlying.
Theta – time decay; options lose value as expiry approaches.
Vega – sensitivity to volatility; higher volatility increases option premium.
Gamma – rate of change of Delta; measures risk in sharp movements.
Understanding Greeks is crucial for advanced strategy building.
5. Popular Option Strategies
Now let’s move into the heart of options trading – strategies.
Each strategy is designed for a specific market view: bullish, bearish, or neutral.
5.1 Bullish Strategies
Long Call
Buy a call option to profit from price rise.
Example: NIFTY at 20,000. Buy 20,200 CE for ₹100 premium.
If NIFTY rises to 20,500 → Profit = 200 points – 100 = 100 points.
Bull Call Spread
Buy lower strike call + Sell higher strike call.
Lower cost, limited profit.
Example: Buy 20,000 CE (₹200), Sell 20,500 CE (₹100). Net cost ₹100. Max profit ₹400.
Bull Put Spread
Sell higher strike put + Buy lower strike put.
Used when moderately bullish.
5.2 Bearish Strategies
Long Put
Buy a put option to profit from price fall.
Example: Stock at ₹1000, buy 950 PE. If stock falls to ₹900 → gain.
Bear Put Spread
Buy higher strike put, sell lower strike put.
Limited profit, limited risk.
Bear Call Spread
Sell lower strike call, buy higher strike call.
Used when expecting mild downside.
5.3 Neutral/Sideways Strategies
Straddle (Long)
Buy Call + Buy Put at same strike.
Profits if market moves sharply either side.
Loss if market remains flat (due to time decay).
Strangle (Long)
Buy OTM Call + Buy OTM Put.
Cheaper than straddle, needs bigger move to profit.
Iron Condor
Sell OTM Call + Sell OTM Put, while buying further OTM Call & Put for protection.
Profits in range-bound markets.
Butterfly Spread
Combines multiple calls or puts to profit from low volatility.
Example: Buy 19,800 CE, Sell 20,000 CE x2, Buy 20,200 CE.
Maximum profit if market stays near 20,000.
5.4 Advanced Strategies
Covered Call
Own the stock + Sell a call option.
Generates premium income, but caps upside.
Protective Put
Own stock + Buy a put option.
Acts like insurance against downside.
Calendar Spread
Buy long-term option, sell short-term option.
Profits from time decay differences.
Ratio Spreads
Involves selling more options than bought.
Used for advanced traders with volatility view.
6. Risk Management in Options
Options trading involves leverage and hence, strict risk management is vital:
Position sizing – never risk more than 2-3% of capital per trade.
Stop-loss levels – exit when trade goes wrong.
Avoid naked option selling – unlimited loss potential.
Understand expiry risk – options decay faster near expiry.
7. Practical Application in Indian Markets
NIFTY & BANKNIFTY Options dominate volumes in India.
Retail traders often buy weekly options for intraday or swing trades.
Institutions use option selling strategies for income.
Example: Selling weekly straddles on BANKNIFTY around events like RBI policy.
8. Pros & Cons of Options Trading
Advantages
Low capital requirement.
Multiple strategies for any market condition.
Useful for hedging portfolios.
Disadvantages
Complex pricing models.
Time decay hurts buyers.
High risk for sellers.
9. Common Mistakes by Beginners
Buying deep OTM options hoping for jackpot.
Not considering time decay (Theta).
Selling naked options without risk control.
Ignoring implied volatility.
Trading too frequently without strategy.
10. Conclusion
Options trading is not gambling—it’s a structured approach to market speculation, hedging, and income generation. Mastering options requires understanding the basics, practicing with small capital, and gradually moving into advanced strategies.
The most successful traders combine technical analysis, volatility studies, and disciplined risk management.
With experience, you’ll realize that options are like financial Lego blocks—you can build strategies suited to any market scenario. Whether bullish, bearish, or neutral, there’s always an option strategy available.
Global Macro Factors in TradingIntroduction
Trading is not just about charts, patterns, or company earnings—it’s also about understanding the bigger picture. This bigger picture is shaped by global macroeconomic factors that influence the flow of money across countries, sectors, and asset classes.
A trader who ignores global macro factors risks missing the underlying forces driving market trends. On the other hand, traders who integrate macroeconomic analysis into their strategies can often anticipate market shifts before they appear on technical charts.
In this deep dive, we’ll explore what global macro factors are, why they matter, how they affect different asset classes, and how traders can practically use them in their decision-making.
What are Global Macro Factors?
Global macro factors are large-scale economic, political, and social conditions that impact the performance of financial markets worldwide. They include:
Economic growth cycles (GDP, industrial output, unemployment)
Inflation and deflation trends
Interest rates and monetary policy
Government fiscal policies
Global trade dynamics (exports, imports, tariffs, supply chains)
Geopolitical risks (wars, elections, sanctions, political instability)
Commodities and energy prices (oil, gas, metals, agriculture)
Currency exchange rates
Technological disruptions & structural shifts
Climate change and sustainability policies
These factors drive cross-border capital flows, influence investor sentiment, and dictate the performance of stocks, bonds, commodities, and currencies.
Why Global Macro Factors Matter for Traders
They Move Markets More Than Company News
For example, if the U.S. Federal Reserve raises interest rates sharply, the Indian stock market might fall—even if Indian companies are performing well—because global capital exits riskier emerging markets.
They Explain Market Trends
Sometimes markets rise or fall without obvious technical reasons. Looking at macro data (like inflation, global interest rates, or oil prices) often reveals the underlying cause.
They Help in Asset Allocation
A trader who knows that inflation is rising globally may prefer commodity trading (gold, silver, crude) over growth stocks.
They Reduce Trading Risk
Anticipating macro shocks—such as a recession, a currency crisis, or a geopolitical conflict—helps traders manage risk better.
Key Global Macro Factors in Detail
Let’s go through the most important ones, with trading implications.
1. Economic Growth Cycles (GDP Trends)
What it means:
Gross Domestic Product (GDP) is the main indicator of economic health. High GDP growth attracts foreign investments, boosts corporate profits, and supports strong stock market performance. Slow growth or contraction signals recession.
Impact on Trading:
When global growth is strong → equities, emerging markets, and cyclical sectors (automobiles, banking, infrastructure) perform well.
When growth slows → safe-haven assets like gold, U.S. Treasuries, and defensive sectors (pharma, FMCG) gain.
Example:
In 2020, when the world economy went into lockdown, GDP collapsed globally. Stock markets initially crashed, but later surged when governments and central banks provided massive stimulus, betting on a V-shaped recovery.
2. Inflation & Deflation
What it means:
Inflation is the rise in prices of goods and services. Controlled inflation is good—it indicates demand. But runaway inflation hurts purchasing power. Deflation, the opposite, signals weak demand and economic stagnation.
Impact on Trading:
High inflation → central banks raise interest rates, stock markets fall, bond yields rise. Commodities like gold and oil rally.
Low inflation/deflation → central banks cut rates, boosting equity markets.
Example:
In 2022, global inflation spiked due to supply chain disruptions and the Russia-Ukraine war. Central banks raised rates aggressively, causing sharp declines in tech and growth stocks while energy companies benefited.
3. Interest Rates & Monetary Policy
What it means:
Central banks like the U.S. Federal Reserve, ECB, or RBI control monetary policy—deciding interest rates and liquidity. Interest rates directly affect borrowing costs, investments, and asset valuations.
Impact on Trading:
Rising rates → bearish for stocks (especially tech), bullish for bonds and the U.S. dollar.
Falling rates → bullish for equities and commodities, bearish for the dollar.
Example:
In 2023–2024, markets closely tracked the Fed’s decisions. Whenever the Fed hinted at slowing down rate hikes, global stock markets rallied.
4. Fiscal Policy & Government Spending
What it means:
Governments influence markets through budgets, taxation, subsidies, and spending programs. Fiscal stimulus can boost markets, while austerity can slow them.
Impact on Trading:
Infrastructure spending → benefits construction, cement, steel stocks.
Tax cuts → boost corporate profits and consumer spending.
Subsidies/removals → affect agriculture, energy, and renewable stocks.
Example:
India’s Union Budget announcements often cause sectoral rallies—defense allocations push defense stocks up, while higher infrastructure spending boosts capital goods.
5. Global Trade & Supply Chains
What it means:
Globalization ties economies together. Exports, imports, tariffs, sanctions, and supply chain disruptions influence asset prices.
Impact on Trading:
Trade wars or tariffs → hurt global growth and export-driven stocks.
Strong global trade → boosts commodities and shipping sectors.
Supply chain disruptions → create inflation and shortages (e.g., semiconductors in 2021).
Example:
The U.S.-China trade war in 2018 caused volatility in technology and industrial stocks worldwide.
6. Geopolitical Risks
What it means:
Wars, sanctions, elections, and political instability affect global investor sentiment.
Impact on Trading:
Rising geopolitical tensions → bullish for gold, oil, U.S. dollar (safe havens).
Stable geopolitics → bullish for equities and emerging markets.
Example:
The Russia-Ukraine war in 2022 caused oil and gas prices to spike, benefiting energy companies but hurting global equity markets.
7. Commodities & Energy Prices
What it means:
Oil, natural gas, metals, and agricultural commodities drive costs across industries.
Impact on Trading:
Rising oil → hurts airline, transport, and manufacturing stocks. Benefits energy producers.
Rising gold/silver → signals investor risk aversion.
Agricultural prices → affect FMCG and food companies.
Example:
When crude oil rose above $100 per barrel in 2022, airline stocks crashed while oil & gas companies rallied.
8. Currency Exchange Rates
What it means:
Currencies reflect economic health, capital flows, and interest rate differentials.
Impact on Trading:
Strong USD → hurts emerging markets, commodity prices fall.
Weak USD → boosts gold, commodities, and EM equities.
Currency depreciation → benefits exporters but hurts importers.
Example:
In 2022, the U.S. dollar index hit a 20-year high. This pressured Indian equities as foreign investors pulled money out, and crude oil imports became costlier for India.
9. Technological Disruptions
What it means:
Innovation (AI, blockchain, EVs, renewable energy) shifts capital allocation.
Impact on Trading:
New tech adoption → boosts related sectors (AI → IT companies, EV → battery makers).
Old industries → may lose capital (oil majors losing to renewables).
Example:
AI-driven rallies in 2023–2024 saw tech giants like Nvidia and Microsoft outperform global markets.
10. Climate Change & ESG Policies
What it means:
Sustainability and environmental regulations now influence capital flows.
Impact on Trading:
ESG-focused funds avoid polluting industries.
Renewable energy, EV, and green tech companies benefit.
Carbon taxes and environmental restrictions increase costs for traditional industries.
Example:
Europe’s carbon neutrality push boosted renewable energy companies while hurting coal producers.
How Global Macro Factors Affect Different Asset Classes
Equities (Stocks)
Bull markets when growth, low inflation, and easy money align.
Bear markets during recessions, high inflation, or geopolitical shocks.
Bonds
Bond prices rise when interest rates fall.
Inflation erodes bond returns.
Commodities
Rise in inflation and geopolitical risks → commodity bull runs.
Strong dollar usually weakens commodities.
Currencies (Forex)
Driven by interest rates, trade balances, and capital flows.
Safe-haven currencies (USD, CHF, JPY) rise during crises.
Crypto Assets
Sensitive to liquidity conditions and global risk sentiment.
Perform better during easy monetary policy and risk-on environments.
Conclusion
Global macro factors are the invisible strings that pull the markets in different directions. They influence whether money flows into equities, commodities, bonds, or currencies.
For traders, the ability to combine macro awareness with technical analysis is a powerful edge. It helps anticipate large market moves, align trades with the broader economic cycle, and reduce risk exposure.
In today’s interconnected world, no market operates in isolation. Understanding GDP trends, inflation, interest rates, currency shifts, and geopolitical developments is essential to surviving and thriving as a trader.
Part 10 Trading Master Class 1. Introduction – What are Options?
Imagine you want to buy a house, but you are not fully sure. The seller says:
“You can pay me ₹1 lakh today as a token, and within the next 3 months you have the right (not obligation) to buy this house for ₹50 lakh. If you don’t buy, I will keep your ₹1 lakh.”
That token money is exactly like an option premium.
If house prices shoot up to ₹60 lakh, you can buy it at ₹50 lakh (huge profit).
If prices fall to ₹40 lakh, you don’t buy, and you only lose ₹1 lakh.
This is the essence of options trading:
Right but not obligation to buy/sell at a fixed price within a fixed time.
Limited loss (premium paid).
Unlimited potential profit.
In stock markets, instead of houses, you deal with shares, indexes, or commodities.
2. How Options Work
Options are part of the derivatives market (value is derived from something else).
Underlying asset: Could be NIFTY, Bank NIFTY, Reliance stock, Gold, etc.
Strike price: Pre-decided price at which you may buy/sell.
Expiry: Fixed date (weekly/monthly).
Premium: Price you pay to buy the option.
Options are of two main types:
Call Option (CE) → Right to buy at a fixed price.
Put Option (PE) → Right to sell at a fixed price.

Part 9 Trading Master Class Options in Indian Markets
Options are hugely popular in India, especially on NIFTY & Bank NIFTY.
Weekly expiries (every Thursday) attract massive trading.
Liquidity is high → easy to enter/exit.
Retail traders mostly buy options, institutions mostly sell options.
Example:
Bank NIFTY at 48,000.
Retail traders buy 48,500 CE or 47,500 PE hoping for movement.
Institutions sell far OTM options like 49,500 CE or 46,500 PE to collect premium.
Psychology & Discipline
Most beginners lose in options because:
They only buy OTM options (cheap but low probability).
They ignore time decay (premium melts fast).
They overtrade with leverage.
Success in options = discipline, risk control, strategy, patience.
Pro tips:
Never put all money in one trade.
Understand probability – 70% of options expire worthless.
Use stop-loss and position sizing.

PCR Trading StrategyMoneyness of Options
Moneyness shows whether the option has intrinsic value:
In the Money (ITM): Already profitable if exercised.
At the Money (ATM): Strike price = market price.
Out of the Money (OTM): No intrinsic value, only time value.
Factors Affecting Option Prices (Option Greeks)
Options are influenced by multiple factors:
Delta: Sensitivity to underlying price changes.
Gamma: Sensitivity of Delta.
Theta: Time decay – options lose value as expiry nears.
Vega: Sensitivity to volatility.
Rho: Sensitivity to interest rates.
Payoff Profiles
Buyer of Call/Put: Limited loss (premium), unlimited profit.
Seller of Call/Put: Limited profit (premium), unlimited or large risk.

Divergence SecretsWhat Are Options?
Options are derivative contracts that give the buyer the right (but not the obligation) to buy or sell an underlying asset (like stocks, index, currency, or commodity) at a predetermined price on or before a specific date.
Call Option (CE): Right to buy.
Put Option (PE): Right to sell.
Key Terms in Options
To understand options, you must know these basics:
Strike Price: The pre-decided price at which you can buy/sell the asset.
Premium: The cost you pay to buy the option contract.
Expiry Date: The date when the option contract ends.
Underlying Asset: The stock, index, or commodity linked to the option.
Lot Size: Minimum quantity you can trade in options (e.g., Nifty lot = 50 units).
Call vs Put Options
Call Option Buyer: Expects price to rise (bullish).
Put Option Buyer: Expects price to fall (bearish).
Call Option Seller: Expects price to stay below strike.
Put Option Seller: Expects price to stay above strike.

Part 1 Support And ResistanceWhat are Options?
Options are a type of derivative instrument in financial markets.
This means their value is derived from an underlying asset, such as stocks, indices, commodities, or currencies.
An option gives you the right, but not the obligation, to buy or sell the underlying asset at a predefined price (strike price) before or on a specific date (expiry date).
Types of Options
Call Option – Right to buy an asset at a fixed price before expiry.
Example: If you buy a call option of Reliance at ₹2,500, and the stock goes up to ₹2,700, you can still buy at ₹2,500 and profit.
Put Option – Right to sell an asset at a fixed price before expiry.
Example: If you buy a put option of Infosys at ₹1,500, and the stock falls to ₹1,300, you can still sell at ₹1,500 and profit.
Key Terms in Options
Premium – Price you pay to buy the option.
Strike Price – Pre-decided price at which you can buy/sell.
Expiry – The last date till which the option is valid.
ITM (In the Money) – Option has intrinsic value.
OTM (Out of the Money) – Option has no intrinsic value (only time value).
