Part11 Trading MasterclassHow Options Work
Let’s break this down with an example.
Call Option Example:
You buy a call option on Stock A with a strike price of ₹100, paying a premium of ₹5. If the stock price rises to ₹120, you can buy it for ₹100 and sell it for ₹120—earning a ₹20 profit per share, minus the ₹5 premium, netting ₹15.
If the stock stays below ₹100, you simply let the option expire. Your loss is limited to the ₹5 premium.
Put Option Example:
You buy a put option on Stock A with a strike price of ₹100, paying a ₹5 premium. If the stock falls to ₹80, you can sell it for ₹100—earning ₹20, minus ₹5 premium = ₹15 profit.
If the stock stays above ₹100, the option expires worthless. Again, your loss is limited to ₹5.
Why Trade Options?
A. Leverage
Options require a smaller initial investment compared to buying stocks, but they can offer significant returns.
B. Risk Management (Hedging)
Options can hedge against downside risk. For example, if you own shares, buying a put option can protect you against losses if the price falls.
C. Income Generation
Writing (selling) options like covered calls can generate consistent income.
D. Strategic Flexibility
You can profit in bullish, bearish, or neutral markets using different strategies.
HDFCBANK

Part12 Trading MasterclassIntroduction to Options Trading
Options trading is one of the most powerful tools in financial markets. Unlike traditional stock trading, where you buy and sell shares directly, options give you the right but not the obligation to buy or sell an asset at a predetermined price before a specific date. This flexibility allows traders to hedge risks, generate income, and speculate on price movements with limited capital.
In recent years, options trading has seen a surge in popularity, especially among retail investors. With the growth of online trading platforms and educational resources, more traders are exploring this complex yet rewarding field.
What Is an Option?
An option is a financial derivative contract. It derives its value from an underlying asset—commonly a stock, index, ETF, or commodity.
There are two types of options:
Call Option: Gives the holder the right to buy the asset at a fixed price (strike price) before or on the expiry date.
Put Option: Gives the holder the right to sell the asset at a fixed price before or on the expiry date.
Key Terms to Know:
Strike Price: The price at which the option can be exercised.
Premium: The price paid to purchase the option.
Expiration Date: The last date on which the option can be exercised.
Underlying Asset: The financial instrument (like a stock) the option is based on.
In the Money (ITM): When exercising the option would be profitable.
Out of the Money (OTM): When exercising the option would not be profitable.
At the Money (ATM): When the strike price is equal to the market price.

Part5 Institutional Trading How Options Work
Let’s break this down with an example.
Call Option Example:
You buy a call option on Stock A with a strike price of ₹100, paying a premium of ₹5. If the stock price rises to ₹120, you can buy it for ₹100 and sell it for ₹120—earning a ₹20 profit per share, minus the ₹5 premium, netting ₹15.
If the stock stays below ₹100, you simply let the option expire. Your loss is limited to the ₹5 premium.
Put Option Example:
You buy a put option on Stock A with a strike price of ₹100, paying a ₹5 premium. If the stock falls to ₹80, you can sell it for ₹100—earning ₹20, minus ₹5 premium = ₹15 profit.
If the stock stays above ₹100, the option expires worthless. Again, your loss is limited to ₹5.
Why Trade Options?
A. Leverage
Options require a smaller initial investment compared to buying stocks, but they can offer significant returns.
B. Risk Management (Hedging)
Options can hedge against downside risk. For example, if you own shares, buying a put option can protect you against losses if the price falls.
C. Income Generation
Writing (selling) options like covered calls can generate consistent income.
D. Strategic Flexibility
You can profit in bullish, bearish, or neutral markets using different strategies.

Part2 Ride The Big MovesIntroduction to Options Trading
Options trading is one of the most powerful tools in financial markets. Unlike traditional stock trading, where you buy and sell shares directly, options give you the right but not the obligation to buy or sell an asset at a predetermined price before a specific date. This flexibility allows traders to hedge risks, generate income, and speculate on price movements with limited capital.
In recent years, options trading has seen a surge in popularity, especially among retail investors. With the growth of online trading platforms and educational resources, more traders are exploring this complex yet rewarding field.
What Is an Option?
An option is a financial derivative contract. It derives its value from an underlying asset—commonly a stock, index, ETF, or commodity.
There are two types of options:
Call Option: Gives the holder the right to buy the asset at a fixed price (strike price) before or on the expiry date.
Put Option: Gives the holder the right to sell the asset at a fixed price before or on the expiry date.
Key Terms to Know:
Strike Price: The price at which the option can be exercised.
Premium: The price paid to purchase the option.
Expiration Date: The last date on which the option can be exercised.
Underlying Asset: The financial instrument (like a stock) the option is based on.
In the Money (ITM): When exercising the option would be profitable.
Out of the Money (OTM): When exercising the option would not be profitable.
At the Money (ATM): When the strike price is equal to the market price.

Part8 Trading MasterclassIntroduction to Options Trading Strategies
Options are like the “Swiss army knife” of the financial markets — flexible tools that can be shaped to fit bullish, bearish, neutral, or volatile market views. They’re contracts that give you the right, but not the obligation, to buy or sell an asset at a specific price (strike) on or before a certain date (expiry).
While most beginners think options are just for making huge leveraged bets, seasoned traders use strategies — combinations of buying and selling calls and puts — to control risk, generate income, or hedge portfolios.
Why Use Strategies Instead of Simple Buy/Sell?
Risk Management: You can cap your losses while keeping upside potential.
Income Generation: Strategies like covered calls and credit spreads generate consistent cash flow.
Direction Neutrality: You can profit even when the market moves sideways.
Volatility Play: You can design trades to profit from expected volatility spikes or drops.
Hedging: Protect stock holdings against adverse moves.

Part3 Institutuonal Trading Categories of Options Strategies
Directional Strategies – Profit from a clear bullish or bearish bias.
Neutral Strategies – Profit from time decay or volatility drops.
Volatility-Based Strategies – Profit from big moves or volatility increases.
Hedging Strategies – Reduce risk on existing positions.
Directional Strategies
Bullish Strategies
These make money when the underlying price rises.
Long Call
Setup: Buy 1 Call
When to Use: Expect sharp upside.
Risk: Limited to premium paid.
Reward: Unlimited.
Example: Nifty at 22,000, buy 22,200 Call for ₹150. If Nifty rises to 22,500, option might be worth ₹300+, doubling your investment.
Bull Call Spread
Setup: Buy 1 ITM/ATM Call + Sell 1 higher strike Call.
Purpose: Lower cost vs. long call.
Risk: Limited to net premium paid.
Reward: Limited to difference between strikes minus premium.
Example: Buy 22,000 Call for ₹200, Sell 22,500 Call for ₹80 → Net cost ₹120. Max profit ₹380 (if Nifty at or above 22,500).
Bull Put Spread (Credit Spread)
Setup: Sell 1 higher strike Put + Buy 1 lower strike Put.
Purpose: Earn premium in bullish to neutral markets.
Risk: Limited to spread width minus premium.
Example: Sell 22,000 Put ₹200, Buy 21,800 Put ₹100 → Credit ₹100.

Thematic trading1. Introduction to Thematic Trading
Thematic trading is the art (and science) of building investment or trading positions based on a central, long-term theme rather than just stock-specific fundamentals or short-term technical signals.
Instead of asking “Which stock will go up tomorrow?”, thematic traders ask:
“What big trend or theme will reshape markets over the next months or years, and which assets will benefit from it?”
This approach isn’t about chasing random hot tips; it’s about riding waves created by structural economic, social, technological, or geopolitical changes.
Examples of past and present themes:
Renewable Energy Transition – Solar, wind, battery storage.
Artificial Intelligence Boom – AI software, chipmakers, data infrastructure.
Electric Vehicles (EV) Revolution – Tesla, BYD, lithium miners.
Aging Population – Healthcare tech, pharmaceuticals, retirement services.
De-Dollarization – Gold, emerging market currencies.
A thematic trader tries to identify such trends before they become “obvious” to everyone, allowing them to capture significant price moves.
2. How Thematic Trading Differs from Other Approaches
To understand thematic trading, it helps to contrast it with traditional strategies:
Approach Focus Time Horizon Core Question
Technical Trading Charts, price patterns, indicators Short–Medium “Where will price move based on market patterns?”
Fundamental Investing Company earnings, valuation, balance sheet Medium–Long “Is this company undervalued?”
Thematic Trading Structural macro trends & sector-wide catalysts Medium–Long (weeks to years) “Which assets benefit from a large, ongoing shift?”
Unlike purely technical traders, thematic traders don’t care about every short-term fluctuation.
Unlike pure fundamentalists, they don’t need a stock to be “cheap” — it just needs to ride the right wave.
3. Core Elements of Thematic Trading
Thematic trading is not guesswork — it has four main building blocks:
A. Identifying the Theme
The idea: A technology, trend, regulation, or global shift that can influence markets.
Sources: Economic reports, tech innovation cycles, policy announcements, consumer behavior shifts, social trends.
Example: The “Green Hydrogen Economy” theme emerged from global climate commitments and renewable energy breakthroughs.
B. Mapping the Value Chain
Ask: “Which companies or assets directly or indirectly benefit?”
Break it down into tiers:
Core Beneficiaries – Directly part of the trend (e.g., hydrogen electrolyzer manufacturers).
Enablers – Suppliers or technology providers (e.g., hydrogen fuel tank makers).
Secondary Beneficiaries – Indirectly benefit from the trend (e.g., shipping companies transporting hydrogen).
C. Timing the Trade
Even a great theme can lose money if entered at the wrong time.
Use macro cycle analysis, technical indicators, and market sentiment gauges to decide when to enter.
Example: EV theme was correct in 2018, but Tesla’s huge run came mainly after mid-2019 when sentiment and demand aligned.
D. Risk & Exit Strategy
Themes can fade faster than expected.
Have clear stop-loss levels or theme invalidation criteria (e.g., if a new regulation bans the technology, exit immediately).
Avoid overconcentration — diversify across related plays.
4. Types of Themes in Thematic Trading
Themes can be classified based on their origin:
A. Technology-Driven Themes
Arise from innovation cycles.
Examples: AI, quantum computing, blockchain, 5G, biotech.
B. Demographic & Social Themes
Driven by population and behavior shifts.
Examples: Aging population → healthcare; Gen Z preferences → social media stocks.
C. Environmental & Energy Themes
Focus on climate change adaptation, clean energy, resource scarcity.
Examples: ESG investing, EVs, battery metals.
D. Macro-Economic & Policy Themes
Based on government actions, monetary policy, trade wars.
Examples: Infrastructure spending bills → cement & steel stocks; rate cuts → growth stocks.
E. Geopolitical & Security Themes
Triggered by conflicts, alliances, or national security concerns.
Examples: Defense contractors during global tension; energy security post-Russia-Ukraine war.
5. How to Identify Strong Themes
The magic of thematic trading lies in catching the theme early. Here’s a systematic approach:
A. Track Megatrends
Use reports from McKinsey, PwC, IMF, World Bank.
Follow innovation trackers (CB Insights, Crunchbase).
Watch patent filings for clues to emerging tech.
B. Follow Capital Flows
Where institutional money flows, trends follow.
Monitor ETF launches — a new “Space Exploration ETF” means the theme has institutional interest.
C. Monitor Policy Changes
Example: India’s PLI Scheme (Production Linked Incentive) boosted domestic manufacturing plays.
D. Social Media & Public Sentiment
Twitter, Reddit, LinkedIn often discuss new trends before mainstream media.
6. Thematic Trading Strategies
Here are the core ways traders implement thematic ideas:
A. Stock Picking Within the Theme
Identify the top beneficiaries in the sector.
Balance between leaders (stable growth) and emerging players (higher risk/reward).
B. ETF-Based Thematic Trading
If you don’t want to pick individual stocks, thematic ETFs (e.g., ARK Innovation, Global X Robotics) offer ready-made baskets.
C. Options & Derivatives
Play themes with calls for upside or puts for hedging.
Example: Buy call options on semiconductor stocks ahead of an AI boom.
D. Pair Trading
Long on theme winners, short on those likely to lose.
Example: Long renewable energy stocks, short traditional coal producers.
E. Multi-Asset Thematic Plays
Sometimes the theme extends beyond equities:
Commodities (e.g., lithium for EVs).
Currencies (e.g., yen weakening from Japan’s demographic shift).
Crypto (e.g., blockchain-based financial solutions).
7. Role of Technical Analysis in Thematic Trading
While themes are fundamentally driven, technical analysis helps with:
Entry & Exit Timing: Use moving averages, breakout patterns, RSI.
Confirming Momentum: Volume surges can indicate institutional buying into a theme.
Avoiding FOMO Entries: Themes can get overheated; technical tools prevent buying tops.
Example:
In the AI rally of 2023, Nvidia broke above a long-term resistance with huge volume — a strong technical confirmation of the theme’s momentum.
8. Thematic Trading Time Horizons
Short-Term Thematic Plays (Weeks–Months)
Triggered by immediate events (e.g., new regulation, product launch).
Example: Pharma rally after FDA approval.
Medium-Term (Months–1 Year)
Driven by industry growth cycles.
Example: EV infrastructure rollout over a year.
Long-Term (Years)
Megatrends like AI or climate change.
Requires patience and conviction.
Final Thoughts
Thematic trading is like surfing:
You don’t control the wave, but you can ride it — if you spot it early, position yourself correctly, and know when to jump off.
It combines macro insight, sector analysis, and technical timing, making it one of the most exciting and potentially profitable approaches in modern trading.
But remember: every theme has a life cycle. The best thematic traders are not those who pick the most themes — but those who know when to enter, scale up, and exit with discipline.
Sector Rotation Strategies1. Introduction to Sector Rotation
In the financial markets, sector rotation is the strategic shifting of investments between different sectors of the economy to capitalize on the varying performance of those sectors during different phases of the economic and market cycle.
The basic premise:
Not all sectors perform equally at the same time.
Economic cycles influence which sectors thrive and which lag.
By positioning capital into the right sectors at the right time, an investor can potentially outperform the overall market.
In practice, sector rotation is a top-down investment approach, starting from macroeconomic conditions → to market cycles → to sector performance → to specific stock selection.
2. Understanding Sectors and Market Cycles
The stock market is divided into 11 primary sectors as classified by the Global Industry Classification Standard (GICS):
Energy – Oil, gas, and related services.
Materials – Mining, chemicals, paper, etc.
Industrials – Manufacturing, aerospace, transportation.
Consumer Discretionary – Retail, luxury goods, entertainment.
Consumer Staples – Food, beverages, household goods.
Healthcare – Pharmaceuticals, biotech, hospitals.
Financials – Banks, insurance, asset managers.
Information Technology (IT) – Software, hardware, semiconductors.
Communication Services – Media, telecom.
Utilities – Electricity, water, gas distribution.
Real Estate – REITs and property developers.
These sectors do not rise and fall together. Instead, they rotate in leadership depending on the stage of the economic cycle.
3. The Economic Cycle and Sector Performance
Sector rotation is deeply connected to the business cycle, which has four broad phases:
Early Expansion (Recovery)
Economy rebounds from a recession.
Interest rates are low, liquidity is high.
Consumer spending begins to rise.
Corporate profits improve.
Leading Sectors: Technology, Consumer Discretionary, Financials.
Mid Expansion (Growth)
Strong GDP growth.
Employment levels are high.
Corporate earnings peak.
Leading Sectors: Industrials, Materials, Energy (as demand rises).
Late Expansion (Peak)
Inflation pressures build.
Central banks raise interest rates.
Growth slows.
Leading Sectors: Energy (inflation hedge), Materials, Consumer Staples, Healthcare.
Contraction (Recession)
GDP falls, unemployment rises.
Consumer spending drops.
Risk assets underperform.
Leading Sectors: Utilities, Consumer Staples, Healthcare (defensive sectors).
Sector Rotation Map
Economic Phase Best Performing Sectors Reason
Early Recovery Tech, Financials, Consumer Discretionary Low rates boost growth stocks
Mid Expansion Industrials, Materials, Energy Demand and capital spending rise
Late Expansion Energy, Materials, Healthcare, Staples Inflation hedging, defensive
Recession Utilities, Consumer Staples, Healthcare Stable cash flows, essential goods
4. Sector Rotation Strategies in Practice
There are two main approaches:
A. Tactical Sector Rotation
Short- to medium-term shifts (weeks to months) based on:
Economic data (GDP growth, inflation, interest rates).
Earnings reports and forward guidance.
Market sentiment indicators.
Technical analysis of sector ETFs and indexes.
Example:
If manufacturing PMI is rising → Industrials & Materials may outperform.
B. Strategic Sector Rotation
Long-term positioning (months to years) based on:
Anticipated shifts in the business cycle.
Structural economic changes (e.g., green energy trend, AI boom).
Demographic trends (aging population → Healthcare demand).
Example:
Positioning into renewable energy over the next decade due to global decarbonization policies.
5. Tools & Indicators for Sector Rotation
Sector rotation isn’t guesswork — it relies on economic, technical, and intermarket analysis.
Economic Indicators:
GDP Growth – High GDP growth favors cyclical sectors; low GDP growth favors defensive sectors.
Interest Rates – Rising rates benefit Financials (banks), hurt rate-sensitive sectors like Real Estate.
Inflation Data (CPI, PPI) – High inflation boosts Energy & Materials.
PMI (Purchasing Managers' Index) – Expanding manufacturing favors Industrials & Materials.
Technical Indicators:
Relative Strength (RS) Analysis – Compare sector ETF performance vs. the S&P 500.
Moving Averages – Identify uptrends/downtrends in sector performance.
Relative Rotation Graphs (RRG) – Visual representation of sector momentum & relative strength.
Market Sentiment Indicators:
Fear & Greed Index – Helps gauge if market is risk-on (cyclicals lead) or risk-off (defensives lead).
VIX (Volatility Index) – High VIX favors defensive sectors.
6. Sector Rotation Using ETFs
The easiest way to implement sector rotation is via sector ETFs.
In the U.S., SPDR offers Select Sector SPDR ETFs:
Sector ETF Ticker
Communication Services XLC
Consumer Discretionary XLY
Consumer Staples XLP
Energy XLE
Financials XLF
Healthcare XLV
Industrials XLI
Materials XLB
Real Estate XLRE
Technology XLK
Utilities XLU
Example Strategy:
Track the top 3 ETFs with the strongest relative strength vs. the S&P 500.
Allocate more capital to them while reducing exposure to underperforming sectors.
Rebalance monthly or quarterly.
7. Historical Examples of Sector Rotation
Example 1 – Post-2008 Recovery
Early 2009: Financials, Tech, Consumer Discretionary surged as markets rebounded from the GFC.
Late 2010–2011: Industrials & Energy took leadership as global growth accelerated.
2012 slowdown: Defensive sectors like Utilities & Healthcare outperformed.
Example 2 – COVID-19 Pandemic
Early 2020 Crash: Utilities, Healthcare, and Consumer Staples outperformed during the panic.
Mid-2020: Tech & Communication Services surged due to remote work and digital adoption.
2021: Energy & Financials surged as the economy reopened and inflation rose.
8. Risks & Challenges in Sector Rotation
While powerful, sector rotation isn’t foolproof.
Challenges:
Timing Risk – Predicting exact cycle turns is hard.
False Signals – Economic indicators can give misleading short-term trends.
Overtrading – Too frequent switching increases costs.
Global Factors – Geopolitics, pandemics, or commodity shocks can disrupt cycles.
Correlation Shifts – Sectors can behave differently than historical patterns.
Example:
In 2023, high interest rates were expected to benefit Financials, but bank failures (SVB collapse) caused underperformance despite the macro setup.
Conclusion
Sector rotation strategies work because capital naturally moves to where growth and safety are perceived.
By understanding:
The economic cycle
Sector behavior in each phase
The right tools & indicators
…investors can align portfolios with the strongest parts of the market at any given time.
However, the strategy requires discipline, patience, and flexibility.
Market cycles can be irregular, and exogenous shocks can disrupt historical patterns. Therefore, sector rotation works best when blended with risk management, diversification, and constant monitoring.
Algorithmic trading 1. Introduction to Algorithmic Trading
Algorithmic trading, often called algo trading or automated trading, is the process of using computer programs to execute trades in financial markets according to a predefined set of rules.
These rules can be based on price, volume, timing, market conditions, or mathematical models. Once set, the algorithm automatically sends orders to the market without manual intervention.
In simple terms:
Instead of sitting in front of a trading screen and clicking “buy” or “sell,” you tell a machine exactly what conditions to look for, and it trades for you.
It’s like giving your brain + discipline to a computer — minus the coffee breaks, panic, and impulsive decisions.
1.1 Why Algorithms?
Humans are prone to:
Emotional bias (fear, greed, hesitation)
Slow reaction times
Fatigue and inconsistency
Computers, in contrast:
Execute instantly (microseconds or nanoseconds)
Follow rules 100% consistently
Handle multiple markets at once
Backtest ideas over years of data within minutes
This explains why algo trading accounts for 70%–80% of trading volume in developed markets like the US and over 50% in Indian markets for certain instruments.
1.2 The Core Components
Every algorithmic trading system consists of:
Strategy Logic – The rules that trigger trades (e.g., moving average crossover, statistical arbitrage).
Programming Interface – The language/platform (Python, C++, Java, MetaTrader MQL, etc.).
Market Data Feed – Real-time price, volume, and order book data.
Execution Engine – Connects to broker/exchange to place orders.
Risk Management Module – Stops, limits, and capital allocation rules.
Performance Tracker – Monitors profit/loss, drawdowns, and execution quality.
2. How Algorithmic Trading Works – Step by Step
Let’s break it down:
Idea Generation
Define a hypothesis: “I think when the 50-day moving average crosses above the 200-day MA, the stock will trend upward.”
Strategy Design
Turn the idea into exact rules: If MA50 > MA200 → Buy; If MA50 < MA200 → Sell.
Coding the Strategy
Program in Python, C++, R, or a broker’s native scripting language.
Backtesting
Run the algorithm on historical data to see how it would have performed.
Paper Trading (Simulation)
Trade in real time with virtual money to test live conditions.
Execution in Live Markets
Deploy with real money, connected to exchange APIs.
Monitoring & Optimization
Adjust based on performance, slippage, and market changes.
2.1 Example of a Simple Algorithm
Pseudocode:
sql
Copy
Edit
If Close Price today > 20-day Moving Average:
Buy 10 units
If Close Price today < 20-day Moving Average:
Sell all units
The computer checks the rule every day (or every minute, or millisecond, depending on design).
3. Types of Algorithmic Trading Strategies
Algo trading is not one-size-fits-all. Traders and funds design algorithms based on their objectives, timeframes, and risk appetite.
3.1 Trend-Following Strategies
Logic: “The trend is your friend.”
Tools: Moving Averages, MACD, Donchian Channels.
Example: Buy when short-term average crosses above long-term average.
Pros: Simple, works in trending markets.
Cons: Suffers in sideways/choppy markets.
3.2 Mean Reversion Strategies
Logic: Prices eventually revert to their mean (average).
Tools: Bollinger Bands, RSI, z-score.
Example: If stock falls 2% below its 20-day average, buy expecting a bounce.
Pros: Works well in range-bound markets.
Cons: Can blow up if the “mean” shifts due to fundamental changes.
3.3 Statistical Arbitrage
Logic: Exploit price inefficiencies between correlated assets.
Example: If Reliance and TCS usually move together but Reliance lags by 1%, buy Reliance and short TCS expecting convergence.
Pros: Market-neutral, less affected by overall market trend.
Cons: Requires high-frequency execution and deep statistical modeling.
3.4 Market-Making Algorithms
Logic: Provide liquidity by continuously posting buy and sell quotes.
Goal: Earn the bid-ask spread repeatedly.
Risk: Adverse selection during sharp market moves.
3.5 Momentum Strategies
Logic: Stocks that move strongly in one direction will continue.
Tools: Breakouts, Volume Surges.
Example: Buy when price breaks a 50-day high with high volume.
3.6 High-Frequency Trading (HFT)
Executes in microseconds.
Focuses on ultra-short-term inefficiencies.
Requires co-location servers near exchanges for speed advantage.
3.7 Event-Driven Algorithms
React to corporate actions or news:
Earnings releases
Mergers & acquisitions
Dividend announcements
Often combined with natural language processing (NLP) to scan news feeds.
4. Technologies Behind Algo Trading
4.1 Programming Languages
Python – Most popular for beginners & research.
C++ – Preferred for HFT due to speed.
Java – Stable for large trading systems.
R – Strong in statistical modeling.
4.2 Data
Historical Data – For backtesting.
Real-Time Data – For live execution.
Level 2/Order Book Data – For order flow analysis.
4.3 APIs & Broker Platforms
REST APIs – Easy to use but slightly slower.
WebSocket APIs – Low latency, real-time streaming.
FIX Protocol – Industry standard for institutional trading.
4.4 Infrastructure
Cloud Hosting – AWS, Google Cloud.
Dedicated Servers – For low latency.
Co-location – Servers physically near exchange data centers.
5. Advantages of Algorithmic Trading
Speed – Executes in microseconds.
Accuracy – Removes manual entry errors.
Backtesting – Test before risking real money.
Consistency – No emotional bias.
Multi-Market Trading – Monitor dozens of assets simultaneously.
Scalability – Once built, can trade large portfolios.
6. Risks & Challenges in Algo Trading
6.1 Market Risks
Model Overfitting: Works perfectly on past data but fails live.
Regime Changes: Strategies die when market structure shifts.
6.2 Technical Risks
Connectivity Issues
Data Feed Errors
Exchange Downtime
6.3 Execution Risks
Slippage – Orders filled at worse prices due to latency.
Front Running – Competitors' algorithms act faster.
6.4 Regulatory Risks
Many countries have strict algo trading regulations:
SEBI in India requires pre-approval for certain algos.
SEC & FINRA in the US enforce strict monitoring.
7. Backtesting & Optimization
7.1 Steps for Backtesting
Choose historical data range.
Apply your strategy rules.
Measure key metrics:
CAGR (Compound Annual Growth Rate)
Sharpe Ratio
Max Drawdown
Win/Loss Ratio
7.2 Common Pitfalls
Look-Ahead Bias: Using future data unknowingly.
Survivorship Bias: Ignoring stocks that delisted.
Over-Optimization: Tweaking too much to fit past data.
8. Case Study – Moving Average Crossover Algo
Imagine we test a 50-day vs 200-day MA crossover strategy on NIFTY 50 from 2010–2025.
Capital: ₹10,00,000
Buy Rule: MA50 > MA200 → Buy
Sell Rule: MA50 < MA200 → Sell
Results:
CAGR: 11.2%
Max Drawdown: 18%
Trades: 42 over 15 years
Win Rate: 57%
Conclusion: Low trading frequency, steady returns, low drawdown — suitable for positional traders.
Final Thoughts
Algorithmic trading is not a magic money machine — it’s a discipline that combines mathematics, programming, and market knowledge.
When done right, it can offer speed, precision, and scalability far beyond human capability.
When done wrong, it can cause lightning-fast losses.
The game has evolved from shouting in the trading pit to coding in Python. The traders who adapt, learn, and innovate will keep winning — whether they sit in a Wall Street skyscraper or a small home office in Mumbai.
Crypto Trading & Blockchain Assets 1. Introduction
Cryptocurrencies and blockchain-based assets have revolutionized how we think about money, finance, and even ownership itself. From Bitcoin's birth in 2009 to the explosion of decentralized finance (DeFi), non-fungible tokens (NFTs), and tokenized real-world assets (RWA), the digital asset market has evolved into a multi-trillion-dollar ecosystem.
But unlike traditional markets, crypto operates 24/7, globally, and with high volatility — which means enormous opportunities and equally significant risks for traders.
In this guide, we’ll explore:
The fundamentals of blockchain technology
Types of blockchain assets
Trading styles, tools, and strategies for crypto
Risk management and psychology
The future outlook of blockchain-based markets
2. Understanding Blockchain Technology
2.1 What is Blockchain?
A blockchain is a distributed, immutable ledger that records transactions across multiple computers in a secure and transparent way. Instead of relying on a single authority like a bank, blockchains are decentralized — no single entity can control or alter the record without consensus.
Key features:
Decentralization – No central authority; control is distributed.
Transparency – Anyone can verify transactions.
Immutability – Once recorded, data can’t be altered without consensus.
Security – Cryptographic encryption ensures safety.
2.2 Types of Blockchains
Public Blockchains – Fully decentralized, open to anyone (e.g., Bitcoin, Ethereum).
Private Blockchains – Restricted access, controlled by a single entity (used in enterprises).
Consortium Blockchains – Controlled by a group of organizations (e.g., supply chain consortia).
Hybrid Blockchains – Combine public transparency with private access controls.
2.3 How Blockchain Enables Crypto Assets
Every blockchain asset — from Bitcoin to NFTs — is essentially a tokenized record on the blockchain. Ownership is proved via private keys (digital signatures) and transactions are verified by consensus mechanisms like:
Proof of Work (PoW) – Mining for Bitcoin.
Proof of Stake (PoS) – Validators stake coins to secure networks (e.g., Ethereum after the Merge).
Delegated Proof of Stake (DPoS) – Voting-based validator system.
3. Types of Blockchain Assets
Blockchain assets fall into several categories, each with unique characteristics:
3.1 Cryptocurrencies
These are digital currencies designed as mediums of exchange.
Examples: Bitcoin (BTC), Litecoin (LTC), Monero (XMR)
Use cases: Payments, remittances, store of value.
3.2 Utility Tokens
Tokens that provide access to a blockchain-based product or service.
Examples: Ethereum (ETH) for gas fees, Chainlink (LINK) for oracle services.
Use cases: Network participation, voting rights, service payments.
3.3 Security Tokens
Blockchain versions of traditional securities like stocks or bonds.
Examples: Tokenized equity shares.
Use cases: Investment with regulatory oversight.
3.4 Stablecoins
Cryptocurrencies pegged to fiat currencies or commodities.
Examples: USDT (Tether), USDC, DAI.
Use cases: Price stability for trading, cross-border transfers.
3.5 NFTs (Non-Fungible Tokens)
Unique digital assets that represent ownership of a specific item.
Examples: Bored Ape Yacht Club, CryptoPunks.
Use cases: Digital art, gaming, collectibles, tokenized property.
3.6 Tokenized Real-World Assets (RWA)
Physical assets represented on blockchain.
Examples: Tokenized gold (PAXG), tokenized real estate.
Use cases: Fractional ownership, liquidity for traditionally illiquid assets.
4. Crypto Trading Basics
4.1 How Crypto Markets Differ from Traditional Markets
24/7 Trading – No closing bell; markets are always active.
High Volatility – Double-digit daily price swings are common.
Global Participation – No national barriers; traders from anywhere can join.
No Central Exchange – Assets can be traded on centralized exchanges (CEXs) or decentralized exchanges (DEXs).
4.2 Major Crypto Exchanges
Centralized (CEX): Binance, Coinbase, Kraken, Bybit.
Decentralized (DEX): Uniswap, PancakeSwap, Curve Finance.
4.3 Crypto Trading Pairs
Assets are traded in pairs:
Crypto-to-Crypto: BTC/ETH, ETH/SOL
Crypto-to-Fiat: BTC/USD, ETH/USDT
5. Types of Crypto Trading
5.1 Spot Trading
Buying and selling actual crypto assets with immediate settlement.
5.2 Margin Trading
Borrowing funds to increase position size. Increases both profit potential and risk.
5.3 Futures & Perpetual Contracts
Betting on price movement without owning the asset. Allows leverage and short selling.
5.4 Options Trading
Trading contracts that give the right, but not the obligation, to buy/sell crypto.
5.5 Arbitrage Trading
Exploiting price differences between exchanges.
5.6 Algorithmic & Bot Trading
Using automated scripts to trade based on set rules.
6. Crypto Trading Strategies
6.1 Day Trading
Short-term trades executed within the same day, exploiting volatility.
6.2 Swing Trading
Holding positions for days or weeks to capture intermediate trends.
6.3 Scalping
Making dozens of trades per day for small profits.
6.4 Trend Following
Riding long-term upward or downward price movements.
6.5 Breakout Trading
Entering trades when price breaks a significant support or resistance level.
6.6 Mean Reversion
Betting that prices will return to historical averages.
7. Technical Analysis for Crypto
7.1 Popular Indicators
Moving Averages (MA)
Relative Strength Index (RSI)
MACD
Bollinger Bands
Fibonacci Retracements
Volume Profile
7.2 Chart Patterns
Bullish: Cup & Handle, Ascending Triangle
Bearish: Head & Shoulders, Descending Triangle
Continuation: Flags, Pennants
8. Fundamental Analysis for Blockchain Assets
8.1 Key Metrics
Market Cap
Circulating Supply
Tokenomics
Development Activity
Adoption & Partnerships
On-chain Metrics – Wallet addresses, transaction count, TVL in DeFi.
8.2 Events Impacting Prices
Protocol upgrades (Ethereum Merge, Bitcoin Halving)
Regulatory announcements
Exchange listings
Partnership news
9. Risk Management in Crypto Trading
9.1 Position Sizing
Risk only 1–2% of your portfolio per trade.
9.2 Stop Loss & Take Profit
Pre-define exit points to avoid emotional decisions.
9.3 Diversification
Spread investments across multiple coins and sectors.
9.4 Avoid Overleveraging
Leverage amplifies both gains and losses.
10. Trading Psychology in Crypto
Discipline over Emotion
Patience in Volatile Markets
Avoiding FOMO and Panic Selling
Sticking to Your Plan
Conclusion
Crypto trading and blockchain assets represent a paradigm shift in finance, offering unmatched transparency, security, and accessibility. For traders, the opportunities are massive — but so are the risks. Success in this space requires knowledge, discipline, and adaptability.
The market will continue to evolve, blending traditional finance with decentralized innovations, and traders who master both the technology and trading discipline will thrive.

Options Trading Strategies 1. Introduction to Options Trading Strategies
Options are like the “Swiss army knife” of the financial markets — flexible tools that can be shaped to fit bullish, bearish, neutral, or volatile market views. They’re contracts that give you the right, but not the obligation, to buy or sell an asset at a specific price (strike) on or before a certain date (expiry).
While most beginners think options are just for making huge leveraged bets, seasoned traders use strategies — combinations of buying and selling calls and puts — to control risk, generate income, or hedge portfolios.
2. Why Use Strategies Instead of Simple Buy/Sell?
Risk Management: You can cap your losses while keeping upside potential.
Income Generation: Strategies like covered calls and credit spreads generate consistent cash flow.
Direction Neutrality: You can profit even when the market moves sideways.
Volatility Play: You can design trades to profit from expected volatility spikes or drops.
Hedging: Protect stock holdings against adverse moves.
3. The Four Building Blocks of All Strategies
Every complex strategy is built using these four basic positions:
Type Action View Risk Reward
Long Call Buy Bullish Premium Unlimited
Short Call Sell Bearish Unlimited Premium
Long Put Buy Bearish Premium High (to zero)
Short Put Sell Bullish High (to zero) Premium
Once you understand these, combining them is like mixing ingredients to cook different recipes.
4. Categories of Options Strategies
Directional Strategies – Profit from a clear bullish or bearish bias.
Neutral Strategies – Profit from time decay or volatility drops.
Volatility-Based Strategies – Profit from big moves or volatility increases.
Hedging Strategies – Reduce risk on existing positions.
5. Directional Strategies
5.1. Bullish Strategies
These make money when the underlying price rises.
5.1.1 Long Call
Setup: Buy 1 Call
When to Use: Expect sharp upside.
Risk: Limited to premium paid.
Reward: Unlimited.
Example: Nifty at 22,000, buy 22,200 Call for ₹150. If Nifty rises to 22,500, option might be worth ₹300+, doubling your investment.
5.1.2 Bull Call Spread
Setup: Buy 1 ITM/ATM Call + Sell 1 higher strike Call.
Purpose: Lower cost vs. long call.
Risk: Limited to net premium paid.
Reward: Limited to difference between strikes minus premium.
Example: Buy 22,000 Call for ₹200, Sell 22,500 Call for ₹80 → Net cost ₹120. Max profit ₹380 (if Nifty at or above 22,500).
5.1.3 Bull Put Spread (Credit Spread)
Setup: Sell 1 higher strike Put + Buy 1 lower strike Put.
Purpose: Earn premium in bullish to neutral markets.
Risk: Limited to spread width minus premium.
Example: Sell 22,000 Put ₹200, Buy 21,800 Put ₹100 → Credit ₹100.
5.2 Bearish Strategies
These make money when the underlying price falls.
5.2.1 Long Put
Setup: Buy 1 Put.
When to Use: Expect sharp downside.
Risk: Limited to premium paid.
Reward: Large, until stock hits zero.
5.2.2 Bear Put Spread
Setup: Buy 1 higher strike Put + Sell 1 lower strike Put.
Purpose: Cheaper than long put, defined profit range.
Example: Buy 22,000 Put ₹180, Sell 21,800 Put ₹90 → Cost ₹90, Max profit ₹110.
5.2.3 Bear Call Spread
Setup: Sell 1 lower strike Call + Buy 1 higher strike Call.
Purpose: Profit from flat or falling markets.
Example: Sell 22,000 Call ₹250, Buy 22,200 Call ₹150 → Credit ₹100.
6. Neutral Strategies (Time Decay Focus)
These aim to profit if the underlying price stays within a range.
6.1 Iron Condor
Setup: Combine bull put spread and bear call spread.
Goal: Earn premium in range-bound market.
Example: Nifty 22,000 — Sell 21,800 Put, Buy 21,600 Put, Sell 22,200 Call, Buy 22,400 Call.
6.2 Iron Butterfly
Setup: Sell ATM call & put, buy OTM call & put.
Goal: Higher reward, but smaller profit range.
6.3 Short Straddle
Setup: Sell ATM call & put.
Goal: Collect max premium if price stays at strike.
Risk: Unlimited both sides.
6.4 Short Strangle
Setup: Sell OTM call & put.
Goal: Lower premium but wider safety zone.
7. Volatility-Based Strategies
These profit from big moves or volatility changes.
7.1 Long Straddle
Setup: Buy ATM call & put.
Goal: Profit if price moves big in either direction.
When to Use: Pre-event (earnings, budget).
Risk: Premium paid.
7.2 Long Strangle
Setup: Buy OTM call & put.
Cheaper than straddle, needs bigger move.
7.3 Calendar Spread
Setup: Sell near-term option, buy longer-term option (same strike).
Goal: Profit from time decay in short leg & volatility rise.
7.4 Ratio Spreads
Setup: Buy one option, sell more of same type further OTM.
Goal: Take advantage of moderate moves.
8. Hedging Strategies
These protect existing positions.
8.1 Protective Put
Hold stock + Buy Put.
Acts like insurance against downside.
8.2 Covered Call
Hold stock + Sell Call.
Generate income while capping upside.
8.3 Collar
Hold stock + Buy Put + Sell Call.
Limits both upside and downside.
Conclusion
Options trading strategies are not about gambling — they are risk engineering tools. Whether you aim to hedge, speculate, or earn income, you can design a strategy tailored to market conditions. The key is understanding your market view, volatility environment, and risk appetite — and then matching it with the right combination of calls and puts.
Mastering them is like mastering chess: the rules are simple, but winning requires foresight, discipline, and adaptability.
Part1 Ride The Big Moves Types of Option Traders
1. Speculators
They aim to profit from market direction using options. Their goal is capital gain.
2. Hedgers
They use options to protect investments from unfavorable price movements.
3. Income Traders
They sell options to earn premium income.
Option Trading Strategies
1. Basic Strategies
A. Buying Calls (Bullish)
Used when you expect the stock to rise.
B. Buying Puts (Bearish)
Used when expecting a stock to fall.
C. Covered Call (Neutral to Bullish)
Own the stock and sell a call option. Earn premium while holding the stock.
D. Protective Put (Insurance)
Own the stock and buy a put option to limit losses.

Part11 Trading Masterclass How Options Work
Let’s break this down with an example.
Call Option Example:
You buy a call option on Stock A with a strike price of ₹100, paying a premium of ₹5. If the stock price rises to ₹120, you can buy it for ₹100 and sell it for ₹120—earning a ₹20 profit per share, minus the ₹5 premium, netting ₹15.
If the stock stays below ₹100, you simply let the option expire. Your loss is limited to the ₹5 premium.
Put Option Example:
You buy a put option on Stock A with a strike price of ₹100, paying a ₹5 premium. If the stock falls to ₹80, you can sell it for ₹100—earning ₹20, minus ₹5 premium = ₹15 profit.
If the stock stays above ₹100, the option expires worthless. Again, your loss is limited to ₹5.
Why Trade Options?
A. Leverage
Options require a smaller initial investment compared to buying stocks, but they can offer significant returns.
B. Risk Management (Hedging)
Options can hedge against downside risk. For example, if you own shares, buying a put option can protect you against losses if the price falls.
C. Income Generation
Writing (selling) options like covered calls can generate consistent income.
D. Strategic Flexibility
You can profit in bullish, bearish, or neutral markets using different strategies.

Part12 Trading Masterclass1. Introduction to Options Trading
Options trading is one of the most powerful tools in financial markets. Unlike traditional stock trading, where you buy and sell shares directly, options give you the right but not the obligation to buy or sell an asset at a predetermined price before a specific date. This flexibility allows traders to hedge risks, generate income, and speculate on price movements with limited capital.
In recent years, options trading has seen a surge in popularity, especially among retail investors. With the growth of online trading platforms and educational resources, more traders are exploring this complex yet rewarding field.
2. What Is an Option?
An option is a financial derivative contract. It derives its value from an underlying asset—commonly a stock, index, ETF, or commodity.
There are two types of options:
Call Option: Gives the holder the right to buy the asset at a fixed price (strike price) before or on the expiry date.
Put Option: Gives the holder the right to sell the asset at a fixed price before or on the expiry date.
Key Terms to Know:
Strike Price: The price at which the option can be exercised.
Premium: The price paid to purchase the option.
Expiration Date: The last date on which the option can be exercised.
Underlying Asset: The financial instrument (like a stock) the option is based on.
In the Money (ITM): When exercising the option would be profitable.
Out of the Money (OTM): When exercising the option would not be profitable.
At the Money (ATM): When the strike price is equal to the market price.

Part4 Institutional Trading Tools & Platforms for Trading Options
Popular Brokers in India:
Zerodha
Upstox
Angel One
Groww
ICICI Direct
Option Analysis Tools:
Sensibull
Opstra
QuantsApp
TradingView (for charting)
NSE Option Chain (for open interest and IV analysis)
Important Metrics in Option Trading
1. Open Interest (OI):
Indicates how many contracts are active. Rising OI with price = strength.
2. Implied Volatility (IV):
Represents market expectation of volatility. High IV = expensive options.
3. Option Chain Analysis:
Used to find support, resistance, and market bias using OI and IV.

Part3 Institutional TradingThe Greeks: Measuring Risk
Options prices are sensitive to many factors. The "Greeks" are key metrics to assess these risks.
1. Delta
Measures the change in option price with respect to the underlying asset’s price.
Call delta ranges from 0 to 1.
Put delta ranges from -1 to 0.
2. Gamma
Measures the rate of change of delta. Important for managing large price swings.
3. Theta
Measures time decay. As expiry approaches, the option loses value (especially OTM options).
4. Vega
Measures sensitivity to volatility. Higher volatility = higher premium.
5. Rho
Measures sensitivity to interest rate changes.
Options Expiry & Settlement
In Indian markets (like NSE), stock options are European-style, meaning they can only be exercised on the expiration date. Index options are cash-settled.
Options expire on the last Thursday of every month (weekly options on Thursday each week). After expiry, worthless options are removed from your account.

Part11 Trading MasterclassTypes of Option Traders
1. Speculators
They aim to profit from market direction using options. Their goal is capital gain.
2. Hedgers
They use options to protect investments from unfavorable price movements.
3. Income Traders
They sell options to earn premium income.
Option Trading Strategies
1. Basic Strategies
A. Buying Calls (Bullish)
Used when you expect the stock to rise.
B. Buying Puts (Bearish)
Used when expecting a stock to fall.
C. Covered Call (Neutral to Bullish)
Own the stock and sell a call option. Earn premium while holding the stock.
D. Protective Put (Insurance)
Own the stock and buy a put option to limit losses.
2. Intermediate Strategies
A. Vertical Spreads
Buying and selling options of the same type (call or put) with different strike prices.
Bull Call Spread: Buy a lower strike call, sell a higher strike call.
Bear Put Spread: Buy a higher strike put, sell a lower strike put.
B. Iron Condor (Neutral)
Sell OTM put and call options, buy further OTM put and call to limit risk. Profit if the stock stays within a range.
C. Straddle (Volatility)
Buy a call and a put at the same strike price. Profits from big price movement in either direction.

Part9 Trading MasterclassHow Options Work
Let’s break this down with an example.
Call Option Example:
You buy a call option on Stock A with a strike price of ₹100, paying a premium of ₹5. If the stock price rises to ₹120, you can buy it for ₹100 and sell it for ₹120—earning a ₹20 profit per share, minus the ₹5 premium, netting ₹15.
If the stock stays below ₹100, you simply let the option expire. Your loss is limited to the ₹5 premium.
Put Option Example:
You buy a put option on Stock A with a strike price of ₹100, paying a ₹5 premium. If the stock falls to ₹80, you can sell it for ₹100—earning ₹20, minus ₹5 premium = ₹15 profit.
If the stock stays above ₹100, the option expires worthless. Again, your loss is limited to ₹5.
Why Trade Options?
A. Leverage
Options require a smaller initial investment compared to buying stocks, but they can offer significant returns.
B. Risk Management (Hedging)
Options can hedge against downside risk. For example, if you own shares, buying a put option can protect you against losses if the price falls.
C. Income Generation
Writing (selling) options like covered calls can generate consistent income.
D. Strategic Flexibility
You can profit in bullish, bearish, or neutral markets using different strategies.

Part12 Trading MasterclassIntroduction to Options Trading
Options trading is one of the most powerful tools in financial markets. Unlike traditional stock trading, where you buy and sell shares directly, options give you the right but not the obligation to buy or sell an asset at a predetermined price before a specific date. This flexibility allows traders to hedge risks, generate income, and speculate on price movements with limited capital.
In recent years, options trading has seen a surge in popularity, especially among retail investors. With the growth of online trading platforms and educational resources, more traders are exploring this complex yet rewarding field.
What Is an Option?
An option is a financial derivative contract. It derives its value from an underlying asset—commonly a stock, index, ETF, or commodity.
There are two types of options:
Call Option: Gives the holder the right to buy the asset at a fixed price (strike price) before or on the expiry date.
Put Option: Gives the holder the right to sell the asset at a fixed price before or on the expiry date.
Key Terms to Know:
Strike Price: The price at which the option can be exercised.
Premium: The price paid to purchase the option.
Expiration Date: The last date on which the option can be exercised.
Underlying Asset: The financial instrument (like a stock) the option is based on.
In the Money (ITM): When exercising the option would be profitable.
Out of the Money (OTM): When exercising the option would not be profitable.
At the Money (ATM): When the strike price is equal to the market price.

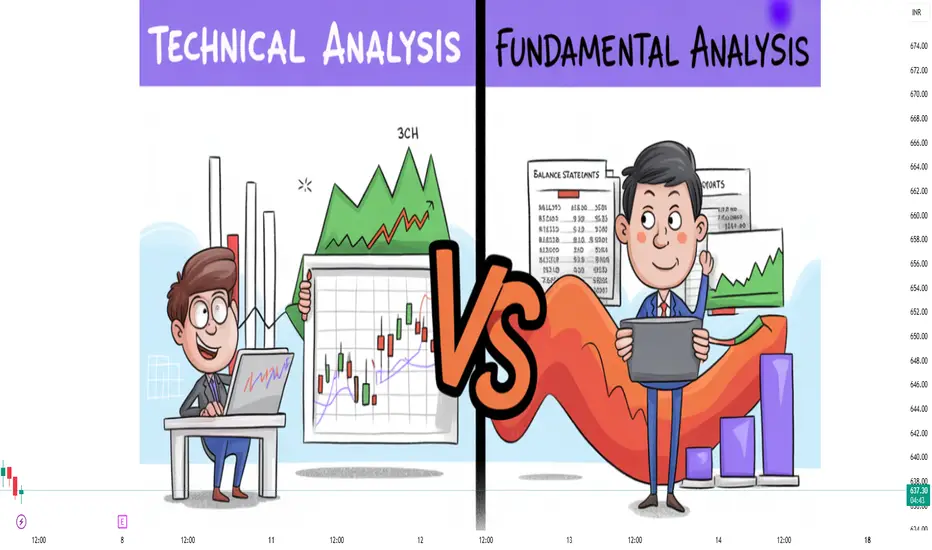
Technical Analysis vs Fundamental AnalysisIntroduction
In the world of trading and investing, two dominant schools of thought guide decision-making: technical analysis and fundamental analysis. Both methodologies aim to forecast future price movements, but they differ significantly in philosophy, approach, tools, and time horizons.
This detailed article offers a side-by-side comparison of technical and fundamental analysis, exploring their foundations, tools, advantages, limitations, and how modern traders often use a hybrid approach to gain an edge in the markets.
1. Definition and Core Philosophy
Technical Analysis (TA)
Definition: Technical analysis is the study of past market data—primarily price and volume—to forecast future price movements.
Philosophy:
All known information is already reflected in the price.
Prices move in trends.
History tends to repeat itself.
TA focuses on identifying patterns and signals within charts and market data to predict price action, independent of the company’s fundamentals.
Fundamental Analysis (FA)
Definition: Fundamental analysis involves evaluating a security's intrinsic value by examining related economic, financial, and qualitative factors.
Philosophy:
Every asset has an inherent (fair) value.
Market prices may deviate from intrinsic value in the short term but will eventually correct.
Long-term returns are driven by the health and performance of the underlying asset.
FA dives into financial statements, management quality, industry dynamics, macroeconomic factors, and more to decide if a security is overvalued or undervalued.
2. Key Objectives
Aspect Technical Analysis Fundamental Analysis
Primary Goal Predict short-to-medium term price moves Assess long-term value and growth potential
Trader Focus Entry and exit timing Business quality, profitability
Time Horizon Short-term (minutes to weeks) Medium to long-term (months to years)
3. Tools and Techniques
Technical Analysis Tools
Price Charts: Line, bar, and candlestick charts
Indicators & Oscillators:
Moving Averages (MA)
Relative Strength Index (RSI)
MACD (Moving Average Convergence Divergence)
Bollinger Bands
Stochastic Oscillator
Chart Patterns:
Head and Shoulders
Double Top/Bottom
Triangles (ascending, descending)
Flags and Pennants
Volume Analysis: Analyzing the strength of price movements
Support and Resistance Levels
Trend Lines and Channels
Price Action & Candlestick Patterns:
Doji
Hammer
Engulfing patterns
Fundamental Analysis Tools
Financial Statements:
Income Statement
Balance Sheet
Cash Flow Statement
Financial Ratios:
P/E (Price to Earnings)
P/B (Price to Book)
ROE (Return on Equity)
Current Ratio
Debt to Equity
Earnings Reports
Economic Indicators:
GDP growth
Inflation
Interest rates
Employment data
Industry & Competitive Analysis
Management Evaluation
Valuation Models:
Discounted Cash Flow (DCF)
Dividend Discount Model (DDM)
Residual Income Model
4. Approach to Market Behavior
Technical Analysts Believe:
Market psychology drives price patterns.
Prices reflect supply and demand, fear and greed.
“The trend is your friend.”
Fundamental Analysts Believe:
Markets are inefficient in the short run.
Understanding business fundamentals offers a long-term edge.
“Buy undervalued assets and wait for the market to realize their value.”
5. Advantages and Strengths
Advantages of Technical Analysis:
Effective for short-term trading.
Useful across all markets: stocks, forex, crypto, commodities.
Provides clear entry/exit points.
Applicable even when fundamental data is limited or irrelevant (e.g., cryptocurrencies).
Can be automated (quant systems, bots, algo-trading).
Advantages of Fundamental Analysis:
Helps identify long-term investment opportunities.
Backed by real data and financial metrics.
Focus on intrinsic value, reducing speculative risk.
Allows understanding of economic cycles, company health, and competitive advantage.
Strong foundation for value investing and dividend strategies.
6. Limitations and Criticisms
Limitations of Technical Analysis:
Can produce false signals in choppy markets.
Heavily reliant on pattern recognition, which can be subjective.
Assumes past price behavior repeats, which may not always hold.
May lead to overtrading.
Less effective in fundamentally driven markets (e.g., news-based volatility).
Limitations of Fundamental Analysis:
Time-consuming and data-intensive.
Less effective for timing entries/exits.
Assumptions in valuation models can be inaccurate.
Markets can remain irrational longer than a trader can remain solvent.
Difficult to apply in short-term trading scenarios.
7. Use in Different Market Conditions
Market Condition Technical Analysis Fundamental Analysis
Trending Market Very effective (trend following) May be slow to react
Sideways Market Can be misleading (whipsaws) Waits for fundamental triggers
News-Driven Volatilit Less reliable; news invalidates patterns Analyzes long-term implications of the news
Earnings Season High volatility useful for trades Critical time to revalue investments
8. Real-World Examples
Technical Analysis Example:
A trader observes a bullish flag on Reliance Industries’ chart. They enter a long trade expecting a breakout with a defined stop loss below the flag's support. No attention is paid to quarterly results or business updates.
Fundamental Analysis Example:
An investor evaluates Infosys’ fundamentals. Despite a recent dip in price due to market panic, the investor buys after analyzing strong balance sheets, healthy cash flow, and consistent dividends.
9. Types of Traders and Investors
Type Likely to Use
Scalper Purely technical analysis
Day Trader Mostly technical analysis
Swing Trader Technical with some fundamental awareness
Position Trader Blend of both
Investor Mostly fundamental analysis
Quant Trader TA-based systems, machine learning models
10. Integration: The Hybrid Approach
In the modern market landscape, many traders and investors adopt a hybrid approach, combining the strengths of both TA and FA. This dual strategy provides:
Better timing for fundamentally driven trades.
Deeper conviction in technically identified setups.
Risk reduction by filtering out weak stocks fundamentally.
Example: A swing trader scans for technically strong patterns in fundamentally sound stocks. They avoid penny stocks or overly leveraged companies, no matter how bullish the chart looks.
Options Trading1. Introduction to Options Trading
Options trading is one of the most powerful tools in financial markets. Unlike traditional stock trading, where you buy and sell shares directly, options give you the right but not the obligation to buy or sell an asset at a predetermined price before a specific date. This flexibility allows traders to hedge risks, generate income, and speculate on price movements with limited capital.
In recent years, options trading has seen a surge in popularity, especially among retail investors. With the growth of online trading platforms and educational resources, more traders are exploring this complex yet rewarding field.
2. What Is an Option?
An option is a financial derivative contract. It derives its value from an underlying asset—commonly a stock, index, ETF, or commodity.
There are two types of options:
Call Option: Gives the holder the right to buy the asset at a fixed price (strike price) before or on the expiry date.
Put Option: Gives the holder the right to sell the asset at a fixed price before or on the expiry date.
Key Terms to Know:
Strike Price: The price at which the option can be exercised.
Premium: The price paid to purchase the option.
Expiration Date: The last date on which the option can be exercised.
Underlying Asset: The financial instrument (like a stock) the option is based on.
In the Money (ITM): When exercising the option would be profitable.
Out of the Money (OTM): When exercising the option would not be profitable.
At the Money (ATM): When the strike price is equal to the market price.
3. How Options Work
Let’s break this down with an example.
Call Option Example:
You buy a call option on Stock A with a strike price of ₹100, paying a premium of ₹5. If the stock price rises to ₹120, you can buy it for ₹100 and sell it for ₹120—earning a ₹20 profit per share, minus the ₹5 premium, netting ₹15.
If the stock stays below ₹100, you simply let the option expire. Your loss is limited to the ₹5 premium.
Put Option Example:
You buy a put option on Stock A with a strike price of ₹100, paying a ₹5 premium. If the stock falls to ₹80, you can sell it for ₹100—earning ₹20, minus ₹5 premium = ₹15 profit.
If the stock stays above ₹100, the option expires worthless. Again, your loss is limited to ₹5.
4. Why Trade Options?
A. Leverage
Options require a smaller initial investment compared to buying stocks, but they can offer significant returns.
B. Risk Management (Hedging)
Options can hedge against downside risk. For example, if you own shares, buying a put option can protect you against losses if the price falls.
C. Income Generation
Writing (selling) options like covered calls can generate consistent income.
D. Strategic Flexibility
You can profit in bullish, bearish, or neutral markets using different strategies.
5. Types of Option Traders
1. Speculators
They aim to profit from market direction using options. Their goal is capital gain.
2. Hedgers
They use options to protect investments from unfavorable price movements.
3. Income Traders
They sell options to earn premium income.
6. Option Trading Strategies
1. Basic Strategies
A. Buying Calls (Bullish)
Used when you expect the stock to rise.
B. Buying Puts (Bearish)
Used when expecting a stock to fall.
C. Covered Call (Neutral to Bullish)
Own the stock and sell a call option. Earn premium while holding the stock.
D. Protective Put (Insurance)
Own the stock and buy a put option to limit losses.
2. Intermediate Strategies
A. Vertical Spreads
Buying and selling options of the same type (call or put) with different strike prices.
Bull Call Spread: Buy a lower strike call, sell a higher strike call.
Bear Put Spread: Buy a higher strike put, sell a lower strike put.
B. Iron Condor (Neutral)
Sell OTM put and call options, buy further OTM put and call to limit risk. Profit if the stock stays within a range.
C. Straddle (Volatility)
Buy a call and a put at the same strike price. Profits from big price movement in either direction.
7. The Greeks: Measuring Risk
Options prices are sensitive to many factors. The "Greeks" are key metrics to assess these risks.
1. Delta
Measures the change in option price with respect to the underlying asset’s price.
Call delta ranges from 0 to 1.
Put delta ranges from -1 to 0.
2. Gamma
Measures the rate of change of delta. Important for managing large price swings.
3. Theta
Measures time decay. As expiry approaches, the option loses value (especially OTM options).
4. Vega
Measures sensitivity to volatility. Higher volatility = higher premium.
5. Rho
Measures sensitivity to interest rate changes.
8. Options Expiry & Settlement
In Indian markets (like NSE), stock options are European-style, meaning they can only be exercised on the expiration date. Index options are cash-settled.
Options expire on the last Thursday of every month (weekly options on Thursday each week). After expiry, worthless options are removed from your account.
9. Option Trading in India (NSE)
Popular Instruments:
Nifty 50 Options
Bank Nifty Options
Stock Options (like Reliance, HDFC Bank, Infosys)
FINNIFTY, MIDCPNIFTY
Lot Sizes:
Each option contract has a fixed lot size. For example, Nifty has a lot size of 50.
Margins:
If you buy options, you pay only the premium. But selling options requires high margins (due to unlimited risk).
10. Risks in Options Trading
While options are powerful, they carry specific risks:
1. Time Decay (Theta)
OTM options lose value fast as expiry nears.
2. Volatility Crush
A sudden drop in volatility (like post-earnings) can cause option premiums to collapse.
3. Illiquidity
Some stock options may have low volumes, making them harder to exit.
4. Assignment Risk
If you’ve sold options, especially ITM, you may be assigned early (in American-style options).
5. Unlimited Loss for Sellers
Option writers (sellers) face potentially unlimited loss (especially naked calls or puts).
Conclusion: Is Options Trading Right for You?
Options trading offers huge potential for profits, flexibility, and risk management. But it is not gambling—it’s a strategic and disciplined skill.
Start small. Learn the concepts. Practice on paper or use virtual trading apps. Focus on risk first, reward later.
Used correctly, options can transform your trading game. Used poorly, they can wipe out your capital.
Crypto Trading1. Introduction to Crypto Trading
Cryptocurrency trading has revolutionized financial markets. With Bitcoin's debut in 2009 and the rise of altcoins like Ethereum, Solana, and hundreds more, crypto trading has evolved into a multi-trillion-dollar global ecosystem. Unlike traditional stock markets, crypto operates 24/7, offers high volatility, and is accessible to anyone with an internet connection.
Crypto trading involves buying and selling digital currencies via exchanges or decentralized protocols, either to profit from price movements or to hedge other investments. Traders employ a mix of strategies, from scalping and swing trading to arbitrage and algorithmic trading.
2. Understanding Cryptocurrency
Before trading, it's essential to understand what you’re dealing with. A cryptocurrency is a decentralized digital asset that uses cryptography for security and operates on a blockchain — a distributed ledger maintained by a network of computers (nodes).
Types of Crypto Assets
Coins: Native to their blockchain (e.g., Bitcoin, Ethereum).
Tokens: Built on existing blockchains (e.g., Uniswap on Ethereum).
Stablecoins: Pegged to fiat (e.g., USDT, USDC).
Utility Tokens: Used within ecosystems (e.g., BNB on Binance).
Governance Tokens: Give voting rights in decentralized protocols (e.g., AAVE).
NFTs: Non-fungible tokens representing ownership of unique digital items.
3. Centralized vs. Decentralized Exchanges (CEX vs DEX)
Centralized Exchanges (CEX)
These are platforms like Binance, Coinbase, and Kraken where a third party manages funds. They offer:
High liquidity
Advanced tools
Fiat support
Faster trades
Decentralized Exchanges (DEX)
These operate without intermediaries, using smart contracts. Examples: Uniswap, PancakeSwap.
Full user control
No KYC
Permissionless listings
Often lower liquidity
4. Trading Styles in Crypto
Different traders adopt different approaches based on time, capital, and risk tolerance.
Day Trading
Involves entering and exiting trades within the same day.
Requires technical analysis, speed, and discipline.
Swing Trading
Focuses on catching "swings" in price over days or weeks.
Mix of technical and fundamental analysis.
Scalping
High-frequency trades aiming for small profits.
Needs high-volume and low-fee platforms.
Position Trading
Long-term strategy, often lasting months or years.
Driven by fundamentals and macro trends.
Arbitrage Trading
Profit from price discrepancies between platforms or countries.
Algorithmic Trading
Use of bots and scripts to automate strategies.
5. Fundamental Analysis (FA) in Crypto
FA involves evaluating the intrinsic value of a coin or token.
Key FA Metrics
Whitepaper: Project’s mission, technology, use case.
Team: Founders, developers, advisors.
Tokenomics: Supply, emission, burning, utility.
Partnerships: Collaborations with firms or protocols.
On-chain Data: Wallet activity, transaction volume, holder count.
Community: Social presence, developer activity.
6. Technical Analysis (TA) in Crypto
TA involves studying historical price charts and patterns.
Common Tools and Indicators
Support and Resistance: Key price levels where buyers/sellers step in.
Moving Averages (MA): Smooths out price data (e.g., 50MA, 200MA).
RSI (Relative Strength Index): Measures overbought/oversold conditions.
MACD (Moving Average Convergence Divergence): Trend strength and reversals.
Fibonacci Retracement: Identifies retracement levels.
Volume Profile: Shows traded volume at each price level.
7. Popular Cryptocurrencies for Trading
Bitcoin (BTC) – Market leader, most liquid.
Ethereum (ETH) – Smart contract leader.
Binance Coin (BNB) – Utility token for Binance ecosystem.
Solana (SOL) – High-speed blockchain.
Ripple (XRP) – Focused on cross-border payments.
Polygon (MATIC) – Ethereum scaling solution.
Chainlink (LINK) – Oracle service for smart contracts.
Shiba Inu/Dogecoin (SHIB/DOGE) – Meme coins with volatility.
8. Key Platforms and Tools
Exchanges
Binance: Largest global exchange.
Coinbase: Easy for beginners, regulated.
Bybit/OKX/KUCOIN: Derivatives-focused exchanges.
Wallets
Hardware: Ledger, Trezor (cold storage).
Software: MetaMask, Trust Wallet.
Tools
TradingView: Charting and TA.
CoinGecko/CoinMarketCap: Market data.
Glassnode/Santiment: On-chain analysis.
DeFiLlama: TVL and protocol data.
Dextools: For DEX trading insights.
9. Risks in Crypto Trading
Crypto is volatile, and profits aren’t guaranteed. Understanding risk is crucial.
Volatility Risk
Prices can change 10–30% within hours.
Liquidity Risk
Some tokens have low trading volume, causing slippage.
Security Risk
Exchange hacks, phishing, and smart contract exploits.
Regulatory Risk
Lack of regulation means potential bans or changes in law.
Leverage Risk
Using borrowed funds increases gains but magnifies losses.
10. Risk Management Strategies
Position Sizing
Don’t allocate too much to a single trade. Use fixed percentages (e.g., 1–2% of total capital).
Stop-Loss & Take-Profit
Set exit points to manage risk and lock in profits.
Diversification
Spread investments across different coins, sectors, and strategies.
Avoid Emotional Trading
Stick to plans. Don’t FOMO (Fear of Missing Out) or panic sell.
Conclusion
Crypto trading is a high-risk, high-reward arena. It offers unmatched opportunity, but demands discipline, education, and risk control. Whether you're scalping Bitcoin or holding altcoins for long-term gains, success lies in understanding the market, mastering your emotions, and having a structured plan.
The market evolves quickly. Stay informed, test strategies, manage risk, and you can thrive in this dynamic space.
Retail vs Institutional Trading Introduction
The stock market serves as a vast arena where two primary participants operate — retail traders and institutional traders. Both these groups play crucial roles in the financial ecosystem but differ drastically in terms of capital, strategies, access to information, and influence on the market.
Understanding the dynamics between retail and institutional trading is vital for any market participant — whether you're an investor, trader, analyst, or policymaker. This in-depth analysis unpacks the core differences, strategies, advantages, disadvantages, and market impact of both retail and institutional traders.
1. Definition and Key Characteristics
Retail Traders
Retail traders are individual investors who trade in their personal capacity, usually through online brokerage accounts. They use their own capital and typically trade in smaller volumes.
Key characteristics of retail traders:
Trade small positions (1–1000 shares)
Use online brokerages like Zerodha, Robinhood, or E*TRADE
Rely on public news, retail-focused tools, and charts
Often influenced by social media and sentiment
Usually part-time or hobbyist traders
Institutional Traders
Institutional traders trade on behalf of large organizations, such as:
Mutual funds
Hedge funds
Pension funds
Insurance companies
Sovereign wealth funds
Banks and proprietary trading firms
Key characteristics:
Trade large blocks (10,000+ shares)
Access to sophisticated tools, real-time data, and dark pools
Employ quantitative models and professional teams
Long-term investment strategies or high-frequency trading
Can move markets with a single trade
2. Access to Information & Tools
Retail Access
Retail traders are usually last in line when it comes to access:
Get news after it's public
Use delayed or less granular market data
Basic tools (e.g., TradingView, MetaTrader, ThinkOrSwim)
May rely on YouTube, Twitter, Reddit (e.g., r/WallStreetBets)
Institutional Access
Institutions enjoy early and exclusive access:
Bloomberg Terminal, Reuters Eikon, proprietary feeds
Real-time Level II and III market data
Insider connections (e.g., earnings calls, conferences)
AI-powered data analytics and algorithmic models
Conclusion: Institutional traders operate with a significant information edge.
3. Capital and Buying Power
Retail Traders
Typically operate with limited capital — from ₹10,000 to ₹10 lakhs (or more)
Use margin cautiously due to high risks and interest costs
Constrained by capital preservation and risk tolerance
Institutional Traders
Manage hundreds of crores to billions in assets
Use prime brokerages for margin, shorting, and leverage
Can influence market pricing and supply-demand dynamics
Conclusion: Institutions have a massive capital advantage, enabling economies of scale.
4. Market Impact
Retail Traders’ Impact
Minimal direct impact on prices individually
Collectively can drive momentum trades or short squeezes (e.g., GameStop, Adani stocks)
More reactionary than proactive
Institutional Traders’ Impact
Can shift entire sectors or indices with a single reallocation
Often deploy block trades, iceberg orders, and dark pools to mask intent
Central to price discovery and volume
Conclusion: Institutional flow is the dominant force in price action, while retail adds volatility and liquidity.
5. Trading Strategies
Retail Traders' Strategies
Retail traders typically rely on:
Technical Analysis: Candlesticks, RSI, MACD, chart patterns
Swing Trading / Intraday
News-based or Sentiment-based Trading
Options trading with small lots
Copy trading or Telegram tips (not recommended)
Behavioral tendencies:
Fear of missing out (FOMO)
Overtrading
Chasing breakouts or rumors
Institutional Strategies
Institutions use more structured approaches:
Fundamental Analysis: DCF, macro trends, earnings forecasts
Quantitative Trading: Algorithms, statistical arbitrage
Hedging & Risk Modeling
Portfolio Diversification & Rebalancing
High-Frequency Trading (HFT)
Behavioral tendencies:
Discipline over emotion
Regulatory compliance
Portfolio-level thinking, not trade-by-trade
Conclusion: Retail strategies are shorter-term and emotional, while institutional strategies are data-driven and systematic.
6. Cost of Trading
Retail Traders
Pay higher brokerage fees (especially in traditional full-service brokers)
Have wider bid-ask spreads
Face slippage during volatile moves
No access to negotiated commissions
Institutional Traders
Enjoy preferential fee structures
Access lower spreads via direct market access (DMA)
Use smart order routing to reduce costs
May participate in dark pools to hide trade intent
Conclusion: Institutions enjoy cheaper and more efficient execution.
7. Emotional vs Rational Decision-Making
Retail Traders
Highly influenced by emotions: greed, fear, hope
Overreact to headlines and rumors
Lack discipline and trade management
Often trade without stop-loss
Institutional Traders
Decision-making is systematic and risk-managed
Operate with clear mandates, risk teams, and drawdown controls
Use quantitative models to remove human error
Conclusion: Institutions are generally rational and rule-based, while retail is often impulsive.
8. Regulations and Restrictions
Retail Traders
Face basic regulations (e.g., KYC, margin limits)
No oversight in strategy or risk exposure
Limited access to instruments (e.g., no direct access to foreign derivatives or institutional debt)
Institutional Traders
Heavily regulated by bodies like SEBI, RBI, SEC, etc.
Must follow:
Disclosure norms
Risk-based capital adequacy
Audit and compliance checks
Subject to insider trading laws, fiduciary responsibilities
Conclusion: Retail is freer but riskier, institutional is compliant but structured.
9. Education and Skill Levels
Retail Traders
Largely self-taught
Learn via:
YouTube, Udemy, Twitter
Paid telegram groups, mentors
Often lack deep financial literacy
Institutional Traders
Often have backgrounds in:
Finance, Economics, Math, Computer Science
MBAs, CFAs, PhDs
Supported by quant teams, analysts, economists
Conclusion: Institutional traders have stronger academic and experiential grounding.
10. Time Horizon and Holding Period
Retail Traders
Mostly short-term focused: scalping, intraday, swing
Rarely think in portfolio terms
Less concerned with long-term CAGR
Institutional Traders
Long-term focused (mutual funds, pension funds)
Hedge funds may have medium-term or tactical outlook
Often look at multi-year trends, sector rotation, macro cycles
Conclusion: Retail thinks in days or weeks, institutions think in years.
Conclusion
The divide between retail and institutional traders is significant but narrowing. While institutions dominate in terms of capital, technology, and influence, retail traders now have unprecedented access to tools and knowledge.
For success in modern markets:
Retail traders must focus on discipline, risk, and learning
Institutional players must remain agile and avoid herd behavior
Both groups are vital to the health and vibrancy of the financial markets. Understanding the strengths and limitations of each helps investors better navigate today’s complex market landscape.