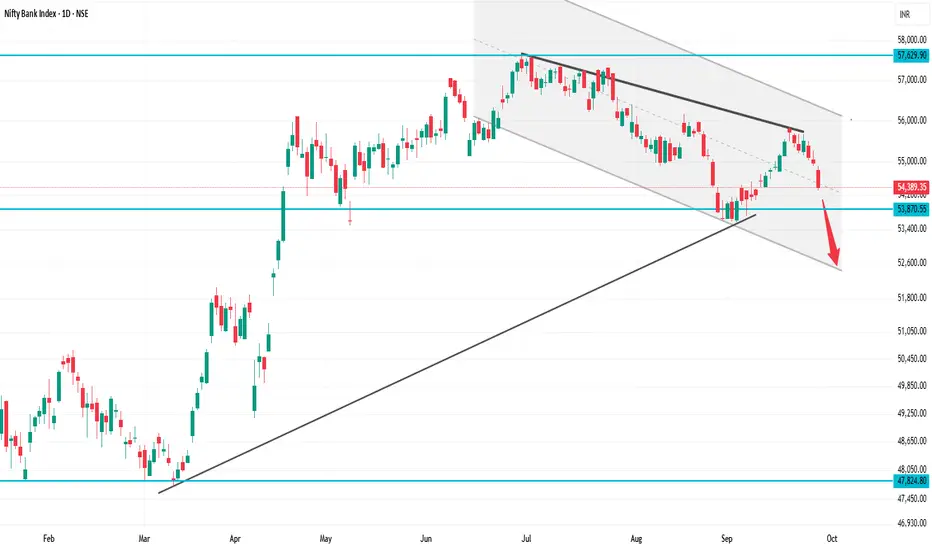
BANKNIFTY 1D Time frame
Previous Close: 55,121
Today Open: 55,061
Day’s High: 55,276
Day’s Low / Last: 54,389
⚡ Strategy
For Intraday / Short-Term Traders:
If BankNIFTY holds above 54,400 – 54,500, a small bounce toward 54,800 – 55,000 is possible.
If it fails to hold 54,400, expect more downside toward 54,000 – 53,800.
Bullish View (Only if recovery): Buy above 54,800 for targets 55,100 – 55,250, SL below 54,500.
Bearish View (Preferred): Sell on rise near 54,700 – 54,900 with SL above 55,000, targets 54,300 → 54,000.
HDFCBANK
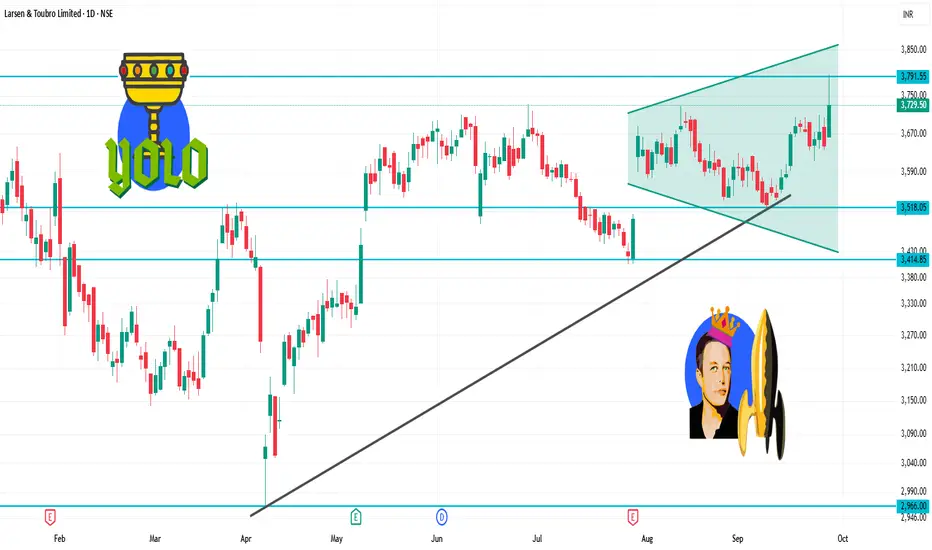
LT 1D Time framePrevious Close: ₹ 3,644
Today Open: ₹ 3,664
Day’s High: ₹ 3,795
Day’s Low: ₹ 3,661
Current / Last Traded Price: around ₹ 3,730
⚡ Strategy
Bullish Side:
Buy on dips near ₹ 3,700 – 3,720 with stop loss below ₹ 3,660. Target ₹ 3,760 → ₹ 3,795.
Bearish Side (Only if Weakness):
If price falls below ₹ 3,660, short opportunities may open toward ₹ 3,600.
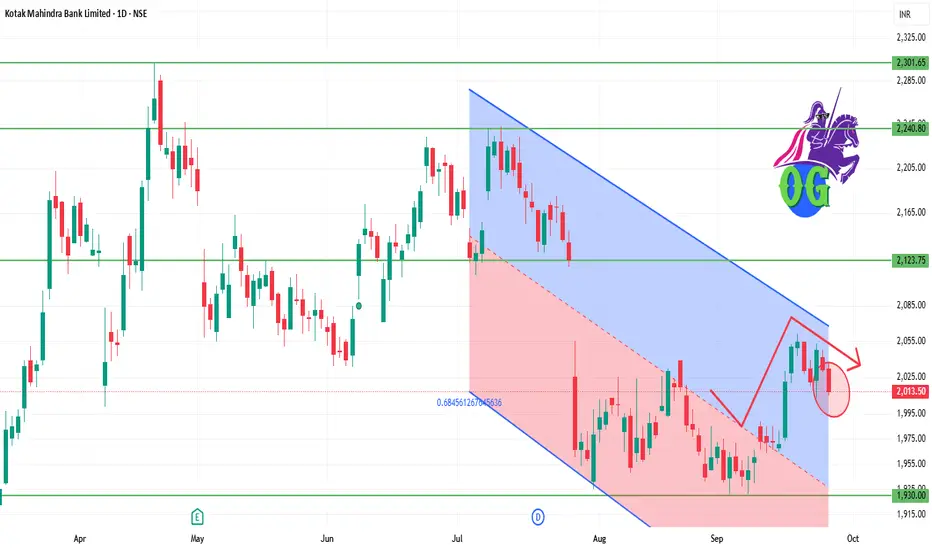
KOTAKBANK 1D Time frame📊 Daily Snapshot
Closing Price: ₹2,013.60
Day’s Range: ₹2,012.50 – ₹2,031.30
Previous Close: ₹2,031.30
Change: Down –0.72%
52-Week Range: ₹1,679.00 – ₹2,302.00
Market Cap: ₹4.04 lakh crore
P/E Ratio: 21.09
Dividend Yield: 0.12%
EPS (TTM): ₹96.30
Beta: 0.80 (indicating lower volatility)
🔑 Key Technical Levels
Immediate Support: ₹2,000.00
Immediate Resistance: ₹2,030.00
All-Time High: ₹2,302.00
📈 Technical Indicators
RSI (14-day): 45.2 – indicating a neutral condition.
MACD: Negative, suggesting bearish momentum.
Moving Averages: Trading below the 50-day and 200-day moving averages, indicating a bearish trend.
📉 Market Sentiment
Recent Performance: Kotak Mahindra Bank's stock declined by 0.72% on September 25, 2025, underperforming the broader market.
Volume: Trading volume was significantly lower than its 50-day average, indicating decreased investor activity.
📈 Strategy (1D Timeframe)
1. Bullish Scenario
Entry: Above ₹2,030.00
Stop-Loss: ₹2,000.00
Target: ₹2,050.00 → ₹2,070.00
2. Bearish Scenario
Entry: Below ₹2,000.00
Stop-Loss: ₹2,030.00
Target: ₹1,980.00 → ₹1,960.00
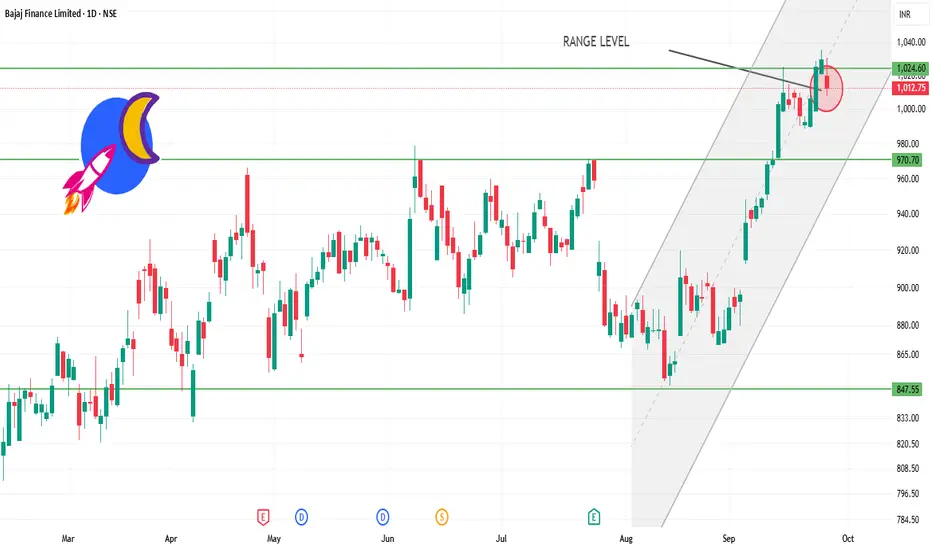
BAJFINANCE 1D time frame📊 Daily Snapshot
Closing Price: ₹1,012.75
Day’s Range: ₹1,008.00 – ₹1,031.10
Previous Close: ₹1,029.75
Change: Down –1.66%
52‑Week Range: ₹645.10 – ₹1,036.00
Market Cap: ₹6.31 lakh crore
P/E Ratio: 36.2
Dividend Yield: 2.76%
EPS (TTM): ₹28.04
Beta: 1.14 (indicating moderate volatility)
🔑 Key Technical Levels
Support Zone: ₹1,008.00 – ₹1,015.00
Resistance Zone: ₹1,031.00 – ₹1,036.00
All-Time High: ₹1,036.00
📈 Technical Indicators
RSI (14-day): 42.88 – approaching oversold territory, suggesting potential for a rebound.
MACD: Positive at 2.46, indicating bullish momentum.
Moving Averages: Trading above the 50-day and 200-day moving averages, indicating an overall uptrend.
📉 Market Sentiment
Recent Performance: Bajaj Finance experienced a decline of 1.66% on September 25, 2025, underperforming the broader market.
Volume: Trading volume was significantly higher than its 50-day average, indicating increased investor activity.
📈 Strategy (1D Timeframe)
1. Bullish Scenario
Entry: Above ₹1,031.00
Stop-Loss: ₹1,008.00
Target: ₹1,045.00 → ₹1,050.00
2. Bearish Scenario
Entry: Below ₹1,008.00
Stop-Loss: ₹1,015.00
Target: ₹995.00 → ₹990.00
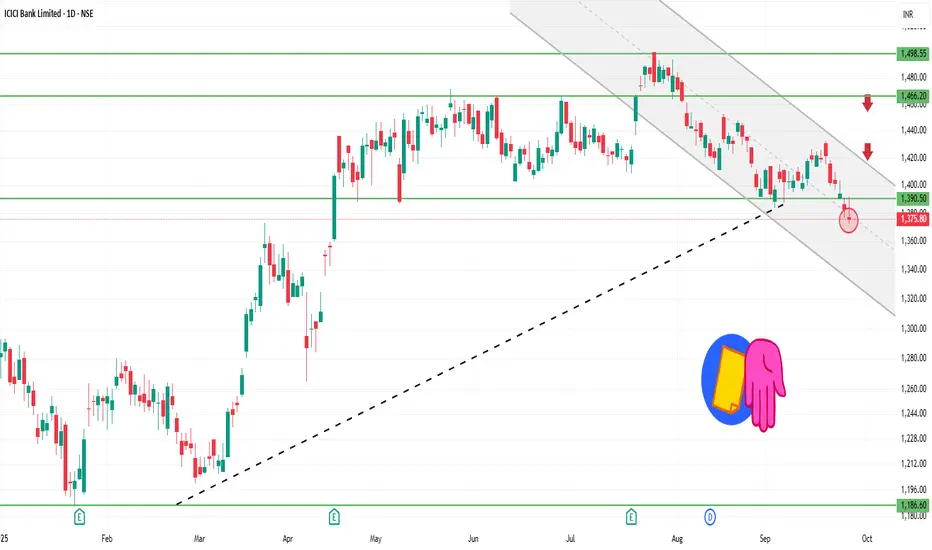
ICICIBANK 1D Time frame📊 Daily Snapshot
Closing Price: ₹1,375.50
Day’s Range: ₹1,371.80 – ₹1,391.50
Previous Close: ₹1,382.70
Change: Down –0.52%
52-Week Range: ₹1,018.85 – ₹1,494.10
Market Cap: ₹9.7 lakh crore
P/E Ratio: 20.5
Dividend Yield: 1.2%
EPS (TTM): ₹67.00
Beta: 1.05 (moderate volatility)
🔑 Key Technical Levels
Support Zone: ₹1,370 – ₹1,375
Resistance Zone: ₹1,390 – ₹1,400
All-Time High: ₹1,494.10
📈 Technical Indicators
RSI (14-day): 34.1 – approaching oversold territory, suggesting potential for a rebound.
MACD: Negative, indicating bearish momentum.
Moving Averages: Trading below the 150-day moving average, indicating a bearish trend.
Candlestick Patterns: Recent formation of a Bearish Engulfing pattern, suggesting potential for further downside.
📉 Market Sentiment
Recent Performance: ICICI Bank has experienced a decline for the fifth consecutive session, underperforming the broader market.
Sector Performance: The NIFTY BANK index also closed lower, reflecting sector-wide weakness.
📈 Strategy (1D Timeframe)
1. Bullish Scenario
Entry: Above ₹1,390
Stop-Loss: ₹1,370
Target: ₹1,405 → ₹1,420
2. Bearish Scenario
Entry: Below ₹1,370
Stop-Loss: ₹1,390
Target: ₹1,355 → ₹1,340
SBIN 1D Time frame📊 Daily Snapshot
Closing Price: ₹861.15
Day’s Range: ₹859.95 – ₹870.15
Previous Close: ₹866.20
Change: Down –0.59%
52-Week Range: ₹680.00 – ₹880.50
Market Cap: ₹794,895 crore
P/E Ratio: 10.01
Dividend Yield: 1.85%
EPS (TTM): ₹86.06
Beta: 1.00 (indicating average market volatility)
🔑 Key Technical Levels
Support Zones: ₹860.00 – ₹854.00 – ₹844.00
Resistance Zones: ₹876.00 – ₹886.00 – ₹892.00
All-Time High: ₹912.00
Fibonacci Pivot Point: ₹865.68
📈 Strategy (1D Timeframe)
1. Bullish Scenario
Entry: Above ₹876.00
Stop-Loss: ₹859.00
Target: ₹886.00 → ₹892.00
2. Bearish Scenario
Entry: Below ₹859.00
Stop-Loss: ₹866.00
Target: ₹854.00 → ₹844.00

MARUTI 1D Time frame📊 Daily Snapshot
Closing Price: ₹16,240
Day’s Range: ₹16,063 – ₹16,375
52‑Week Range: ₹10,725 – ₹16,375
Market Cap: ₹5.1 lakh crore
P/E Ratio: 35.1
Dividend Yield: 0.83%
EPS (TTM): ₹463.5
Beta: 0.88 (lower volatility)
🔑 Key Levels
Support Zone: ₹16,100 – ₹16,150
Resistance Zone: ₹16,300 – ₹16,375
All-Time High: ₹16,375
📈 Strategy (1D Timeframe)
1. Bullish Scenario
Entry: Above ₹16,300
Stop-Loss: ₹16,150
Target: ₹16,500 → ₹16,600
2. Bearish Scenario
Entry: Below ₹16,100
Stop-Loss: ₹16,150
Target: ₹15,900 → ₹15,800

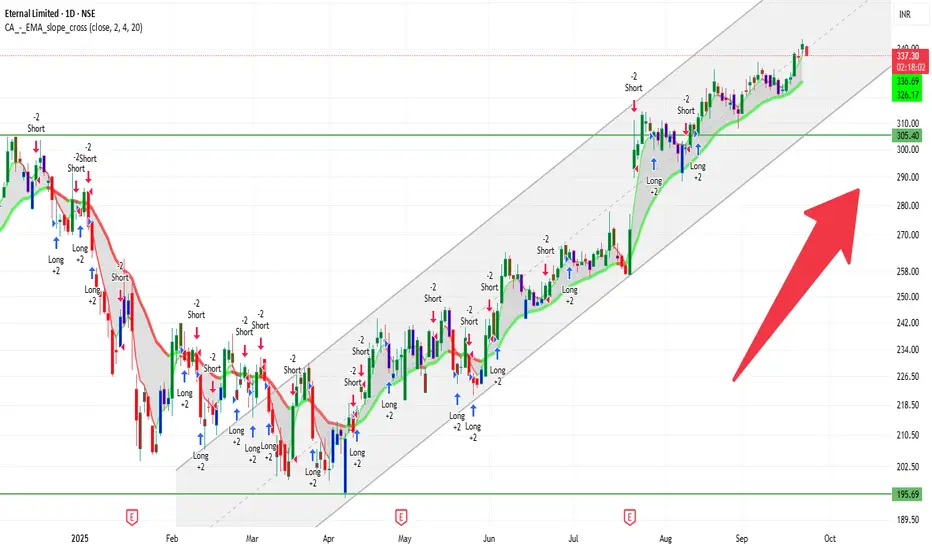
ETERNAL 1D Time frame📍 Today’s Expected Range (Intraday Approximation)
Expected High: ₹341–₹343
Expected Low: ₹336–₹335
These are approximate intraday levels. Actual prices may fluctuate slightly due to volatility.
🔍 Key Points
Current price: ₹337–₹338, trading near the middle of the day’s range.
If price breaks above ₹343 with strong volume → bullish momentum likely.
If price falls below ₹335 → short-term correction or pullback possible.
📊 Suggested Trading Strategy
Bullish Scenario
If Eternal breaks ₹341–₹343, you can buy, targeting ₹348–₹350.
Stop-loss: ₹335
Bearish Scenario
If Eternal drops below ₹335, you can sell/short, targeting ₹330–₹325.
Stop-loss: ₹338
Range-Bound / Sideways
If price trades between ₹335–₹343, it’s better to wait and avoid trading until a clear breakout occurs.
💡 Summary
Resistance Zone: ₹341–₹343
Support Zone: ₹335–₹336
Strategy: Trade in the direction of the breakout, and always use stop-loss to manage risk.
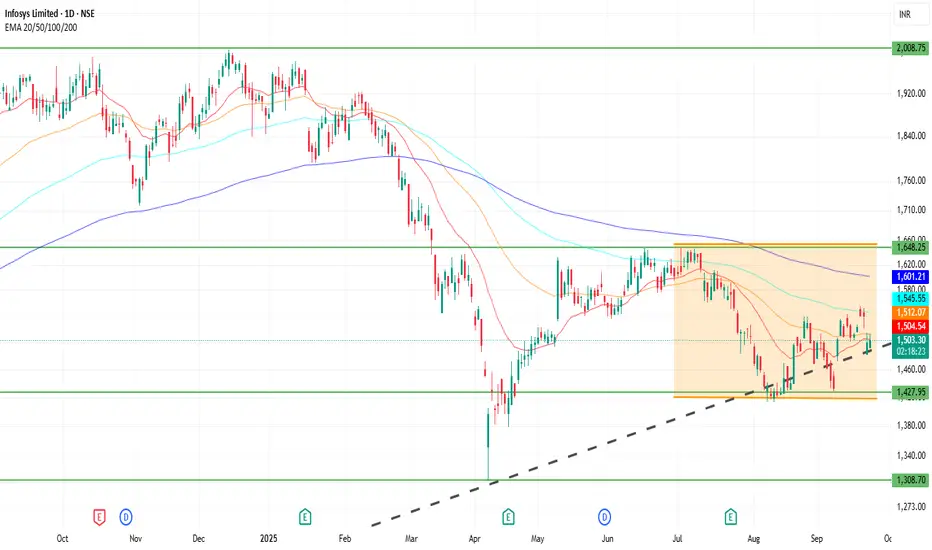
INFY 1D Time frame📍 Current Price & Range
Current Price: ₹1,503.00
Day’s High / Low: ₹1,540.20 / ₹1,499.50
52-week High / Low: ₹2,006.45 / ₹1,307.00
🔍 Key Levels
Immediate Resistance: ₹1,540–₹1,550
Next Resistance: ₹1,600
Immediate Support: ₹1,450–₹1,460
Strong Support: ₹1,400
📊 Indicators & Momentum
Short-term Trend: Neutral to slightly bearish; recent price action shows hesitation near resistance levels.
Volume: Higher-than-average trading volume observed, indicating increased investor interest.
Relative Strength Index (RSI): Approaching overbought territory; caution advised for potential pullbacks.
Moving Averages: Price trading below key moving averages; may act as resistance if price approaches them.
🔮 Possible Scenarios
Bullish Breakout: If INFY sustains above ₹1,550 with strong volume, it could target ₹1,600 and higher levels.
Sideways Consolidation: Price may trade between ₹1,450 and ₹1,550, awaiting a catalyst for direction.
Bearish Reversal: A drop below ₹1,450 could lead to a retest of the 52-week low around ₹1,307.
⚠️ Outlook
At the current level of ₹1,503.00, Infosys is at a critical juncture. A decisive move above ₹1,550 could open up upside potential, while a failure to hold above ₹1,450 may lead to further downside. Monitoring volume and RSI for confirmation is recommended.
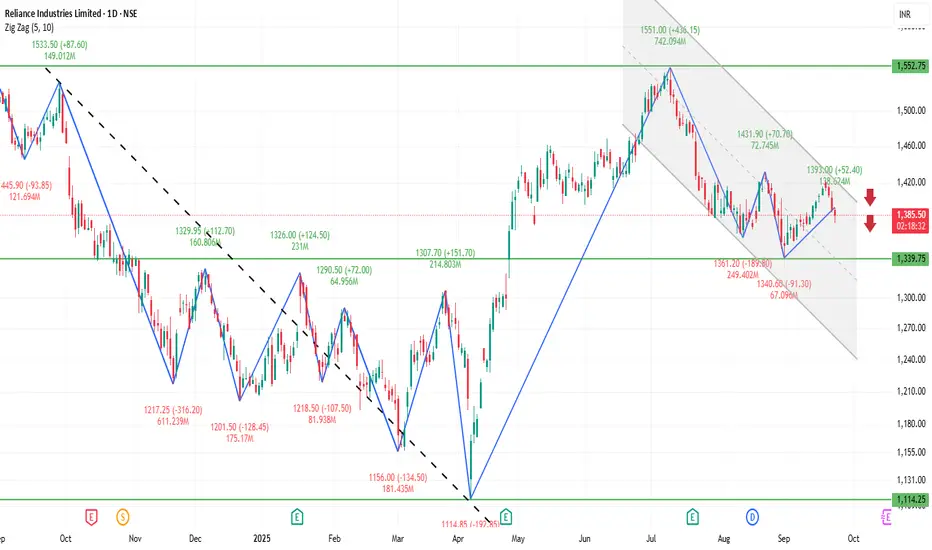
RELIANCE 1D Time frame📍 Current Price Context
Trading around ₹1,386
Price is near a resistance zone → important level to watch.
🔍 Key Levels
Immediate resistance: ₹1,380–₹1,390 (current zone)
Next resistance: ₹1,420–₹1,450 (if breakout happens)
Immediate support: ₹1,350–₹1,360
Stronger support: ₹1,320–₹1,330
📊 Indicators & Trend
Price is just below resistance, so breakout or rejection will decide the move.
RSI near neutral → neither overbought nor oversold.
Structure looks range-bound, but slightly bullish as long as it holds above ₹1,350.
🔮 Possible Scenarios
Bullish breakout → If Reliance sustains above ₹1,390–₹1,400 with volume, next upside target is ₹1,420–₹1,450.
Sideways move → May trade between ₹1,350–₹1,390 until momentum builds.
Bearish pullback → If it fails at resistance, price could slip toward ₹1,350, and if broken, then ₹1,320.
👉 At the current level (₹1,386), Reliance is at a decisive zone. Breakout above ₹1,390 will be bullish, while rejection could send it back to supports.
HDFCBANK 1D Time frame📍 Current Price & Range
Current price: ₹964.20
Day’s High / Low: ₹968.20 / ₹955.50
52-week High / Low: ₹1,018.85 / ₹806.50
🔍 Key Levels (with current context)
Immediate support: ₹955-₹958
Stronger support: ₹945-₹950
Immediate resistance: ₹970-₹975
Next resistance: ₹980-₹985
Major psychological resistance: ₹1,000+
📊 Indicators & Momentum
Price is near resistance zone (₹964-₹967), showing hesitation.
Holding above ₹955 is important for stability.
Price is below the 50-day moving average → short-term weakness.
Still above the 200-day moving average → long-term structure remains intact.
RSI around 40-45 → momentum is neutral to slightly weak.
🔮 Possible Scenarios
Bullish breakout: Above ₹975-₹980 with volume → upside toward ₹1,000–₹1,018.
Sideways: Between ₹955–₹975 until a decisive breakout.
Bearish pullback: Below ₹955 → could slide toward ₹945-₹950 or even ₹940.
👉 Outlook: At the current level (₹964), the stock is sitting close to resistance. It needs strength above ₹975 to turn bullish; otherwise, it risks drifting back toward ₹955 support.

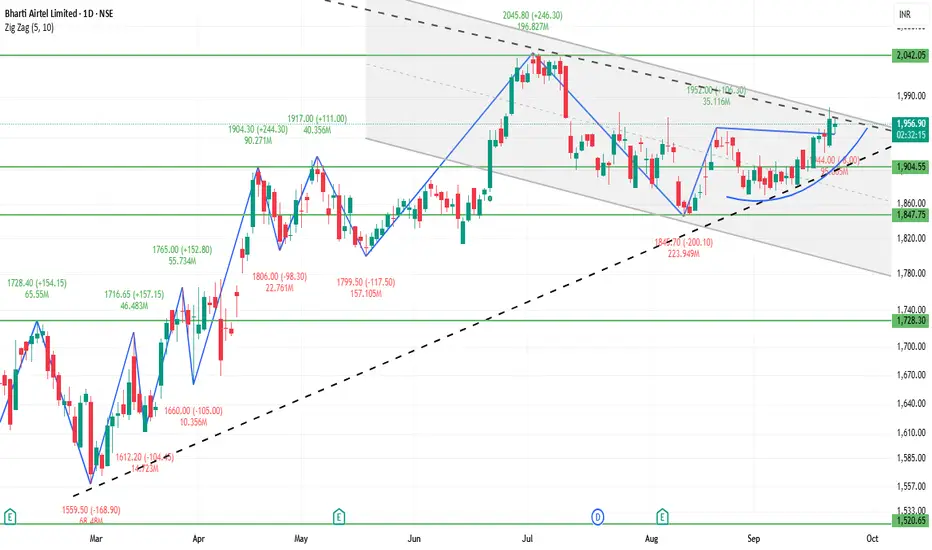
BHARTIARTL 1D Time frame🔍 Current Price & Context
Trading around ₹1,950 – ₹1,960 (approx).
Day’s range recently: low ~ ₹1,944 – ₹1,946, high ~ ₹1,920 – ₹1,925 — showing testing of resistance.
52-week range: low ~ ₹1,510, high ~ ₹2,045.
🧮 Strategy / Trade Ideas
Long Setup:
Entry could be around / just above support zone (₹1,900 – ₹1,895) if there are reversal signals (bullish candles, volume).
Stop loss: slightly below deeper support (~₹1,870 – ₹1,880) to protect against breakdown.
Initial target: resistance around ₹1,920 – ₹1,930. If crossed, then next target near ₹1,950 – ₹1,960.
Short / Pullback Setup:
If price fails to break above resistance (~₹1,920 – ₹1,930) and shows signs of reversal (bearish candle, volume drop).
Target downward to support ~₹1,900, then further to ~₹1,880 – ₹1,870.
Breakout Setup:
If it breaks above ~₹1,950 – ₹1,960 with good volume, then move toward psychological level ~₹2,000 and possibly toward 52-week high (~₹2,045).
✅ Summary
Bharti Airtel in daily chart is showing a mild bullish bias, but the resistance zones (~₹1,920-₹1,930, ₹1,950-₹1,960) are critical. Holding above support around ₹1,900 is important. A clear breakout above resistance could open room for upside; failure to do so may lead to sideways movement or slight downside.
SENSEX 1D Time frame🔍 Current Market Snapshot
Current Level: 82,439.48
Day’s Range: 82,151.07 – 82,583.16
Previous Close: 82,626.23
Market Sentiment: Neutral to mildly bearish
📊 Technical Indicators
Moving Averages: The Sensex is trading slightly below its short-term moving averages, indicating potential resistance.
RSI (14): Approximately 50, suggesting a neutral stance with no clear overbought or oversold conditions.
MACD: Neutral, with the MACD line and signal line close together, indicating indecision in market momentum.
🧮 Strategy / Trade Ideas
Long Setup:
Entry: Consider entering near support levels (~82,200) if bullish reversal signals appear.
Stop Loss: Place below 82,000 to manage risk.
Target: First resistance around 82,600, then 82,900.
Short Setup:
Entry: If price fails to break above resistance (~82,600) and shows signs of reversal.
Stop Loss: Above 82,900.
Target: Downside toward 82,200, then 81,800

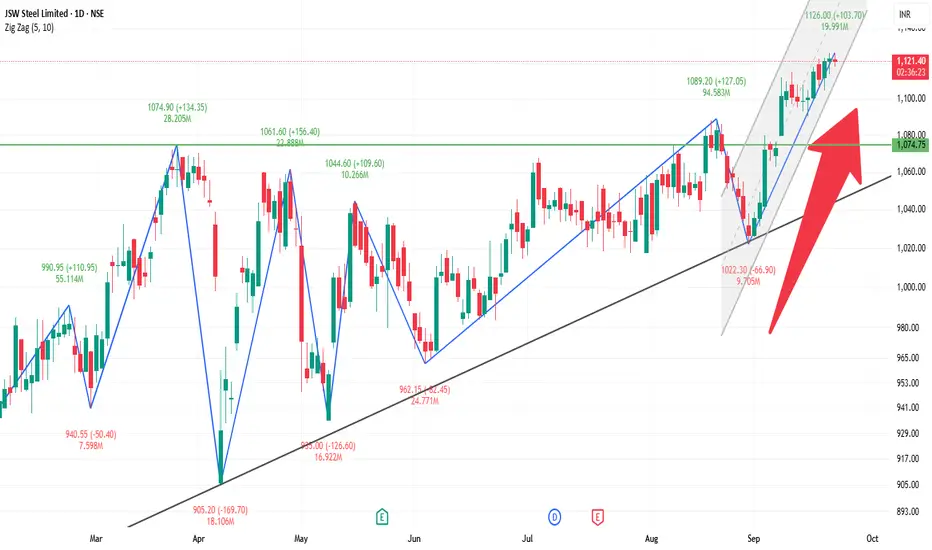
JSWSTEEL 1D Time frame🔍 Current Price
Trading around ₹1,119 – ₹1,120
⚙️ Key Levels (Daily)
Immediate Resistance 1: ₹1,125 – ₹1,130
Next Resistance 2: ₹1,133
Immediate Support 1: ₹1,116 – ₹1,117
Support 2: ₹1,110 – ₹1,113
Deeper Support (Positional): ₹1,072
🧮 Base Strategy Application
Long Setup:
Entry: Near current levels (~₹1,120) if it holds above ₹1,116
Stop Loss: Below ₹1,110
Targets: ₹1,125 – ₹1,130 (short-term), then ₹1,133
Short Setup (Reversal):
If rejection happens near ₹1,125 – ₹1,130 zone
Target: ₹1,116 first, then ₹1,110
Breakout Setup:
If price breaks and sustains above ₹1,133 with volume
Potential for further upside beyond recent highs
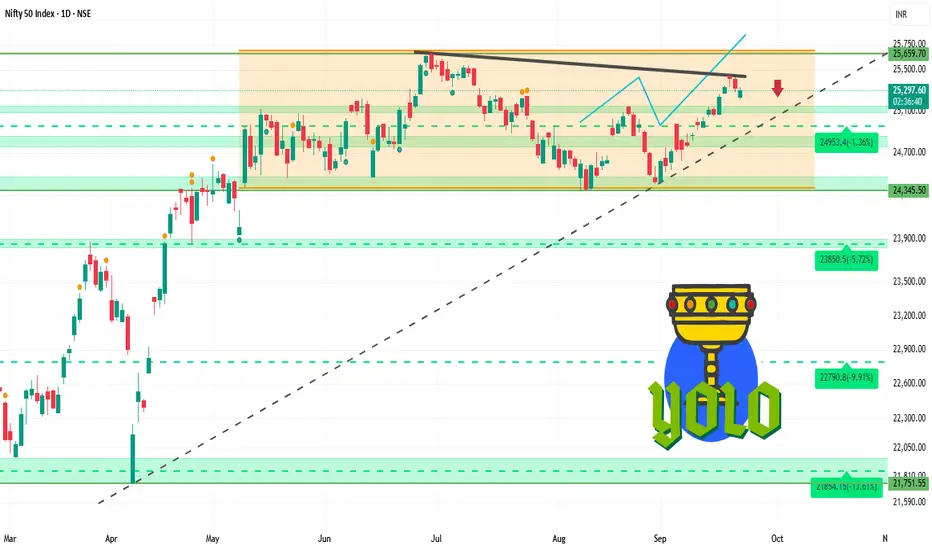
NIFTY 1D Time frame🔍 Current Market Snapshot
Current Level: ₹25,292.45
Day’s Range: ₹25,211.60 – ₹25,331.70
Previous Close: ₹25,327.05
Market Sentiment: Neutral to mildly bearish
📊 Technical Indicators
Moving Averages: The Nifty 50 index is trading slightly below its short-term moving averages, indicating potential resistance.
RSI (14): Approximately 50, suggesting a neutral stance with no clear overbought or oversold conditions.
MACD: Neutral, with the MACD line and signal line close together, indicating indecision in market momentum.
Stochastic Oscillator: Neutral, fluctuating around the midline, reflecting a lack of strong directional movement.
🧮 Strategy / Trade Ideas
Long Setup:
Entry: Consider entering near support levels (~₹25,200) if bullish reversal signals appear.
Stop Loss: Place below ₹24,800 to manage risk.
Target: First resistance around ₹25,400, then ₹25,700.
Short Setup:
Entry: If price fails to break above resistance (~₹25,400) and shows signs of reversal.
Stop Loss: Above ₹25,800.
Target: Downside toward ₹25,200, then ₹24,900.
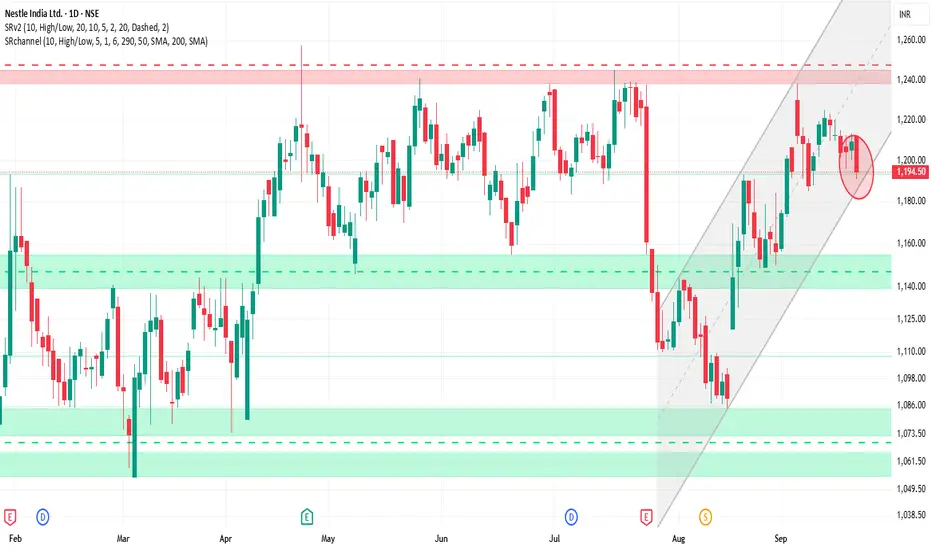
NESTLEIND 1D Time frame📊 Current Snapshot
Closing Price: ₹1,194.50
Day’s Range: ₹1,190.20 – ₹1,212.00
52-Week Range: ₹1,055.00 – ₹1,389.00
Volume: Approximately 2.4 million shares traded
Market Cap: ₹2,30,337 Crores
P/E Ratio: 78.40 (reflecting premium valuation)
Dividend Yield: 2.26%
⚙️ Technical Indicators
Relative Strength Index (RSI): 47.51 – Neutral
Moving Average Convergence Divergence (MACD): -4.12 – Bearish
Moving Averages: Mixed signals; short-term averages above the current price, while long-term averages are below, indicating potential resistance.
Pivot Points: Central pivot around ₹1,194.73, suggesting a balanced market sentiment.
🎯 Potential Scenarios
Bullish Scenario: A breakout above ₹1,197.26 with strong volume could target ₹1,202.16 and higher levels.
Bearish Scenario: Failure to hold above ₹1,187.46 may lead to a decline toward ₹1,183.83.
⚠️ Key Considerations
Market Sentiment: Nestlé India has shown strong performance recently, but broader market conditions can impact its movement.
Volume Analysis: Watch for volume spikes to confirm breakout or breakdown signals.
Technical Indicators: While the RSI indicates a neutral stance, the MACD and moving averages suggest caution.
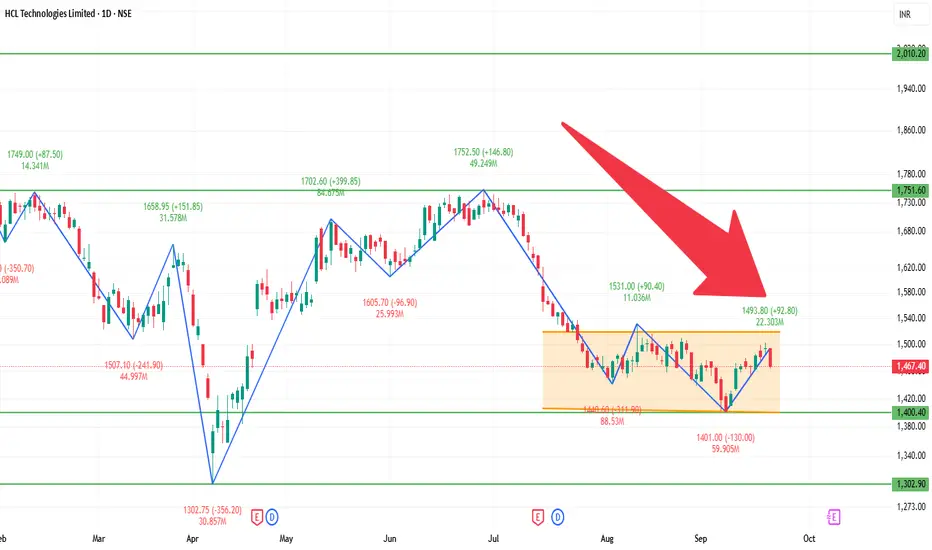
HCLTECH 1D Time frame📊 Current Overview
Price is trading near ₹1,460 – ₹1,470 range.
Trend on the daily chart is showing weakness.
Stock is trading below most key moving averages (50-day, 100-day, 200-day).
🔍 Support & Resistance
Immediate Support: ₹1,450
Next Support: ₹1,430 – ₹1,420
Immediate Resistance: ₹1,470 – ₹1,475
Higher Resistance: ₹1,490 – ₹1,500
📈 Indicators
RSI (14): Neutral to slightly bearish, around mid-40s.
MACD: Weak, showing bearish crossover or flat momentum.
Trend: More sideways to bearish unless resistance levels break.
🎯 Possible Scenarios
Bullish: If HCLTECH breaks and sustains above ₹1,475, it could target ₹1,490 – ₹1,500.
Bearish: If it fails and slips below ₹1,450, it may fall towards ₹1,430 – ₹1,420.
KOTAKBANK 1D Time frame📊 Current Snapshot
Current Price ≈ ₹2,031
Change: ~ -1.15% on latest trading day
Price is above both 50-day and 200-day simple moving averages, which indicates the medium & longer-term trend is still upwards.
Volume is moderate.
🔍 Indicators / Momentum
RSI (14-day): Mid-range, somewhat bullish (but not overbought).
MFI (Money Flow Index): Also mid-range.
Trend Strength Indicators: Mixed. Some moving averages suggest support (price above), while other oscillators show some weakness or potential for sideways drift.
🔒 Support & Resistance Levels
Type Level (Approx)
Key Support ~ ₹2,010 – ₹2,020
Stronger Support if breaks down ~ ₹1,990 – ₹2,000
Immediate Resistance ~ ₹2,050 – ₹2,060
Higher Resistance ~ ₹2,075 – ₹2,080
⚠️ What to Watch For / Risks
The recent dip suggests sellers are exerting pressure near resistance zones.
If momentum weakens, price could fall toward the support band around ₹2,010‐₹2,020.
Any break below ₹2,000 may trigger more bearish sentiment.
🎯 Possible Scenarios
Bullish Case: If price can hold above current support and break above resistance (~ ₹2,050+), it could aim for ₹2,075-₹2,100.
Bearish Case: Rejection at resistance could pull it back toward ₹2,010 or lower. Further weakness might push it toward ~₹1,950-₹2,000 if broader market is weak.

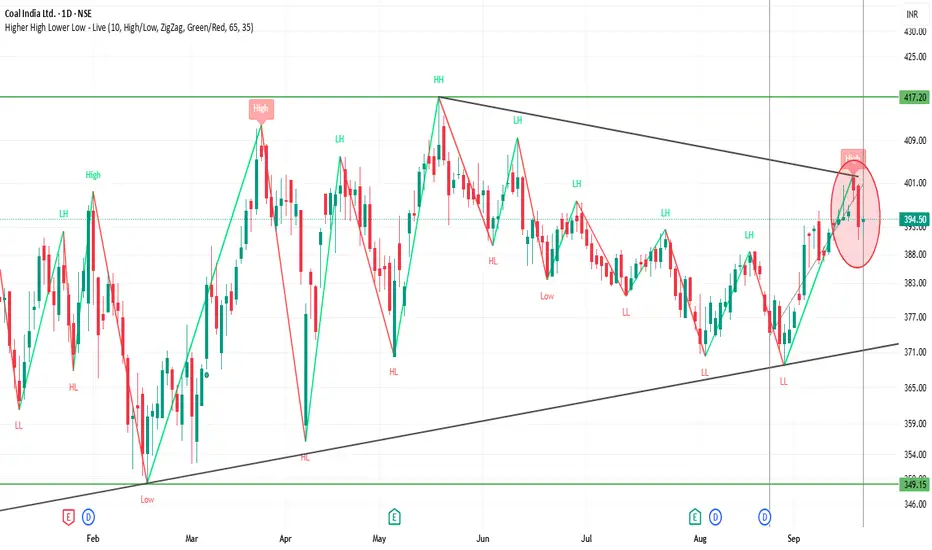
COALINDIA 1D Time frame📊 Current Overview
Current Price: Around ₹394–395
Day Range: ₹391 – ₹395
52-Week Range: ₹349 (Low) – ₹517 (High)
Recent Trend: Stock is consolidating after falling from highs.
🔍 Technical Levels
Support Zone: ₹380 – ₹385
Resistance Zone: ₹400 – ₹405
Range: Currently moving sideways between 385 – 400.
Candlestick Signs: Recent sessions have shown patterns like Harami Bullish and Doji, indicating indecision and possible reversal attempts.
📈 Momentum
Short-term: Neutral to slightly bullish if it holds above 385.
Upside Potential: Break above 405 can push towards 415–420.
Downside Risk: Break below 380 may lead towards 370–365.
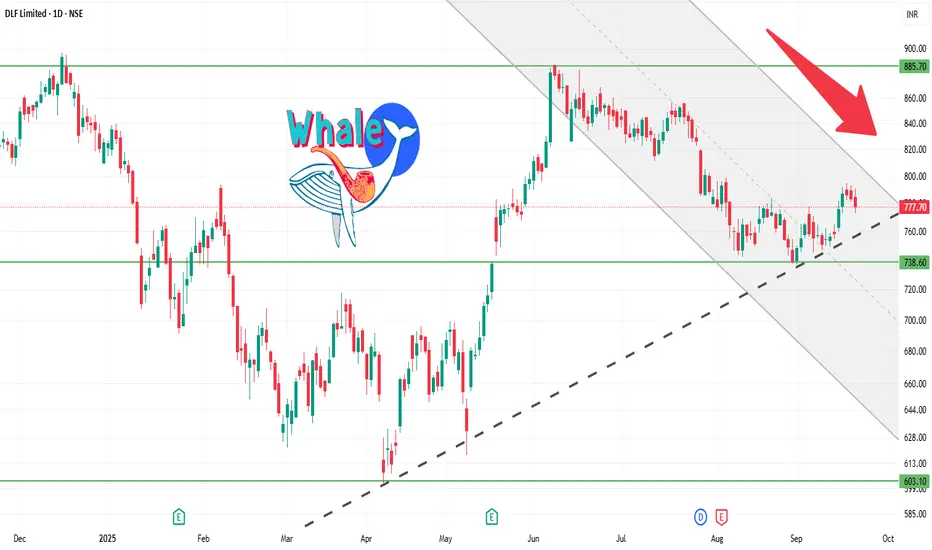
DLF 1D Time frameCurrent Price: Around 780 – 790.
Current Trend: Stock is in a strong uptrend, consolidating after recent highs.
Support Zone: Strong support at 770 – 775. Buyers are likely to defend this level.
Resistance Zone: Key resistance at 800 – 810. A breakout above this can lead to fresh upside.
Indicators: Daily candles show higher lows forming, indicating strength; volumes are healthy.
Outlook:
Above 810 → bullish momentum may continue toward 830+.
Below 770 → weakness may drag it toward 750.
👉 In short:
Tone: Bullish with consolidation.
Range: 770 – 810.
Shall I also prepare a re
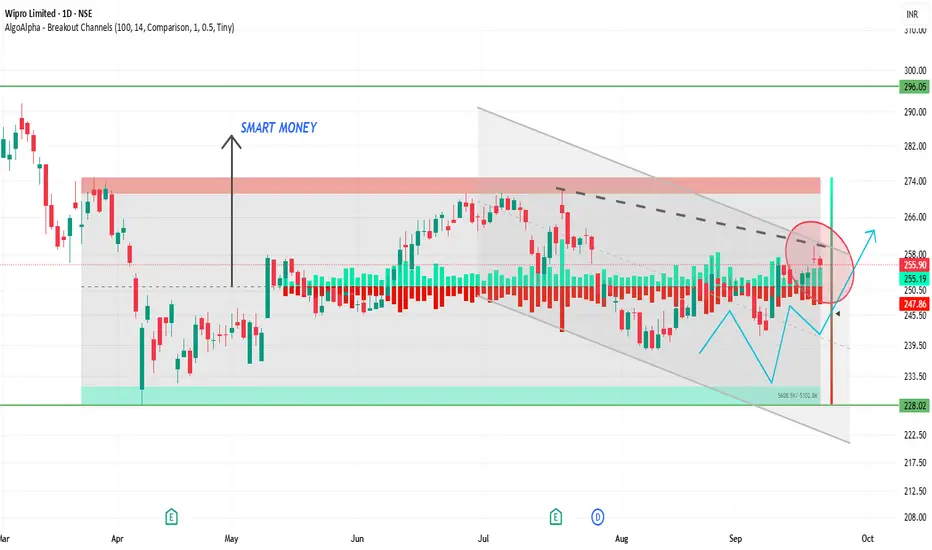
WIPRO 1D Time frameCurrent Price: WIPRO is trading near the 520 – 525 zone (recent levels).
Current Trend: Stock is moving sideways after a sharp move earlier, showing consolidation.
Support Zone: Strong support at 510 – 515. Buyers likely to defend this area.
Resistance Zone: Key resistance around 530 – 535. A breakout above 535 can lead to upward momentum.
Indicators: Daily candles indicate indecision; volumes are stable, showing accumulation at lower levels.
Outlook:
Above 535 → bullish momentum possible toward 550+.
Below 510 → weakness may extend toward 495.
👉 In short:
Range: 510 – 535.
Neutral to bullish tone if it breaks above resistance.
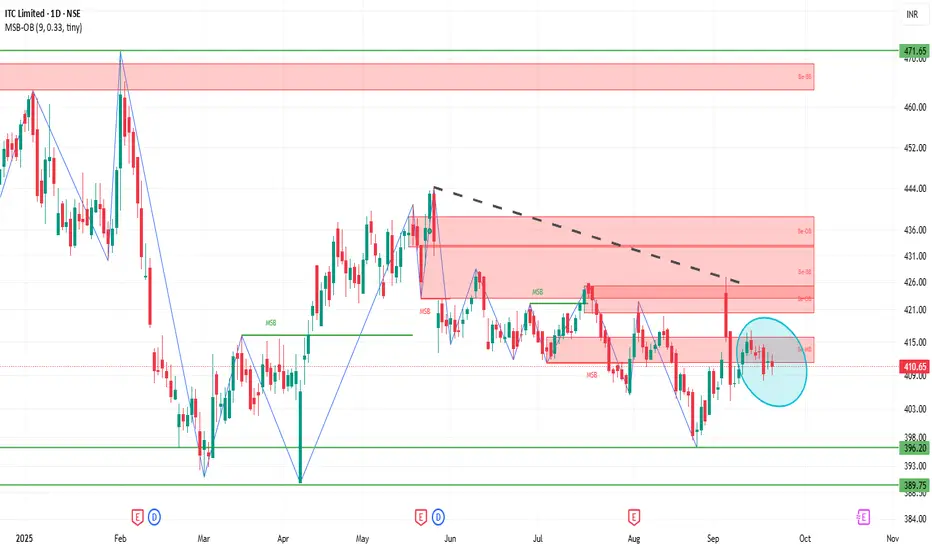
ITC 1D Time frameCurrent Price: Please confirm, but ITC is trading near 440–445 zone recently.
Current Trend: Stock is in consolidation after a recent decline; sideways movement visible.
Support Zone: Strong support lies at 435 – 438. If this holds, stock may bounce.
Resistance Zone: Major resistance is around 450 – 455. A breakout above 455 can bring fresh upside.
Indicators: Daily candles show buyers trying to defend lower levels, but volume is moderate.
Outlook:
Above 455 → bullish momentum may return.
Below 435 → weakness can extend toward 425.
👉 In short:
Range: 435 – 455.
Neutral tone, waiting for breakout.
SENSEX 1D Time frameCurrent Trend: Still sideways to mildly bullish, but trading closer to support levels.
Support Zone: Now the strong support shifts to 82,300 – 82,500. If this zone holds, bounce is possible.
Resistance Zone: On the upside, watch 83,200 – 83,500 for resistance. Breakout above this can push price higher.
Indicators: Daily candle suggests consolidation; buyers defending 82,300 zone.
Outlook:
Above 83,500 → fresh bullish momentum likely.
Below 82,300 → weakness can extend further.
👉 In short (based on 82,626 level):
Range: 82,300 – 83,500.
Market neutral, waiting for breakout either side.
