Institution Option Trading🔍 What Are Options?
Options are financial contracts that give you the right, but not the obligation, to buy or sell an asset at a specific price within a set time. There are two types:
Call Options – Right to buy
Put Options – Right to sell
Institutions use these tools not for speculation but for hedging, portfolio insurance, income strategies, and market positioning.
🧠 How Institutions Trade Options Differently
1. Multi-Leg Strategies
Institutions use advanced strategies like:
Covered Calls
Iron Condors
Vertical Spreads
Calendar Spreads
These strategies allow them to generate income and control risk, unlike directional bets most retail traders make.
2. Risk Management Focus
Institutions never “go all in.” They manage risk using:
Delta-neutral positioning
Hedging with opposite positions
Dynamic rebalancing
Volatility-based exposure control
They measure every trade based on risk-reward, not hope or prediction.
3. Understanding Option Greeks
Institutions actively monitor:
Delta (directional exposure)
Gamma (sensitivity to price change)
Theta (time decay)
Vega (volatility impact)
They use this to manage trades like professionals and adjust positions based on market conditions.
4. Implied Volatility & Volume Triggers
They don’t chase options with hype — they analyze:
Open interest spikes
Volatility crush or expansion
Skew analysis
These help detect big moves before they happen.
5. Smart Money Flow Tracking
Institutional traders leave footprints. You can learn to track:
Block trades
Unusual options activity
Dark pool activity
This reveals where big money is being placed — giving you a serious trading edge.
🎯 What You’ll Learn in Institutional Option Trading
Institutional mindset and objective-driven trading
How to trade options with structure and clarity
How to use Greeks for trade management
Institutional strategies vs. retail mistakes
Real-world case studies from option chain data
👨🏫 Who Is This For?
Traders who want to learn professional-grade options trading
Retail traders looking to stop losses and build consistency
Intermediate traders who want to move beyond basic buying
Investors looking to hedge or enhance returns with options
✅ Final Thoughts
Institutional Option Trading is not about quick profits — it's about risk-managed, high-probability trading with purpose. By learning how institutions trade options, you can elevate your trading game, improve consistency, and avoid emotional mistakes.
HDFCBANK

Trading Master Class 1. Understanding Financial Markets
The course starts with a strong foundation in how financial markets work. You’ll learn the difference between investing and trading, the role of exchanges (like NSE, BSE, NYSE), and how different participants — including retail traders, institutions, brokers, and market makers — influence the market.
You’ll also understand key trading instruments such as:
Stocks (Equities)
Indices (Nifty, Sensex, Dow Jones)
Options & Futures
Commodities and Currencies
This foundation helps in selecting the right markets and strategies for your trading style.
2. Technical Analysis & Chart Reading
Technical analysis is the core tool used by traders to make entry and exit decisions. In this section, you’ll master:
Candlestick Patterns (Doji, Hammer, Engulfing)
Support & Resistance Levels
Chart Patterns (Head & Shoulders, Triangles, Flags)
Volume Analysis
Trend Identification
You’ll also get hands-on experience with popular indicators like Moving Averages, RSI, MACD, and Bollinger Bands — learning when and how to use them effectively.
3. Institutional Trading Concepts
This section reveals how big institutions (smart money) operate and how they trap retail traders. You’ll learn advanced concepts like:
Market Structure
Order Blocks
Liquidity Grabs
Break of Structure (BoS)
Supply and Demand Zones
These concepts help you align your trades with institutional movements, giving you a powerful edge.
4. Strategy Development
You’ll be guided through the process of developing your own trading strategy based on market conditions and personal risk appetite. This includes:
Identifying setups
Entry and exit rules
Risk-reward calculations
Journaling and performance tracking
Backtesting strategies with real data
The focus is on clarity, simplicity, and consistency.
5. Options Trading Simplified
Options are a powerful tool for both hedging and profit. This module covers:
Basics of Calls and Puts
Options Buying vs. Selling
Option Greeks (Delta, Theta, Vega)
Strategies like Covered Calls, Iron Condors, Spreads
Intraday and expiry-day strategies
6. Risk Management & Trading Psychology
No trading system works without discipline and emotional control. This part of the course trains your mindset to handle:
Fear of loss
Greed during profits
Revenge trading
Overtrading
Proper position sizing and capital allocation
You’ll build habits to stay consistent — the key to long-term success.
Summary:
The Trading Master Class is not just about charts or indicators — it’s about learning the right way to trade, with a focus on:
Market knowledge
Strategy building
Institutional concepts
Risk control
Trading psychology
It’s the complete path to becoming a smart, confident, and consistently profitable trader.
Commodity Supercycle 2025: Metals & Energy⚒️ Metals: The Foundation of Industrial Growth
Why are metal prices booming?
Let’s break it down in human terms:
Massive Infrastructure Projects
India, US, China, and Europe are all spending billions on roads, bridges, railways, smart cities, and housing.
All of that needs steel, cement, aluminum, copper, etc.
Clean Energy = More Copper & Aluminum
Solar panels, EVs, and wind turbines need a lot more copper, lithium, and rare metals than conventional energy.
This creates a demand explosion for base metals.
Supply Chain Bottlenecks
Mines across the world (especially in Africa, Chile, and Australia) are facing labour shortages, political instability, or environmental restrictions.
Less mining = less supply = prices go up.
China’s Comeback
China is the largest consumer of metals globally.
After a slow period in 2022–23, it’s back with a stimulus to revive housing and infrastructure — adding massive demand pressure.
🔋 Energy: Fuel for the Supercycle
What’s happening in oil, gas, and coal?
Crude Oil Above $90/Barrel
Conflicts (Russia-Ukraine, Middle East) + OPEC production cuts = tight supply
Despite the push for renewables, the world still runs on oil for transport and manufacturing
Natural Gas Shortages in Europe/Asia
War-related disruptions in Russian supply have caused natural gas prices to skyrocket
LNG imports from the US and Qatar are booming — good for companies in that ecosystem
Coal Prices Rising Again
Despite climate goals, India, China, and others are still using coal for base power
Coal India and related PSUs have seen strong earnings due to volume demand + price support
🧾 How This Affects the Indian Market
India is both a major consumer and a growing exporter of various commodities.
Winners in the Supercycle:
1. Metal Stocks (Steel, Aluminum, Copper)
Company Why It’s Benefiting
Tata Steel Global presence + rising prices = higher margins
JSW Steel Export growth + capex-driven demand
Hindalco Aluminum giant + Novelis (US-based unit)
Hindustan Copper India’s only copper miner; global demand rising
2. Energy Stocks (Oil, Gas, Coal)
Company Why It’s Benefiting
ONGC Rising crude prices = stronger profitability
Oil India Smaller PSU with strong rally potential
Coal India Massive volumes, dividend, pricing power
Reliance Petrochemicals + oil refining benefits
3. Ancillary & Export-Based Stocks
Company Role in Supercycle
NMDC Supplies iron ore – key to steelmakers
MOIL Manganese supplier for steel industry
APL Apollo Tubes Beneficiary of infra + steel boom
Welspun Corp Pipes for oil & gas pipelines
📊 Real Performance: Numbers Don’t Lie
Let’s take a quick look at recent returns (approx. from Jan 2023 to July 2025):
Stock Price in Jan 2023 Price in July 2025 Approx % Gain
Tata Steel ₹110 ₹170+ 55%+
JSW Steel ₹690 ₹930+ 35%+
Hindalco ₹430 ₹675+ 55%+
Coal India ₹220 ₹450+ 100%+
ONGC ₹150 ₹270+ 80%+
These are fundamentally driven rallies — not pump-and-dump moves. That’s the beauty of supercycles.
📈 Technical Outlook in July 2025
Nifty Metal Index:
📌 Near all-time highs (~9,000+ zone)
📈 Trend: Strong bullish
🔁 Expect periodic corrections of 5–7%, but uptrend likely to continue
Nifty Energy Index:
📌 In a broad uptrend, thanks to Coal India, ONGC, Reliance
📈 Breakouts seen in power generation and refining stocks
🎯 Next resistance at 30,000+, support at 28,500
🧠 What Traders & Investors Should Do
🧭 For Traders:
Focus on volume breakouts in metal & energy stocks
Watch for sectoral momentum using indices like Nifty Metal, Nifty Energy
Use Futures & Options (F&O) strategies like:
Call buying on breakout confirmation
Bull call spreads in ONGC, Hindalco, Tata Steel
Short straddles for sideways phases in Coal India
📆 For Swing Traders:
Identify weekly breakout patterns (flags, cup & handle, triangle)
Use trailing SL and partial booking (these stocks move fast)
Best timeframe: 2–4 week swings, especially in trending names
💼 For Long-Term Investors:
Allocate 10–15% of your portfolio to core metal/energy stocks
Focus on low-debt, dividend-paying companies (e.g., Coal India, ONGC)
SIP or staggered entries work well in a volatile commodity cycle
Expect volatility — supercycles are not linear
❗ Risks & Cautions
Every rally has its risks. Here’s what to keep in mind:
Risk Impact
Global Recession Could reduce commodity demand globally
China Slowdown Big impact on copper/steel demand
Currency Volatility Affects import/export profitability
Policy Changes Carbon tax, ESG push may hurt coal/oil stocks
Overheating Stocks may correct 15–20% if valuations get stretched
Always use risk management — especially in leveraged trades.
🗺️ Global Supercycle Factors to Watch in 2025–26
🛢️ Crude oil production quotas (OPEC+ decisions)
🏗️ China’s stimulus on construction and EVs
🌱 ESG push: Will governments ban/restrict dirty fuels faster?
💹 US Fed rate cuts/inflation outlook (affects commodity pricing)
🧾 Mining policies in resource-rich countries (Africa, Latin America)
These global forces shape how long the current commodity upcycle will last.
✍️ Final Thoughts
The commodity supercycle in 2025 is real and being driven by multi-year global trends in infrastructure, energy transformation, and supply limitations. This is not just a short-term rally — it’s part of a structural shift.
If you’re a trader — this sector is offering sharp, trend-friendly price action.
If you’re an investor — this is your chance to ride secular growth in India’s industrial backbone.
💡 “When the world builds, commodities boom. And when that boom is real, wealth is created.”

Midcaps & Smallcaps Giving Multi-Bagger Moves🔍 What’s Going On in the Market?
If you’ve been watching the Indian stock market lately, you’ve probably noticed a massive rally in midcap and smallcap stocks. Stocks that were quietly trading in the background are now suddenly up 50%, 100%, or even 200% within months. Investors who took early positions in these counters are sitting on multi-bagger returns — and everyone wants a piece of the action.
You may have heard of recent examples like:
Suzlon Energy – up over 200% in a year
JTL Infra – up 5x in 2 years
Taneja Aerospace, Tata Tele, Lloyds Metals, Zen Tech, and others doubling in months
So, what’s behind this mega rally?
Should you join now or stay cautious?
Let’s break it all down — without jargon, just real talk.
💼 First, What Are Midcaps and Smallcaps?
These terms refer to the market capitalization (total value of a company’s shares).
Category Market Cap (Approx) Example Stocks
Large Cap ₹50,000 Cr+ Reliance, HDFC Bank, Infosys
Mid Cap ₹10,000 Cr to ₹50,000 Cr Cummins India, PI Industries
Small Cap Below ₹10,000 Cr Suzlon, JTL Infra, RCF
📌 Multi-bagger = A stock that gives 2x, 5x, or 10x returns on your investment
🔥 Why Are Midcaps & Smallcaps Flying in 2025?
Let’s look at the real reasons behind this boom.
1. Strong Economic Growth
India is projected to grow over 7%+ GDP in FY26, highest among large economies.
Sectors like defence, infra, power, and manufacturing are booming — and many mid/smallcap companies are direct beneficiaries.
2. Government Push for Capex & Manufacturing
Schemes like PLI (Production Linked Incentive), ‘Make in India’, and massive infrastructure spending have boosted earnings for niche companies.
Railways, roads, power, and defence see record budget allocations.
3. Retail Participation at All-Time High
More retail investors are trading and investing via Zerodha, Groww, Upstox, etc.
They’re moving beyond large caps and discovering low-priced high-potential stocks.
4. FIIs & DIIs Entering Midcaps Again
Big institutions avoided smallcaps for years due to volatility.
Now, even they are entering quality midcaps, fueling fresh momentum.
5. Technical Breakouts & Volume Surge
Chart patterns (like cup & handle, breakouts) are visible on hundreds of smallcap charts.
Delivery volumes (not just intraday) are rising — a bullish sign.
📈 Real Examples: 2023–2025 Multi-Bagger Stories
🌀 Suzlon Energy
Old wind energy player that was almost bankrupt.
Made a comeback with debt restructuring + clean energy narrative.
Went from ₹5 to ₹40+ in 2 years = 700%+ returns
🛠️ JTL Infra
Steel tube manufacturer for infra and construction.
Strong earnings, high promoter holding, and exports rising.
Stock gave 5x return from 2022 to 2025.
💣 Taneja Aerospace
In the aerospace + defence theme, a lesser-known player.
Low float, strong niche, government defence deals.
Stock moved from ₹90 to ₹500+ in less than 18 months.
These are just a few names. There are dozens of smallcap stocks giving 50–200% returns within 6–12 months.
🧠 The Psychology Behind the Rally
Retail Investors: "Small stocks are cheaper, I can buy 1000 shares instead of 5 of Reliance!"
Traders: "Breakouts with volume? Let’s ride it!"
Institutions: "Let’s grab quality midcaps before they become large caps."
This creates a self-fulfilling cycle:
Rising prices → More buzz → More buyers → Higher prices
🧭 But Is It Safe to Enter Now?
This is where you need clarity and discipline. Not all smallcap stocks are worth buying. Some are quality businesses growing fast. Others are just hype, junk, or operator-driven.
Here’s how to approach the current market:
✅ Smart Strategy to Ride the Rally
1. Focus on Fundamentals First
Ask:
Is the company profitable?
Is debt under control?
Are revenues & profits growing YoY?
Is promoter holding strong?
If yes, it's worth tracking.
2. Use Technical Confirmation
Look for:
Breakouts with volume
Sustained uptrends
Support-retest-bounce zones
Avoid chasing gaps blindly!
3. Track Themes That Are in Focus
Current hot mid/smallcap themes in 2025:
Theme Stock Examples
Defence Zen Tech, BEL, Taneja
Railway Infra RVNL, IRFC, Titagarh
Green Energy Suzlon, IREDA, KPI Green
Capital Goods JTL Infra, KEI, KEC
Fertilizers/Chem RCF, NFL, Deepak Nitrite
These themes are backed by government policy + earnings visibility.
4. Avoid Pump & Dump
Stay away from low-volume, “Telegram tip” kind of stocks.
Check if delivery % is high — if not, it’s probably a trap.
💡 Quick Checklist Before Buying a Smallcap
Question Good Sign?
Promoter Holding > 50%? ✅ Yes
Debt-to-Equity < 1? ✅ Yes
Consistent Profit Growth? ✅ Yes
Trading Above 200 EMA? ✅ Yes
Mentioned in Annual Budget/Sector News? ✅ Yes
If 4–5 of these match, it’s worth researching deeper.
🧾 What to Avoid
Stocks with huge moves but no earnings to justify it
“Operator stocks” — low float, sudden spikes, suspicious circuits
Tips from WhatsApp/Telegram without any proof
Stocks hitting back-to-back upper circuits without volume
These often crash when the tide turns.
🛡️ Risk Management Matters More Than Ever
Midcaps and smallcaps are high-return, high-risk areas.
You must:
Never put more than 10–20% of your portfolio in smallcaps
Use a stop-loss for every trade
Book partial profits on every 20–30% move
Don’t marry any stock — even the good ones fall eventually
📊 Long-Term vs. Short-Term Approach
If You’re a Long-Term Investor:
Stick to quality smallcaps with strong business models.
SIP method works well during volatile phases.
Great time to build wealth if you stay patient.
If You’re a Swing Trader:
Use technical setups: cup & handle, breakouts, flag patterns.
Trade 2–4 week timeframes.
Use position sizing — don’t go all in on one stock.
🔮 Outlook for 2025–26
With elections approaching and strong GDP, midcaps/smallcaps may continue to lead.
But correction or volatility is expected — markets don’t rise in a straight line.
Use dips to add, avoid panic exits.
✍️ Final Words
The midcap and smallcap rally in 2025 is not just a bubble — it’s being driven by real growth, real earnings, and massive retail interest. However, not every rising stock is worth chasing. Be selective, research-driven, and disciplined.
“Everyone wants multi-baggers. But only the patient and the smart ones actually catch them.
Nifty & Bank Nifty Near All-Time Highs🧠 What Are Nifty and Bank Nifty?
Before we get into the “all-time high” excitement, here’s a quick recap:
🔹 Nifty 50
Represents the top 50 blue-chip companies listed on the NSE.
Covers 13 major sectors like banking, IT, FMCG, pharma, auto, etc.
Reflects the overall health of the Indian economy.
🔹 Bank Nifty
Comprises the 12 most liquid and large-cap banking stocks.
Includes private banks like HDFC Bank, ICICI Bank, Kotak Bank and public sector banks like SBI, Bank of Baroda, etc.
Tracks the performance of the banking sector, which is the backbone of economic activity.
📈 What Does “All-Time High” Really Mean?
An All-Time High (ATH) is the highest price level ever recorded by an index or a stock.
So when Nifty and Bank Nifty approach or hit their ATHs:
It means market confidence is at a peak.
Investor wealth is growing.
There's strong buying interest — often from FIIs (Foreign Institutional Investors) and DIIs (Domestic Institutional Investors).
It also attracts retail traders who don’t want to miss the rally.
🏁 Current All-Time High Zones (As of July 2025)
Index All-Time High Current Level (Approx) Difference
Nifty 50 24,200+ 24,050–24,150 < 1%
Bank Nifty 54,500+ 54,200–54,400 < 1%
💡 These levels keep changing — and might even be broken by the time you read this.
🔥 Why Are Nifty & Bank Nifty So Strong Right Now?
Here are the top reasons behind this strong rally:
1. Strong Earnings Season
Most large-cap companies posted better-than-expected Q1 FY26 results.
Sectors like banking, infra, auto, and energy are leading.
Low NPAs (bad loans) and growing credit demand boosted banking profits.
2. FII Buying
Foreign investors are back with heavy inflows into Indian equities.
They see India as a stable and fast-growing economy.
3. Domestic Growth Outlook
India is projected to be the fastest-growing major economy.
Manufacturing, services, and infra growth are driving GDP higher.
4. Global Stability (for now)
US Fed likely to hold or reduce interest rates.
Crude oil prices are stable.
No major geopolitical shocks recently.
5. Sector Rotation Favoring Leaders
Money has rotated out of laggards (like IT) into leaders (like BFSI, Infra).
This is pushing index-heavyweights like HDFC Bank, Reliance, ICICI Bank, L&T to new highs.
📊 What Happens When Nifty & Bank Nifty Hit ATHs?
🚀 Bullish Breakout (if ATH is broken strongly)
Heavy buying can trigger a fresh uptrend.
Short sellers might cover positions, fueling a short squeeze.
Traders look for quick 2%–5% moves post-breakout.
FOMO (Fear of Missing Out) can bring in more retail investors.
🧱 Resistance & Reversal (if ATH acts as a barrier)
Many traders also book profits near ATHs.
If breakout lacks volume/strength, pullbacks or corrections can happen.
Smart money waits for confirmation before entering aggressively.
🧠 What Should You Do as a Trader?
✅ If You’re a Short-Term Trader:
Focus on Levels:
Mark important zones: Previous ATH, recent support/resistance.
Example: Nifty needs to break and close above 24,200 with volume.
Avoid Chasing:
Don’t enter long trades after a huge gap-up near ATH — wait for retest or breakout confirmation.
Use Options Wisely:
Weekly expiries have high volatility.
Strategies like bull call spreads, straddles, or breakouts with strict SL work well.
Watch Sector Leaders:
Stocks like HDFC Bank, L&T, Reliance, Axis Bank often lead Nifty.
Trade them directly instead of the index if volatility is too high.
📈 What Should You Do as an Investor?
✅ If You’re a Long-Term Investor:
Stay Invested, Don’t Panic
ATH doesn’t mean the rally is over.
Indian markets are still fundamentally strong.
Don’t Go All-In Now
If you have lump sum funds, consider SIP or staggered buying.
Wait for dips or consolidation phases to add.
Focus on Sectors With Tailwinds
Banking, Infra, PSU, Capital Goods, and Consumption are currently leading.
Avoid Over-Hyped Stocks
Stick to quality large and mid-caps.
Avoid microcaps or penny stocks that rally just due to hype.
📌 Technical Outlook (As of Mid-July 2025)
🔹 Nifty 50:
Support: 23,800, then 23,500
Resistance: 24,200 (ATH), then 24,400
RSI: Around 68 – near overbought zone
Trend: Bullish but cautious — wait for breakout or pullback confirmation
🔹 Bank Nifty:
Support: 53,600, then 52,900
Resistance: 54,500 (ATH), then 55,000
Volume: Rising, especially in ICICI, HDFC, SBI
Trend: Stronger than Nifty due to credit growth optimism
🤖 What Are Smart Money & Institutions Doing?
Mutual Funds: Continuing SIPs, rotating into banking, auto, infra, and PSU.
FIIs: Buying banks, energy, and large-caps after months of selling.
DIIs: Supporting the market on dips, absorbing supply.
This institutional interest is what’s really keeping the market stable near ATH levels.
🛑 Risks to Watch Out For
Even though things look bullish, be aware of these possible risks:
Global tensions (Russia-Ukraine, China-Taiwan flare-ups)
US Fed unexpected rate hike
Sudden spike in crude oil prices
Local political uncertainty (elections approaching)
Overvaluation in certain stocks (mid- and small-caps getting overheated)
🧭 Final Words: How to Navigate Nifty & Bank Nifty at ATH?
Don’t panic if markets are at highs. ATH doesn’t mean you missed the bus.
But don’t go blind into FOMO either.
Stick to high-quality stocks, use proper stop-losses, and avoid leverage.
Track volumes, news flow, and institutional activity.

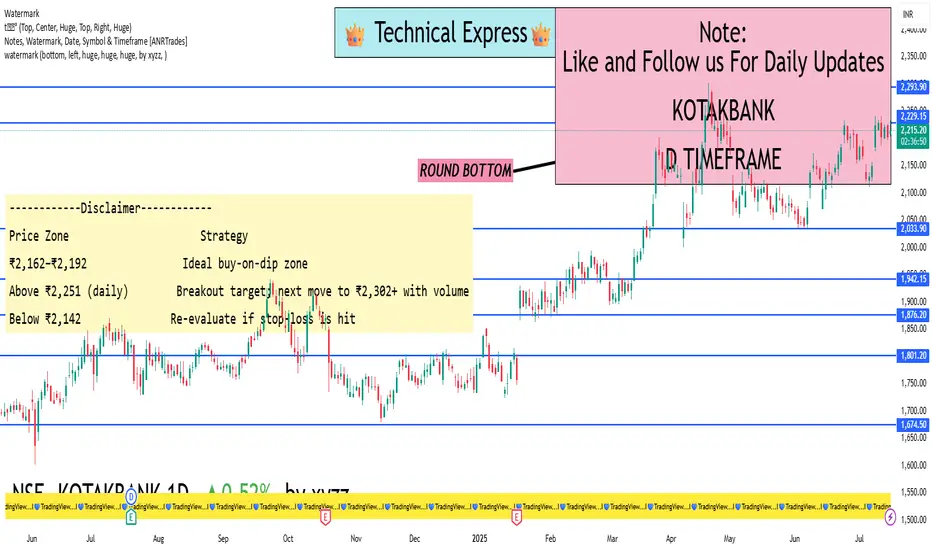
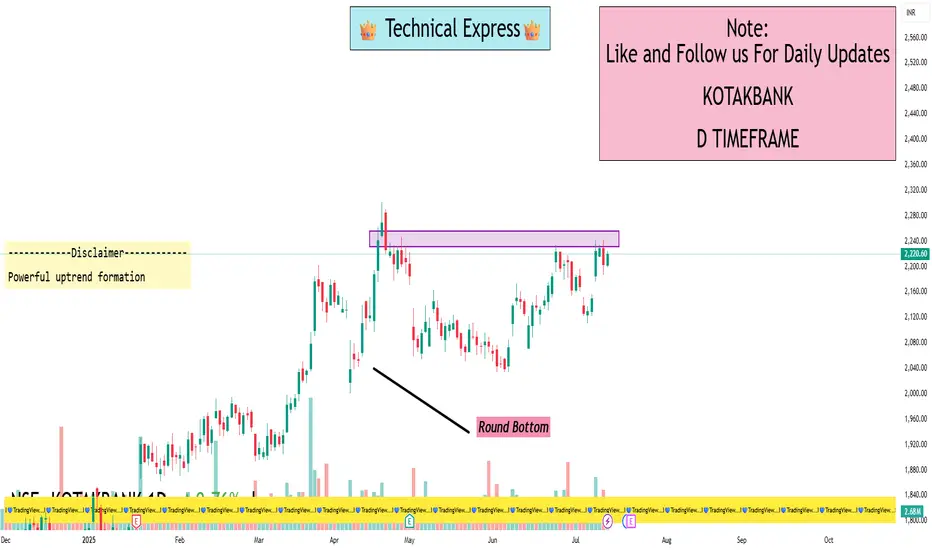
KOTAKBANK 1D Timeframe Current Price & Trend
Current Trading Range: Roughly ₹2,216–₹2,227 (today’s range: ₹2,204–₹2,233)
The stock is in a positive trend, but not yet extended drastically—making now a reasonable entry moment .
Support (Buy-on-Dip) Levels
Here are the levels where the stock is likely to bounce if it pulls back:
₹2,192–₹2,180 – Decent cushion; everyday bounce zone
₹2,162 – Stronger support that previously held price from falling lower
₹2,142–₹2,160 – Broader base zone; still reputable buying area
Resistance (Profit-Zone) Levels
These are key barriers where profit-booking may occur:
₹2,221–₹2,222 – Daily pivot resistance; short-term ceiling
₹2,239–₹2,251 – Next upside target zones; tougher hurdles
₹2,302 (52-wk high) – Major breakout level; a decisive daily close above could spark a fresh rally
What You Can Do
If You’re Holding
Continue to hold—trend is intact.
Consider taking partial profits near ₹2,239–₹2,251 if short-term gains are attractive.
If You Want to Buy
Best buy ranges:
₹2,192–₹2,180 (safe pivot area)
₹2,162 (good buffer zone)
Accumulate in small lots; add on deeper dips.
If You’re Playing Breakouts
Watch for a daily close above ₹2,251—that could open the path to the old high of ₹2,302+ with momentum.
Risk/Stop-Loss
If you buy near ₹2,192, use a stop-loss just below ₹2,180.
If entry is near ₹2,162, a stop under ₹2,142 is prudent.
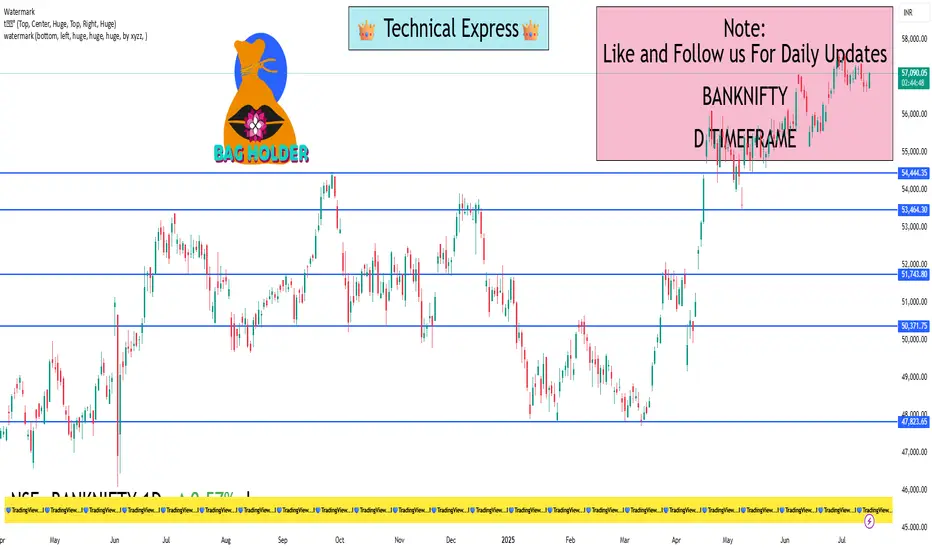
BankNifty 1D Timeframe📊 Current Market Price:
Around ₹56,750 – ₹56,800
Bank Nifty has recently cooled off a bit after touching its all-time high of ~₹57,628. It’s still in a strong uptrend, but showing short-term consolidation—which is healthy for long-term moves.
🛡️ Important Support Zones (Buy on Dips)
These are levels where Bank Nifty is likely to bounce if it falls:
✅ ₹56,200 – ₹56,300
Recent swing low and key 1-day candle support
Ideal first level to enter or add
Can act as a good buying zone if the index dips slightly
✅ ₹55,500 – ₹55,700
Strong demand zone
Acts as a cushion in case of deeper correction
Great zone for long-term accumulation
✅ ₹54,800 – ₹55,000
Previous breakout level
Excellent entry point for long-term investors if panic selling happens
🚧 Resistance Levels (Upside Barriers)
These are levels where profit booking may happen:
🔼 ₹57,000 – ₹57,200
Near current highs; if crossed, momentum may return quickly
🔼 ₹57,600 – ₹57,800 (All-Time High Zone)
Heavy resistance; needs volume to break
🔼 ₹58,500+
Potential future target on strong breakout above ₹57,800
📌 What to Do Now (Investment Plan)
🔹 Already Holding?
Stay invested. Trend is still bullish unless price breaks below ₹55,000.
Consider booking partial profits near ₹57,600 if you're short-term focused.
🔹 Want to Invest Now?
Wait for dip to ₹56,200 – ₹56,300 for safer entry
Start buying in small parts. Don’t go all in at once.
🔹 Aggressive Entry?
You can also consider entering now and adding more on dips
Just place a stop loss near ₹55,000 (daily close basis)
Master Institutional TradingInstitutional trading refers to the buying and selling of financial assets—stocks, bonds, derivatives, commodities, currencies—by organizations that invest large sums of money. These trades are typically large in volume and value and are executed through private negotiations or electronic networks designed for block trading.
Key Characteristics:
High volume orders
Priority on stealth execution
Access to premium data
Quantitative modeling
Advanced algorithms

Option TradingInvesting Approach by Institutions
✅ Investment Philosophy:
Long-term horizon
Focus on fundamentals (P/E, ROE, growth)
Sector rotation and macro trends
✅ Allocation Strategies:
Strategic Asset Allocation (SAA)
Tactical Asset Allocation (TAA)
Smart Beta and Factor Investing
Trading Strategies by Institutions
🔹 High-Frequency Trading (HFT)
Executes thousands of trades in milliseconds
Relies on arbitrage, price inefficiencies
🔹 Statistical Arbitrage
Mean-reversion strategies using historical patterns
🔹 Swing & Trend Trading
Use technical indicators like MACD, Moving Averages, RSI

Option Trading Part-1 What Is Institutional Option Trading?
Institutional Option Trading involves using derivatives (Options) for:
Hedging big equity portfolios
Speculating on volatility or price movement
Arbitrage opportunities
🔹 Key Techniques:
Volatility Arbitrage
Delta-Neutral Hedging
Covered Calls
Protective Puts
Iron Condors & Spreads
How Institutions Use Options Differently
✅ Retail Focus:
Naked calls/puts
Directional trades
Limited capital
✅ Institutional Focus:
Portfolio insurance
Complex multi-leg strategies
Implied Volatility arbitrage
Event-based hedging (like earnings or Fed news)

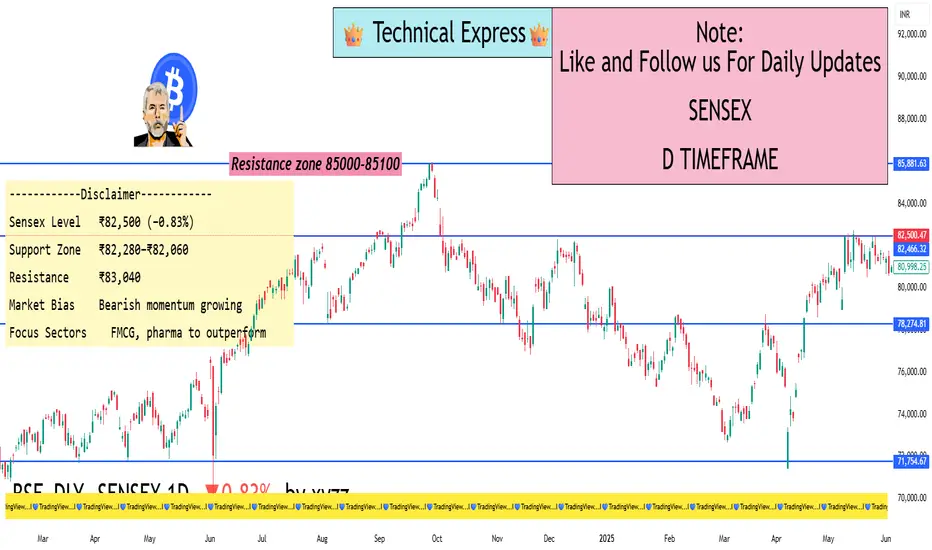
Sensex Dives Below ₹82,600 — IT Stocks Drag Index DownFrom a technical standpoint, Sensex breaking below ₹82,600 is important. This was seen as a short-term support level. Now that it's broken, ₹82,280 and ₹82,060 are the next zones to watch for.
Moving Averages:
Sensex has slipped below its 20-day moving average, which is often used as a trend indicator.
This shows short-term weakness and signals caution for traders.
RSI (Relative Strength Index):
RSI is heading lower but not yet in oversold territory.
This means there could be more downside before a potential bounce.
MACD:
The MACD indicator is also showing bearish crossover – another sign that the market could stay weak in the near term.
What Should Traders & Investors Do Now?
For Traders:
This is a time to stay cautious.
Avoid taking aggressive long positions unless Sensex reclaims ₹83,000+ with strong volume.
Focus on stock-specific opportunities in sectors like FMCG, pharma, or even PSU banks.
For Long-Term Investors:
Don’t panic. Corrections like these are common.
Instead of trying to time the market, look for quality stocks at attractive valuations.
IT stocks are fundamentally strong, so long-term investors can accumulate slowly on dips, especially if they fall further.
Global Factors at Play
What happens in the global economy directly affects Indian markets. Here are some international cues that are influencing Sensex:
US Interest Rates:
The US Federal Reserve may raise interest rates again to fight inflation.
Higher rates make borrowing expensive, slow down spending, and can trigger a global slowdown.
China's Economic Data:
Slower growth in China has worried global investors.
A slowdown in Asia’s biggest economy has ripple effects on global demand.
Geopolitical Tensions:
Trade issues, especially between the US and China, are creating uncertainties.
Wars or unrest in regions like Ukraine or the Middle East also cause global instability.
What to Watch in Coming Days
Key Events:
More Q1 results from major companies
Global inflation data releases
FII (Foreign Institutional Investors) activity – whether they continue selling or start buying
Crude oil price movement – as it affects inflation and currency
RBI commentary on interest rates
📢 Final Thoughts
The fall in Sensex below ₹82,600 is a signal for caution, not panic. The IT sector’s weakness has triggered the fall, but the overall market is still stable when compared to global peers.
For serious investors, this is a good time to review portfolios, build a watchlist, and focus on quality stocks and sectors that show relative strength. Defensive sectors like FMCG and pharma are showing signs of leadership.
Market cycles are natural – after every fall, there's a recovery. The key is to stay updated, stay disciplined, and not let emotions drive your decisions.
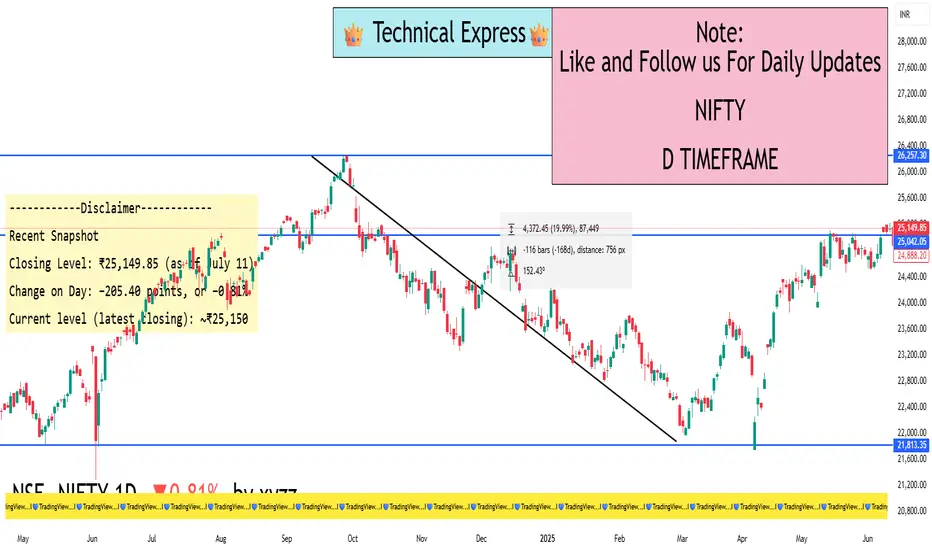
NIFTY Slips Below 25,200 The Nifty closed today at 25,149, down by around 205 points.
It has broken an important support level near 25,330, which could be a warning sign for traders and investors.
The market is showing signs of weakness – key technical indicators like RSI and MACD are also turning negative.
If Nifty slips below 25,000, we might see more downside movement in the coming days.
👉 For now, it’s better to stay cautious.
Long-term investors should wait for stability.
Short-term traders should manage risk and avoid over-trading.
Keep an eye on upcoming Q1 earnings and global market trends.
This is not the time to panic – it’s the time to stay informed and plan smartly.
Caption Highlights (optional for post tags or image text):
Nifty breaks 25,330 support
Watch 25,000 as next key level
Bearish signals on technical charts
Caution advised for traders
Market waiting for fresh cues
Dip-buying in quality large-caps & sectorsDip-Buying in Quality Large-Caps & Sectors: A Simple Investor's Guide
One of the hottest topics in today’s stock market is dip-buying in quality large-cap stocks and sectors. If you’ve been following the market even casually, you’ve probably heard this term thrown around a lot. But what does it really mean? And more importantly, how can you use this strategy to your advantage in a way that’s smart and simple?
This guide breaks it down in plain English, so whether you're new to investing or have been in the game a while, you'll understand exactly how dip-buying works, why it's trending, and what sectors and stocks are currently worth your attention.
What Is Dip-Buying?
"Buying the dip" means purchasing stocks when their prices temporarily fall, with the belief that they will rise again. Think of it like a sale at your favorite store. The item (in this case, a stock) hasn’t lost its value; it’s just cheaper for now. Smart investors take advantage of these moments to buy strong companies at a discount.
But there's a catch. Not every dip is worth buying. That’s why it's important to focus on quality large-cap stocks and strong sectors — companies and industries that have a solid track record, strong financials, and the ability to bounce back from short-term declines.
Why Is Dip-Buying So Popular Right Now?
Market Volatility: Global markets are swinging more than usual due to geopolitical tensions, inflation, interest rate changes, and currency pressure. This creates more short-term dips.
Economic Stability: Despite the ups and downs, long-term economic fundamentals in countries like India are still positive. Sectors like banking, pharma, and FMCG are showing resilience.
Pro Investor Strategy: Top fund managers and seasoned investors often use dip-buying to accumulate high-quality stocks at better prices. Retail investors are now catching on to this technique.
Better Risk-Reward: When you buy during a dip, you increase your chances of getting higher returns when the stock rebounds, while minimizing downside risk (if chosen wisely).
What Makes a Stock "Quality"?
Not every large-cap stock is a safe bet. Here are key signs that a company is worth buying on dips:
Consistent Revenue and Profit Growth
Strong Brand Recognition (like HUL, TCS, Infosys)
Good Corporate Governance
Low to Moderate Debt
Regular Dividends
Presence in a Growing Industry
These are the kinds of stocks that recover quickly after market corrections.
Sectors Worth Watching for Dip-Buying
Let’s break down a few of the most popular sectors where investors are buying dips:
1. FMCG (Fast-Moving Consumer Goods)
These are companies that sell everyday products like soap, toothpaste, and food.
Why it's strong: Demand is stable even in bad times.
Examples: HUL (Hindustan Unilever), Nestle, Dabur, Britannia.
Strategy: Buy during quarterly results disappointment or short-term inflation impact.
2. Pharma & Healthcare
Why it's strong: Healthcare is essential; global export markets offer growth.
Examples: Sun Pharma, Dr. Reddy’s, Cipla, Glenmark.
Strategy: Buy on regulatory setback or global pressure — long-term story is still intact.
3. Private Banking & Financials
Why it's strong: Credit growth is picking up; digital transformation is boosting profits.
Examples: HDFC Bank, ICICI Bank, Kotak Mahindra Bank, Axis Bank.
Strategy: Accumulate on market-wide corrections or temporary bad loan fears.
4. IT & Tech
Why it's strong: Digital services, AI, and automation are booming worldwide.
Examples: TCS, Infosys, Wipro, HCL Tech.
Strategy: Buy during global slowdown fears or margin pressure.
5. Auto & EV-Related Stocks
Why it's strong: Strong demand post-COVID, and EV boom is real.
Examples: Maruti Suzuki, Tata Motors, M&M, Bajaj Auto.
Strategy: Use monthly sales dips or raw material price spikes to enter.
How to Actually Do Dip-Buying (Without Stress)
Make a Watchlist: Pick 10–15 quality large-cap stocks across sectors.
Use Alerts or Apps: Set price alerts so you know when a stock drops 5–10% from recent highs.
Check the News: Was the dip due to a real problem or just market mood swings?
Start Small: Don’t put all your money at once. Invest in chunks. That’s called SIP (Systematic Investment Plan) in stocks.
Stay Updated: Re-evaluate your picks every quarter. Replace weak stocks.
Hold with Patience: Dip-buying is not about overnight returns. Give your stocks 6–12 months at least.
Common Mistakes to Avoid
Buying Every Dip: Not every fall is a buying opportunity. Some companies have deeper problems.
Ignoring Fundamentals: Always check financial health.
Getting Greedy: Don’t try to time the exact bottom.
Panic Selling: If you’ve done your homework, trust your process.
Real Example (as of July 2025)
Let’s say HUL dropped from ₹2,800 to ₹2,580 after weak results. If you believe in the company’s long-term story, that 8% drop is a buying opportunity. Maybe you buy 20% of your planned quantity now, and wait to add more if it drops further to ₹2,450. If it rebounds, great — you already entered.
Another example: Glenmark Pharma recently jumped 14% due to a global licensing deal. It had dipped earlier due to export pressure. Those who bought during that dip are now sitting on solid gains.
Final Thoughts
Dip-buying in quality large-cap stocks isn’t just a smart strategy; it’s also a calm one. It helps you invest without chasing highs or making emotional decisions. It works best when you combine common sense, basic research, and patience.
Markets will always move up and down. But strong companies bounce back. If you can learn to spot those temporary drops in quality businesses, you can grow your wealth steadily and confidently.
Happy Investing!
Banknifty 1day time frame📊 Current Status (as of today)
Bank Nifty is trading around: ₹56,750 – ₹56,800
It's just below its all-time high, which is around ₹57,628.
The trend is still positive (bullish), but it’s taking a breather after a big rally.
🛡️ Strong Support Zones (Buy on Dip Areas)
These are the price areas where Bank Nifty may bounce back if it falls:
₹55,500 – ₹55,700 → Minor support
₹54,300 – ₹54,500 → Stronger support zone (good for long-term entry)
₹52,500 – ₹53,000 → Very strong base; ideal for adding long-term positions if market corrects
🚀 Resistance Levels (Where Price Might Struggle)
These are areas where it might face selling pressure:
₹57,000 – ₹57,200 → Near-term resistance
₹57,600 – ₹57,800 → All-time high zone
Above ₹58,000 → Fresh breakout, could fly to new levels if crossed with volume
✅ What You Can Do (If You’re a Long-Term Investor)
If you already hold: Stay invested. Trend is still up.
If you want to buy:
Wait for a dip to around ₹54,300–₹55,000 for a safer long-term entry.
Or, buy small now and add more on dips.
Breakout Strategy: If Bank Nifty closes above ₹57,800, it may start a new rally.
📌 Summary in One Line:
“Bank Nifty is near its highs — still bullish, but don’t chase. Buy dips around ₹54,500 or add more only if it breaks above ₹57,800.”

KOTAKBANKKotak Bank has been weak for a while but now it's trying to form a bottom. The stock is not yet in a strong uptrend, but it's showing early signs of a possible recovery.
Good Price to Invest
If you're looking to invest, a good range to start buying is around:
Here are the current daily price levels for Kotak Mahindra Bank (KOTAKBANK) on NSE:
Last traded price: ₹ 2,220.60, up
Today's range: ₹ 2,198.60 – ₹ 2,225.00
52‑week range: ₹ 1,679.05 – ₹ 2,301.90
Intraday Pivot Levels (Approximate)
According to Equity Pandit, today's pivot-based support and resistance likely fall at:
Immediate Supports:
• S1 ≈ ₹ 2,204
• S2 ≈ ₹ 2,188
• S3 ≈ ₹ 2,178
Resistances:
• R1 ≈ ₹ 2,231
• R2 ≈ ₹ 2,241
• R3 ≈ ₹ 2,257
Drilling deeper, a key intraday level is ₹ 2,184:
If the stock closes below ₹ 2,184, the short-term trend could weaken—potential signal to lighten downside risk.
As long as it stays above ₹ 2,184, the positive momentum may hold.
HDFCBANK – Heavy Call Writing Near 2000 Zone________________________________________
📈 HDFCBANK – Heavy Call Writing Near 2000 Zone | OI + Price Action Analysis
🕒 Chart Type: 15-Minute
📆 Date: July 7, 2025
________________________________________
🔍 What’s Catching Our Eye:
HDFCBANK closed at ₹1987.4, and the entire Call side from ₹1980 to ₹2100 is showing strong Short Build-Up, clearly suggesting resistance building up ahead, especially around ₹2000–₹2040 levels.
Meanwhile, Put side shows Long Unwinding at ₹2000 PE, suggesting lack of bullish confidence at current levels.
________________________________________
📌 What We’re Watching For:
Watch the zone between ₹2004.70 – ₹2007.90 very closely – it’s a visible Supply Zone based on price rejection + heavy CE OI.
If HDFCBANK fails to break and sustain above ₹2009.30 (SL), bears may take control again and drive it back to ₹1980 or below.
________________________________________
📊 Volume Footprint:
Heavy CE volumes hint at active resistance:
• ₹2000 CE – 9.3k+ contracts
• ₹2060 CE – 7.8k+ contracts
• ₹2020 CE & ₹2040 CE – ~5.6k contracts each
→ Strong presence of Call writers near current levels, pressuring the upside.
________________________________________
📈 Option Chain Highlights:
Calls (Short Build-Up):
• ₹2000 CE: +1,93,600 OI | Price ↓ 8.87%
• ₹2060 CE: +10,04,300 OI | Price ↓ 16.67% ✅ Major resistance buildup
• ₹2020 CE: +6,90,800 OI | Price ↓ 11.42%
• ₹2040 CE: +5,83,550 OI | Price ↓ 15.13%
• ₹1980 CE: +2,17,800 OI | Price ↓ 6.44%
• ₹2100 CE: +2,00,200 OI | Price ↓ 17.76%
Puts:
• ₹2000 PE: -84,150 OI | Price ↓ 0.87% → Long Unwinding = Bullish weakness
• ₹1980 PE: +6,050 OI | Price ↓ 2.33% → Weak Short Build-Up
📌 Inference:
Call writers are dominating the entire upper side. There’s no strong Put writing, and PE writers are exiting positions at ATM — this confirms limited bullish conviction.
________________________________________
🔁 Trend Bias:
🔴 Bearish to Range-Bound – unless ₹2009.30 gets taken out on closing basis
________________________________________
🧠 Trade Logic / Reasoning:
• Heavy Short Build-Up in all major CE strikes
• Lack of Put writing near spot
• Supply Zone aligning perfectly with Option Chain resistance
→ Expect rejection or pause unless strong buyers break ₹2009.30 with volume.
________________________________________
📍 Important Levels to Mark:
🔺 Top Range (Resistance): ₹2008
🔻 Bottom Range (Support): ₹1980
________________________________________
🎯 Trade Plan (Educational Purpose Only):
✅ Best Buy (Equity): Above ₹2009.30 with a bullish candle and volume
✅ Best Sell (Equity): Below ₹2004.70 for quick move to ₹1980
✅ Best CE to Long: None – CE side is under Short Build-Up
✅ Best PE to Long: ₹1980 PE if price starts rejecting ₹2000 zone again
🟢 Demand Zone: ₹1965 – ₹1980 (Intraday Bounce Possible)
🔴 Supply Zone: ₹2004.70 – ₹2007.90 (SL: ₹2009.30)
⚠️ Invalidation Levels (With Logic):
🔻 Bullish View Invalid Below: ₹1980 – breaks structure and confirms weakness
🔺 Bearish View Invalid Above: ₹2009.30 – a breakout above this level with volume + PE Short Build-Up will invalidate bearish trades
________________________________________
⚠️ Disclaimer:
This analysis is for educational purposes only.
STWP is not a SEBI-registered advisor.
No buy/sell recommendations are made.
Please consult your financial advisor before trading.
STWP is not responsible for trading decisions based on this post.
________________________________________
💬 Rejection from ₹2000 or breakout above ₹2009?
What’s your view on HDFCBANK? Comment below ⬇️
🔁 Share this if you're tracking the zone
✅ Follow STWP for clean Price Action + OI Trades
🚀 Let’s trade with clarity and confidence!
________________________________________

Option Trading ClassThe Institutional Trading Process is highly strategic and complex, combining deep research, advanced technology, and strict compliance. Institutions leverage their size and tools to execute efficiently without heavily impacting the market.
Introduction to Option Trading
What are Options?
Options are contracts giving the right, but not the obligation, to buy (Call) or sell (Put) an underlying asset at a predetermined price within a specific time.
Types of Options:
Call Option: Right to buy
Put Option: Right to sell
Key Terms:
Strike Price, Premium, Expiry Date, Lot Size, Intrinsic Value, Time Value

Institutional Trading 1. Investment Idea Generation
How it Starts: Analysts, portfolio managers, or quantitative teams identify potential trades based on in-depth research, financial models, or market events.
Key Drivers: Economic indicators, earnings reports, sector performance, geopolitical news, or algorithmic signals.
2. Pre-Trade Analysis and Risk Assessment
Objective: Assess liquidity, volatility, and execution risks.
Tools Used: Option chains, order books, volume profiles, VWAP (Volume Weighted Average Price), and market depth analysis.
Risk Teams: Ensure the trade aligns with the fund’s risk appetite and regulatory requirements.

Option Trading Order Strategy Design
Execution Planning: Institutions cannot place large orders directly; they split trades into smaller lots to avoid price impact.
Techniques:
Algorithmic Trading (TWAP, VWAP, Iceberg orders)
Dark Pool Execution
Block Trades via Brokers
Trade Execution
Methods: Trades are routed through brokers, electronic communication networks (ECNs), or proprietary trading desks.
Real-Time Monitoring: Institutions monitor slippage, transaction costs, and market reaction continuously.

Institutional Objectives in Options TradingInstitutional Objectives in Options Trading
1. Hedging
Institutions use options to protect large portfolios from adverse price movements.
Example: A fund holding a large stock position may buy put options as insurance.
2. Speculation
Institutions speculate on short-term market movements with directional bets using options.
Example: Buying call options in anticipation of a stock rally.
3. Arbitrage
Institutions exploit pricing inefficiencies in the options market for risk-free profit.
Example: Engaging in index arbitrage or dividend arbitrage strategies.
4. Income Generation
By selling options, institutions generate consistent premium income.
Example: Writing covered calls on long equity positions.
Tools and Techniques Used by Institutions
1. Advanced Option Strategies
Spreads: Vertical, horizontal, and diagonal spreads to limit risk.
Straddles and Strangles: To profit from high volatility.
Iron Condors and Butterflies: To capture premium in low volatility.
2. Option Greeks Management
Institutional traders rely heavily on managing option Greeks:
Delta: Sensitivity to price changes in the underlying asset.
Gamma: Rate of change of Delta.
Theta: Time decay impact.
Vega: Sensitivity to volatility changes.
Rho: Sensitivity to interest rate changes.
3. Technology and Algorithms
Institutions employ high-frequency trading (HFT) systems and algorithmic strategies to execute options trades efficiently and capitalize on minute price movements.
4. Implied Volatility and Open Interest Analysis
Institutions use implied volatility (IV) and open interest (OI) as key indicators to gauge market sentiment and structure complex multi-leg strategies accordingly.

Institution Option TradingInstitutional options trading refers to the large-scale use of options by financial institutions such as hedge funds, mutual funds, pension funds, banks, insurance companies, and proprietary trading firms. Unlike retail traders, institutional participants possess significant capital, advanced technology, and deep market insight, enabling them to deploy complex options strategies for hedging, speculation, and arbitrage purposes.
Institutional options trading plays a crucial role in shaping market dynamics. These large entities can influence volatility, liquidity, and price movements due to the size and frequency of their trades. Understanding how institutional traders operate provides retail traders with key insights to align their strategies effectively.
The Foundation of Options Trading
1. Understanding Options
Options are derivative contracts that give the buyer the right, but not the obligation, to buy or sell an underlying asset at a predetermined price (strike price) within a specified time frame.
Types of Options:
Call Options: Provide the right to buy.
Put Options: Provide the right to sell.
2. Key Option Terminologies
Premium: Price paid to buy the option.
Strike Price: Predetermined price to buy/sell the underlying asset.
Expiration Date: Last date the option can be exercised.
In-the-Money (ITM): Option with intrinsic value.
Out-of-the-Money (OTM): Option with no intrinsic value.

Technical ClassCandlestick patterns are essential tools in technical analysis that help traders predict potential market movements based on price action. Each candlestick represents four key data points: Open, High, Low, and Close prices within a specific time frame.
Types of Candlestick Patterns:
1. Single Candlestick Patterns
Doji: Market indecision (Open ≈ Close)
Hammer: Bullish reversal, long lower wick
Shooting Star: Bearish reversal, long upper wick
Spinning Top: Market indecision, small body
2. Double Candlestick Patterns
Bullish Engulfing: Strong bullish reversal
Bearish Engulfing: Strong bearish reversal
Tweezer Bottom/Top: Reversal signals
3. Triple Candlestick Patterns
Morning Star: Bullish reversal (3 candles)
Evening Star: Bearish reversal (3 candles)
Three White Soldiers: Strong bullish continuation
Three Black Crows: Strong bearish continuation
✅ Importance in Trading:
Predict Trend Reversals
Identify Continuation Patterns
Spot Market Sentiment Early

Institutional TradingDefinition:
Institutional trading refers to the buying and selling of financial securities by large organizations such as mutual funds, pension funds, insurance companies, hedge funds, and investment banks.
Key Characteristics:
High-volume transactions
Lower transaction costs due to bulk orders
Direct access to market liquidity
Use of advanced trading algorithms and platforms
Example Institutions:
BlackRock
Vanguard
Goldman Sachs
Who are Institutional Traders?
Types of Institutional Traders:
Mutual Funds: Trade for large-scale portfolio diversification.
Pension Funds: Focused on long-term stable returns.
Hedge Funds: Seek high returns with complex strategies.
Insurance Companies: Invest premiums for steady growth.
Investment Banks: Trade for proprietary gains and clients.
How They Operate:
Work with large research teams
Utilize proprietary trading algorithms
Influence market prices significantly
