Option Trading Master class Part -7Fundamentals of Stock Investing
Types of Investors:
Value Investors: Focus on undervalued companies
Growth Investors: Target high-growth potential stocks
Dividend Investors: Prefer regular income from dividends
Research Parameters:
Earnings per Share (EPS)
Price-to-Earnings Ratio (P/E)
Return on Equity (ROE)
Debt-to-Equity Ratio
Industry Trends
Tools for Investing:
Demat and Trading Account
Research Platforms (e.g., TradingView, Screener.in)
Portfolio Tracker (e.g., Zerodha Console)
HDFCBANK

Option Trading Master classIntroduction to Investing and Option Trading
Investing and option trading are two pillars of wealth creation and risk management in modern finance. Investing focuses on long-term growth by acquiring assets that appreciate over time, while option trading involves strategic bets on price movements within a defined period using derivative contracts. Together, they offer investors a combination of growth, income, and hedging capabilities.
What is Investing?
Definition:
Investing is the process of allocating money into financial instruments (like stocks, bonds, ETFs, or real estate) with the expectation of generating a return over time.
Key Objectives:
Wealth accumulation
Passive income generation
Capital preservation
Beating inflation
Common Asset Classes:
Equity (Stocks): Ownership in companies
Fixed Income (Bonds): Lending capital to earn interest
Real Estate: Physical properties generating rental income
Mutual Funds/ETFs: Pooled investments
Commodities and Gold: Inflation hedges

Master class 9. Introduction to Option Trading
Options are powerful derivative instruments that give buyers the right (not obligation) to buy or sell an underlying asset at a predetermined price within a specific time. They are commonly used for hedging, speculation, and income strategies.
There are two basic types:
Call Options: Right to buy
Put Options: Right to sell
Options derive value from stocks, indices (Nifty, Bank Nifty), commodities, or currencies and are traded on platforms like NSE in India.
2. Key Terminology in Option Trading
Strike Price: Price at which the option can be exercised
Premium: Cost of buying the option
Expiry: Last day the option is valid
Lot Size: Fixed number of underlying units (e.g., 50 for Nifty)
Intrinsic Value: Real value of an option if exercised now
Time Value: Portion of premium linked to time left before expiry
ATM/ITM/OTM: At The Money, In The Money, Out of The Money – defines moneyness of options

Institution Master class Welcome to the Institution Trading Master Class, an advanced educational module crafted for serious traders and investors who want to understand how big institutions trade, move markets, and manage risk at scale. This course blends practical market experience with strategic tools and institutional concepts.
📘 Page 1: Understanding Institutional Trading
🔹 What is Institutional Trading?
Institutional trading refers to market activities performed by large entities like:
Mutual Funds
Pension Funds
Hedge Funds
Insurance Companies
Foreign Institutional Investors (FIIs)

Institution Option Trading Part-7Regulatory & Risk Considerations
SEBI (India) & SEC (US) regulations limit speculative exposure.
Institutions must report Open Interest, Position Limits, Margin Usage.
Must adhere to VaR (Value at Risk) frameworks and internal risk policies.
Institutional Trading during Events
Earnings Seasons: Institutions use straddles/strangles for earnings plays.
Budget or RBI Policy: Protective collars/volatility trades.
Global Crisis (e.g. COVID): Use of massive protective puts (SPX, NIFTY).
VIX & Institutional Behavior
India VIX plays a vital role in determining institutional option strategies.
High VIX = buying protection, long gamma strategies.
Low VIX = selling premium, income strategies.

Institution Option Trading Part-5Popular Strategies Tested via Option Database
IV Crush Earnings Strategy
Buy/sell options before earnings when IV is high, expecting post-earnings IV drop.
High OI Breakouts
Trade breakouts from strikes with high OI using price+OI correlation.
Skew Arbitrage
Analyze IV skew and trade underpriced/overpriced strikes accordingly.
Time Decay Capture (Theta)
Sell options with high Theta before expiry using historical decay rates.
💡 Advantages of Option Database Trading
Quantitative Edge: Allows logic-based decisions over emotion-driven trades.
Backtesting Confidence: Know the probability of success before risking capital.
Scalability: Can analyze hundreds of symbols and expiry combinations.
Automation Ready: Can link with brokers to run fully algorithmic systems.

Trading Road Map 1. Foundation Stage (Beginner Level)
Understand Markets: Equity, Commodity, Forex, Derivatives
Basic Concepts: What is a stock, index, option, futures
Learn Platforms: TradingView, Zerodha, Upstox
Risk Awareness: Avoid FOMO, control emotions, capital safety
🔹 2. Skill Building Stage (Intermediate Level)
Technical Analysis: Charts, Patterns, Indicators (MACD, RSI, Moving Averages)
Fundamental Analysis: Earnings, Balance Sheets, PE ratio
Paper Trading: Practice without risking money
Journaling: Track trades, wins/losses, and learn from mistakes
🔹 3. Strategy Development (Advanced Level)
Create Systems: Scalping, Swing, Positional
Options Mastery: Strategies like Iron Condor, Straddle, Spread
Risk Management: Position sizing, SL rules, R:R ratio
Backtesting: Validate your strategy on historical data
🔹 4. Execution & Scaling (Pro Level)
Discipline & Psychology: Stick to plans, stay unemotional
Automation & Tools: Algo Trading, Screeners
Capital Scaling: From ₹10K to ₹10L+ systematically
Diversification: Trade across assets, build passive income

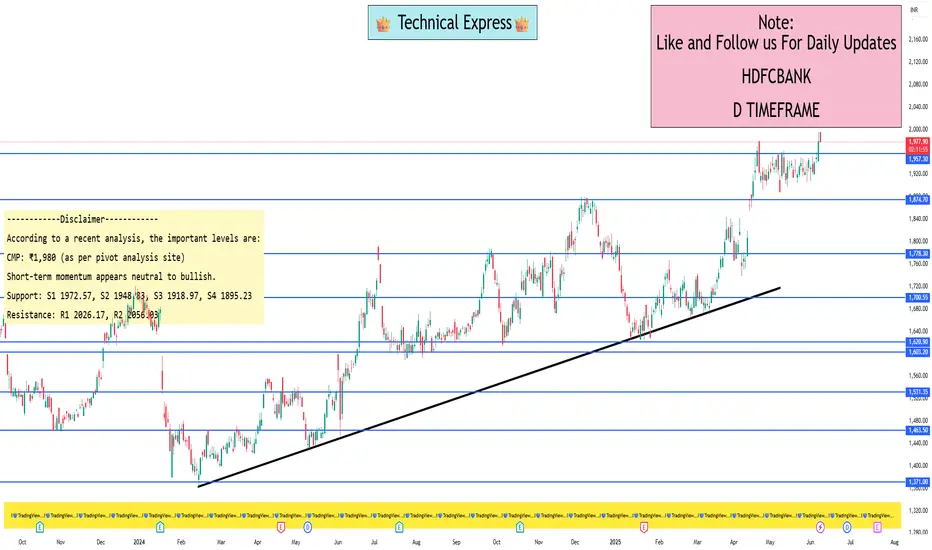
HDFC Bank levels for swing tradingAccording to a recent analysis, the important levels are:
CMP: ₹1,980 (as per pivot analysis site)
Short-term momentum appears neutral to bullish.
Daily Pivot (Classic Standard) – significant for intraday/swing entries
Pivot: 2002.43
Support: S1 1972.57, S2 1948.83, S3 1918.97, S4 1895.23
Resistance: R1 2026.17, R2 2056.03
CPR (Daily):
BC: 1969.50
P: 1972.57
TC: 1975.63
Weekly Pivot – key for multi‑day swing setups
Pivot: 1961.00
Support: S1 1925.70, S2 1872.70, S3 1837.40
Resistance: R1 2049.30, R2 2102.30
CPR (Weekly):
BC: 1952.15
P: 1961.00
TC: 1969.85
Open Interest & Option Chain Analysis Topic: Open Interest & Option Chain Analysis
1: What is Open Interest (OI)?
Simple Meaning:
Open Interest means the total number of active option or futures contracts in the market that haven’t been closed yet.
Easy Example:
If you and your friend enter into a new option trade, the open interest is 1. If someone else joins with a new trade, it becomes 2. But if you close your trade, it becomes 1 again.
What It Tells You:
If OI is increasing, more people are joining the market.
If OI is decreasing, traders are exiting their trades.
Combine OI with Price Movement:
Price going up + OI going up = New buying → Bullish
Price going down + OI going up = New selling → Bearish
Price going up + OI going down = Traders exiting shorts → Short covering
Price going down + OI going down = Traders exiting longs → Profit booking
2: What is an Option Chain?
Simple Meaning:
Option Chain is a table that shows all the call and put options for a stock at different strike prices.
What You’ll See in an Option Chain:
Strike Price: The price you agree to buy/sell.
Calls (CE): Right to buy.
Puts (PE): Right to sell.
Open Interest (OI): How many contracts are active.
Volume: How many were traded today.
LTP: Latest price of that option.
3: How to Read Option Chain Like a Pro
1. Spot the Support Levels:
Look for the highest OI on the put (PE) side → Big money sees this as support.
2. Spot the Resistance Levels:
Look for the highest OI on the call (CE) side → Traders think price won't go above this.
3. Track Market Mood:
If more puts are being written (PE OI going up) → Traders are bullish.
If more calls are being written (CE OI going up) → Traders are bearish.
4. PCR (Put Call Ratio):
PCR > 1 → More puts than calls = Bullish
PCR < 1 → More calls than puts = Bearish

Advance Institutions Option Trading - Lecture 5When it comes to low risk options strategies, selling a call spread and selling a put spread are techniques that traders often utilize. These strategies are characterized by a high probability of profit due to the low probability of loss, and they limit risk in case the trade doesn't go as planned.
While day traders look at minute-to-minute price changes, swing traders look at trends that play out over several days. This is considered one of the most profitable trading types that allows more flexibility, as you don't need to be glued to your computer screen all day.

Advance Institutions Option Trading - Lecture 4If you're looking for a simple options trading definition, it goes something like this: Options trading gives you the right or obligation to buy or sell a specific security on or by a specific date at a specific price. An option is a contract that's linked to an underlying asset, such as a stock or another security.
Options trading also involves two parties: the holder (buyer) and the writer (sometimes called the seller). Holders are investors who purchase contracts, while writers create them. The holder pays the writer a premium for the right to sell or buy a stock by a certain date.

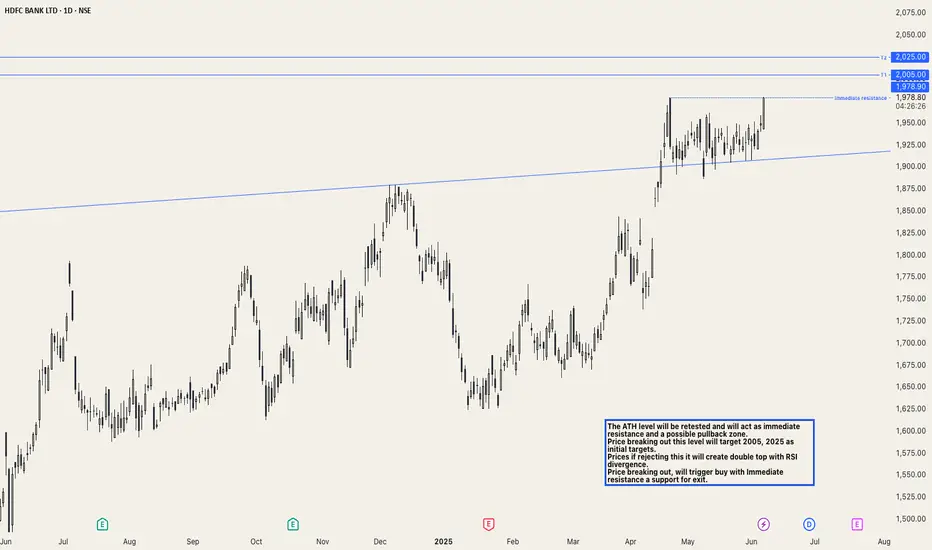
HDFCBANK: All Time High retest, for new ATH.The ATH level will be retested and will act as immediate resistance and a possible pullback zone.
Price breaking out this level will target 2005 and 2025 as initial targets.
Prices if rejecting this, it will create a double top with RSI divergence.
Price breaking out will trigger a buy, with Immediate resistance a support for exit.
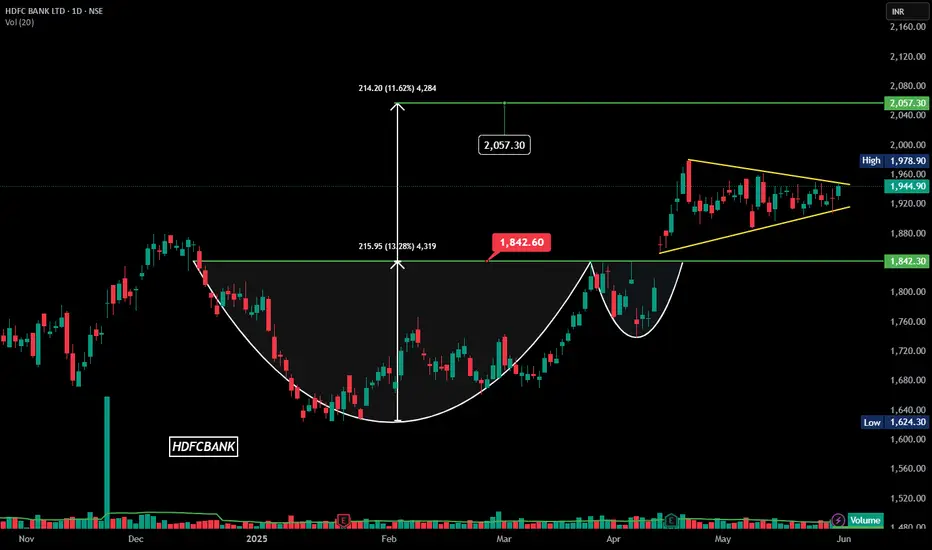
HDFCBANK | Symmetrical Triangle | Daily |Watchlist### **Technical Analysis of HDFC Bank Ltd. (NSE)**
The **daily candlestick chart** of **HDFC Bank Ltd.** highlights key technical patterns, suggesting potential bullish momentum.
### **Key Observations:**
1. **Cup and Handle Formation:**
- A well-defined **cup and handle** pattern is visible, indicating prolonged accumulation.
- Breakout above **1,960.00 INR** confirms bullish sentiment.
- **Projected Target:** **2,057.30 INR**, a **11.62% upside** from breakout.
2. **Symmetrical Triangle Breakout:**
- Price action consolidating within a **symmetrical triangle**, leading to breakout confirmation.
- Strong move above **1,944.90 INR**, validating upward momentum.
3. **Volume & Price Action:**
- **Volume:** **14.37M** surpassing 20-day moving average of **10.13M**, confirming strength.
### **Support & Resistance Levels:**
- **Support:** **1,842.00 INR**, acting as a key cushion in case of pullbacks.
- **Resistance:** **2,057.30 INR**, aligning with the measured move projection.
HDFCBANK (Bullish)A very good consolidation, any breakout towards upside can propel price upto 2000. This same trend can also be seen and captured in BankNifty.

Institutional Intraday Trading Part -7Options Type: Understand whether you're dealing with Call Options (bullish) or Put Options (bearish).
Strike Price: This is the agreed price for exercising the contract. ...
Open Interest (OI): Indicates the number of active contracts for a strike price.

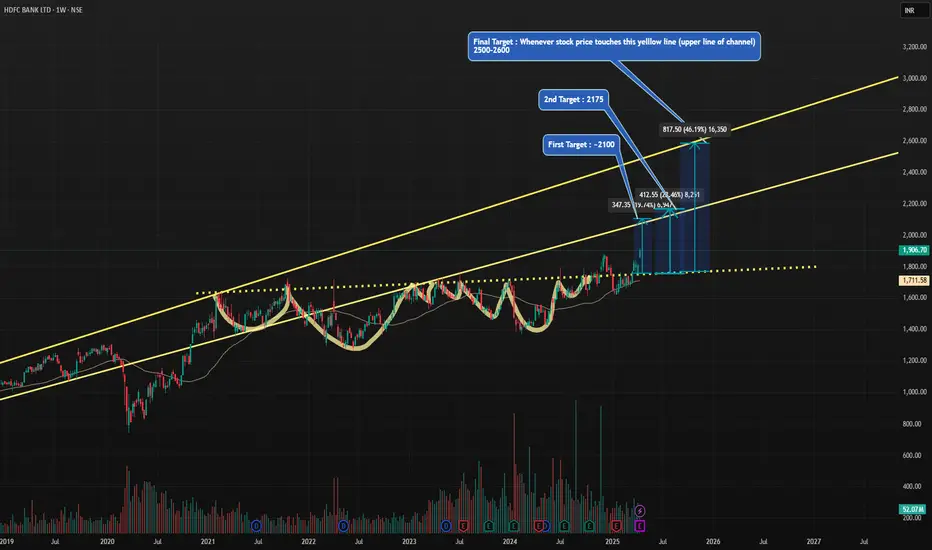
HDFC BANK : 45-50% upside possible in 1.5 Years. BODHi friends,
Targets are mentioned in the self explanatory chart .
HDFC Bank is the largest private sector bank having all time high profitability & sells .
It has well controlled gross and net NPA compared to its peers .
There is a very good probability for the stock to reward its investors with ~50% return .
Its a BOD (BUY ON DIPS) as per my analysis .
Please feel free to comment or share your views on my analysis .
Note : I am not SEBI registered advisor . Please consider my analysis for education purpose only .
Smart money buying in YES BANK.YES Bank Breakout Alert
YES Bank has recently shown a strong breakout supported by high trading volume, following news that Japan's Sumitomo Mitsui Banking Corporation has received RBI approval to acquire a 51% stake in the bank.
From a technical standpoint, the chart structure indicates a bullish trend on higher time frames. If this breakout holds as genuine, the stock has the potential to test ₹22.50 and ₹28 levels in the near term — representing an upside of approximately 40% from current levels.

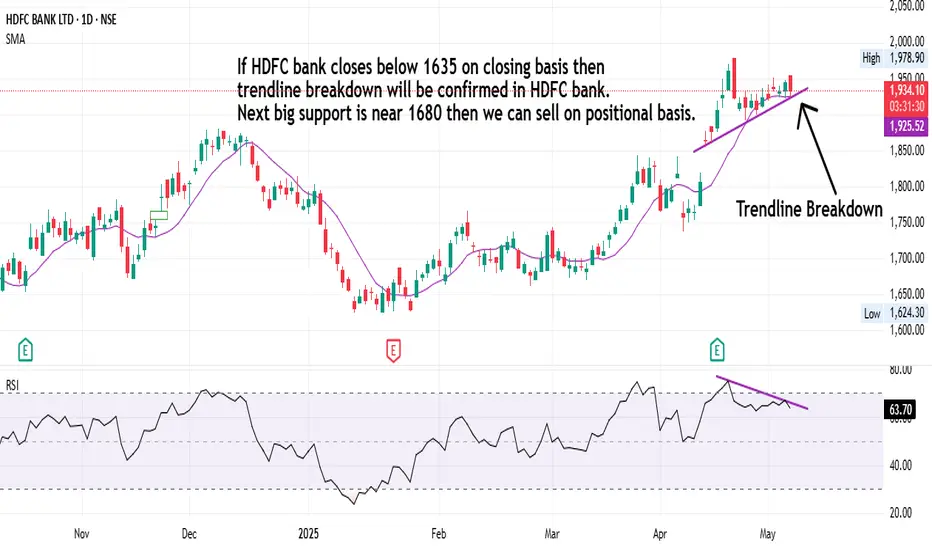
HDFC Bank Swing Trading Strategies!If HDFC bank closes below 1635 on closing basis then trendline breakdown will be confirmed in HDFC bank. Next big support is near 1680 then we can sell on positional basis.
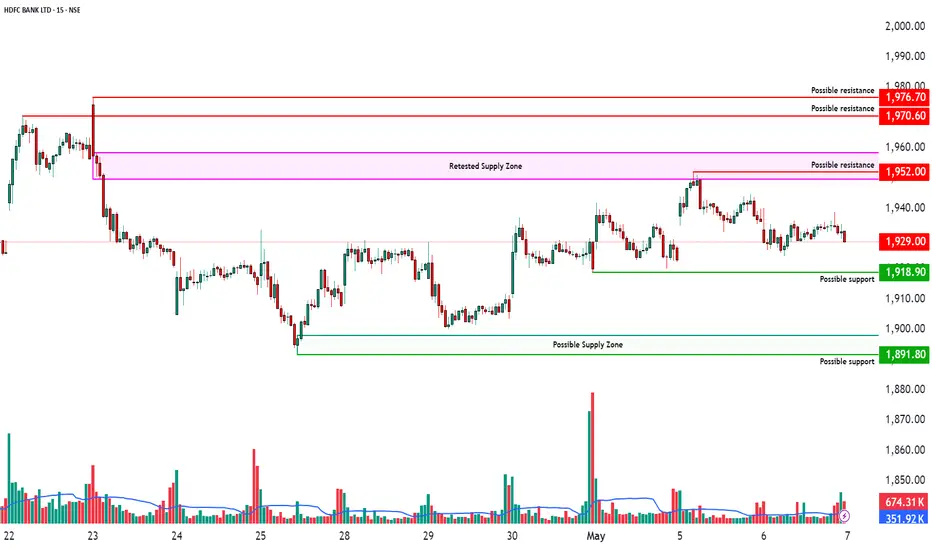
Range-Bound Between Key Supply & Demand Zones🏦 HDFC Bank Ltd – Range-Bound Between Key Supply & Demand Zones 📊
Timeframe: 15-Minute | Exchange: NSE | Date: May 6, 2025
CMP: 1,929.00
🔴 Retested Supply Zone: 1949.60 - 1958.40
This zone previously acted as resistance after a sharp fall.
Price revisited the zone but was rejected, indicating potential selling pressure.
A breakout above this level could trigger bullish continuation.
🟢 Possible Demand Zone: 1898 - 1891.80
Price rebounded from this zone earlier, showing possible accumulation by buyers.
Not confirmed yet with multiple tests, but worth watching for potential support.
Breakdown below this may open the door to further downside.
📌 Current Price Action
HDFC Bank is currently consolidating between these two zones.
No clear trend yet; price is oscillating sideways.
Volume is decreasing, indicating lack of momentum in either direction.
📈 Levels to Watch
Breakout Zone: 1,959+
Breakdown Zone: 1,890-
🔍 Observational Bias
Bearish Bias: If price revisits 1949.60 - 1958.40 zone and shows rejection, potential short setups may emerge.
Bullish Bias: If price retests 1898 - 1891.80 with bullish confirmation, long trades may be considered.
SBI form Inverse H&S.SBI form Inverse H&S pattern. Today gives break out of neckline 780. SBI is at demand zone add more if come down to 780. Close below 760 would be the violation of this pattern.
As per chart it may test 785-807 soon.
As per OI data on dated 17.04.2025 there is considerable OI shading on CE side and OI build up on PE side. Stock is in good momentum as upper Bolinger Band tested and expanded. As per indicator all are bullish only Moving average need to improve. There are good chance for retest the neckline.

Falling Wedge Breakout with Bullish Structure | 15-Min Chart🏦 HDFC BANK LTD – Falling Wedge Breakout with Bullish Structure | 15-Min Chart
📅 Date: April 25, 2025
📈 Timeframe: 15-Minute
🔍 Stock: HDFC Bank Ltd (NSE)
📌 Technical Overview:
HDFC Bank is showing signs of a potential bullish reversal on the 15-minute chart, forming a falling wedge pattern, which is typically known for reversal setups. Price action suggests a breakout from the wedge structure, with strong volume support.
🧩 Chart Pattern:
A clear Falling Wedge is identified using two converging trendlines (red).
Within the wedge, price completed a potential AB=CD harmonic structure, bottoming out near ₹1,891.
The breakout candle has closed above the upper trendline, signaling early strength.
🔍 Key Price Levels:
Support Zone: ₹1,891.80 (marked in red)
Immediate Resistance: ₹1,933.00 (green horizontal line)
CMP: ₹1,917.70
A sustained move above ₹1,933 may open room for further upside, potentially towards the ₹1,960–₹1,980 range as per the chart projection.
📊 Volume Analysis:
Noticeable pickup in green volume bars on the breakout candle.
This confirms growing interest and participation from the bulls.
🧠 Observational Bias:
As long as the price holds above ₹1,891 and sustains the breakout, the short-term trend appears to be tilting in favor of buyers. A retracement or retest of the wedge breakout zone may offer additional confirmation.

Bajaj Finance on flag n pole break out.Bajaj fin. is trading in Flag n pole pattern. Break out done near 8000 level.
As per chart target for this patten would be 10500 and 11850 soon.
It is at demand zone can add more on any correction.

Tech Mahindra Q4 Earnings Highlights: #TECHM
Tech Mahindra Q4 Earnings Highlights: #TECHM
• Net Profit: ₹1,166.7 Cr-
Up 18.7% QoQ (vs *983.2 Cr) •
Revenue: *13,384 Cr - Up 0.7% QoQ (vs *13,285.6 Cr)
⚫ EBITDA: *1,378 Cr-Grows 2.1% QoQ (vs *1,350.2 Cr)
⚫ EBITDA Margin: 10.3%, Slightly Up from 10.2% QoQ
Technical Analysis Summary:
The stock made a recent high of ₹1,810.
*1,210.
It was in a downtrend but has reversed from a strong support level at
Currently trading at ₹1,445, the stock has formed a Doji candle, indicating a balance between buying and selling pressure.
A break below *1,430-₹1,425 may signal increased selling pressure and potential downward movement.
Conversely, a break above ₹1,465-₹1,470 may trigger buying momentum
and a potential upward move.
