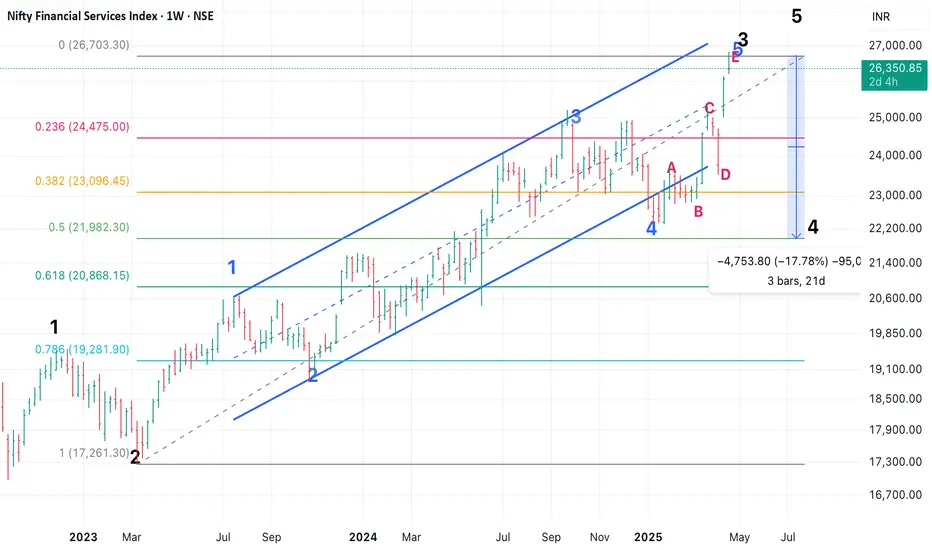
Nifty Financial Services - EW Analysis - Good RR ShortNifty Financial Services showed resilience in the entire fall and led the way up in recovery as it had a 5 of 3 up (from March 23 lows) pending, which got done in Nifty and most other indices in Dec 2023.
Now it has completed that 4 and should lead on the way down. Expecting at least a 14% correction in index till 23150 (38.2% retracement). Next target will be 22020 (50% retracement).
My bet is on 50% retracement, as Bajaj Twins and HDFC Bank and ICICI Bank have completed a corrective bounce and should test/ break recent lows.
Bajaj Twins have much larger correction possibility. Will share in other posts.
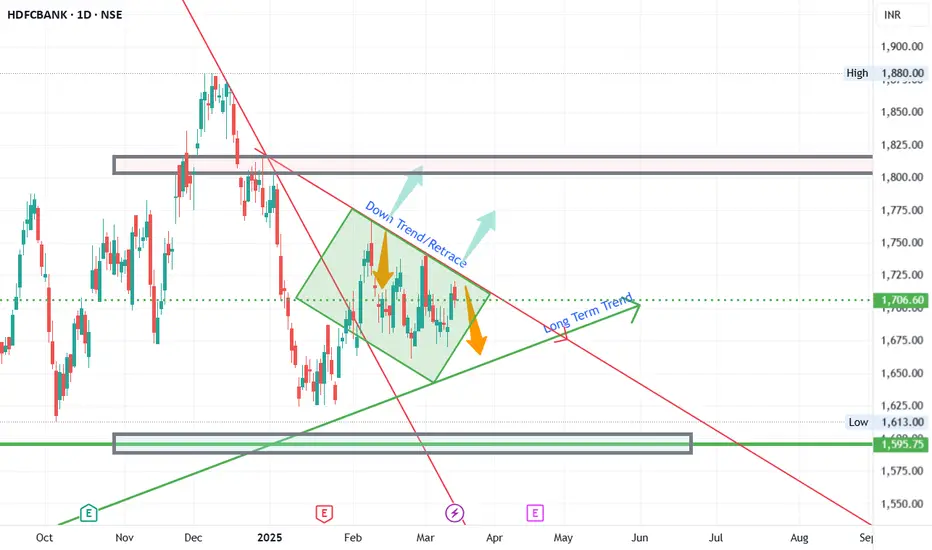
HDFCBANK
Fino payment bank is on bullish reversal mode.Fino payment bank is on bullish reversal mode.
As per chart it forms double bottom pattern with divergence and also showing confirmation of morning star on monthly chart.
It may test level 444 soon, 80% returns.

HDFCBANK RESISTANCE TRENDLINE BREAKOUTHdfcbank breaking #resistance trendline weekly basis
good volume building up last few week
trading at new ATH,RSI bullish
trading above all key ema
#q4results are good
#niftybank trading at ATH
soon can touch #target 2000

Banks in focus, chart: 2 HDFCChart -> SBI Daily
All time high breakout with run-away gap.
CMP: 1906
Good Range to Buy: 1920 to 1880
Targets: 1985, 2036
SL: 1855 Daily Close
Disclaimer: This is for educational purposes only, not any recommendations to buy or sell. As I am not SEBI registered, please consult your financial advisor before taking any action.

HDFC Bank - Long Term AnalysisFundamentals/Basis:
HDFC Bank is an important scrip that need to be monitored on long term basis, if we invest or not.
This is due to the fact, as a leader in the banking industry and a heavy weight company in the Nifty and bank nifty constituencies, HDFC bank provides clues to the overall market direction (most of the times)
This analysis is for Long term and if time permits, will keep updating throughout the year.
Technicals :
HDFC bank fell from its highs since end of 24 until jan. And had a retracement until approximately 1770 and formed a retracement trend direction.
Current range : 1600 to 1800 with 1700s as pivots.(Not formula but based on charts)
Trade Ideas :
If the price moves above the retracement line and sustains, go for long in the stock. Once it breaks lookout for confirmation at this trendline and also at the Long term trendlines for any retests.
Alternatively, if the price falls below the Long term trend direction, wait for confirmation on the bullishness.
Disclaimer : All the views and analysis provided are my personal analysis. Not a SEBI registered analyst. Plan and trade as per your analysis
If you Like the Analysis and agree with , Hit the Boost button and share your views agreements/constructive feedback in the comments.
Would you like me provide any of your favorite stocks analysis, let me know in the comment.
Advanced Patterns Trading Chart patterns are visual representations of price movements used in technical analysis to predict future market behavior, categorized as continuation, reversal, or bilateral, and can signal potential trend continuation, reversal, or volatility.
Top Picks: The Most Successful, Profitable, and Reliable Chart Patterns
Head and Shoulders Pattern.
Double Tops and Double Bottom.
Cup and Handle.
Ascending/Descending Triangles.
Bullish and Bearish Flags.
Wedge Patterns (Rising/Falling Wedges)
Triple Tops and Triple Bottoms.
Symmetrical Triangles.

Kotak bank consolidation breakoutKotak bank breaking out from consolidation rectangle pattern of about 3.18Y. Rectangle is a continuous pattern and likely to continue the uptrend. Soon ATH breakout and would reach 161.8% fib level after pivot target of 2376.5. RSI also had a clear breakout in weekly timeframe. Also higher timeframe looks good.

HDFC Bank - Swing Trade NSE:HDFCBANK is looking Super Strong on the Daily time frame after forming a perfect base today it broke out and closed significant levels with MACD and RSI Trending Upwards it Can retest its ATH Levels soon.
About:
NSE:HDFCBANK is an Indian banking and financial services company headquartered in Mumbai. It is India's largest private sector bank by assets and the world's tenth-largest bank by market capitalization as of May 2024.
As of April 2024, NSE:HDFCBANK has a market capitalization of $145 billion, making it the third-largest company on the Indian stock exchanges. It is India's one of 3 systemically important banks with a 15% market share in the banking sector’s advances and a 37% market share in the private sector banks’ advances as of FY24.
F&O Activity:
Short's Getting Covered in Futures with decreasing OI with 1740 CE OI covering Significantly.
Trade Setup:
Buy on Dips if Possible Near Base Levels or Start with a Few Qty to see the momentum if continues further Sharply or Consolidates.
Target(Take Profit):
Ideally around ATH Levels near 1860 to 1880 Levels
Stop Loss:
Entry Candle Low for Swing Traders and Swing Low Base Formed as Mentioned for Positional and Buy on Dips Traders.
📌Thank you for exploring my idea! I hope you found it valuable.
🙏FLLOW for more
👍BOOST if useful
✍️COMMENT Below your views.
Meanwhile, check out my other stock ideas on the right side until this trade is activated. I would love your feedback.
Disclaimer: "I am not SEBI REGISTERED RESEARCH ANALYST AND INVESTMENT ADVISER."
This analysis is intended solely for informational and educational purposes only and should not be interpreted as financial advice. It is advisable to consult a qualified financial advisor or conduct thorough research before making investment decisions.

Advanced Swing Trading Strategy with Pcr Part-2The Put-Call Ratio (PCR) is a popular technical indicator used by investors to assess market sentiment. It is calculated by dividing the volume or open interest of put options by call options over a specific time period. A higher PCR suggests bearish sentiment, while a lower PCR indicates bullish sentiment.
So, an average put-call ratio of 0.7 for equities is considered a good basis for evaluating sentiment. In general: A rising put-call ratio, or a ratio greater than 0.7 or exceeding 1, means that equity traders are buying more puts than calls. It suggests that bearish sentiment is building in the market.

Trading with Professionals Identifying the trend. This is the first step in technical analysis for traders because trading strategies can either follow the trend or go against the trend. ...
Drawing support and resistance levels. ...
Establishing entry and exit points. ...
Position sizing and risk management.
What exactly are the two types of technical analysis? Chart patterns and technical (statistical) indicators are the two main types of technical analysis. Chart patterns are a subjective type of technical analysis in which technicians use certain patterns to indicate regions of support and resistance on a chart.

Support and Resistance Part -2What is the best support and resistance setting?
Rules For Drawing Support and Resistance
Use swing highs and swing lows in the market to your advantage. ...
Don't worry if the highs and lows don't line up perfectly. ...
Focus on the major (key) levels in the market. ...
Stay within a six-month window.
Tube resistance bands work great for almost any kind of exercise. They're the ultimate solution when it comes to anchored workouts to focus on isolation exercises, and they'll be useful in both upper and lower-body exercise.

Technical Analysis Advanced candlesticks These advanced candlesticks are associated with strong price moves, and often gaps, which cause sharp shifts in direction. Traders can participate by noticing these patterns and acting quickly to get in as the price moves in the new direction. Candlestick patterns do not have price targets, which means traders shouldn't get greedy.

Support and Resistance Part 1A support and resistance level is simply a level in a market at which traders find a price to be overvalued or undervalued depending on current market dynamics. This creates a level in the market that can act as support or resistance depending on various factors surrounding each currency.
When it comes to charting support and resistance levels, keep it tidy and focus on the levels closest to your current price action. If you start scribbling levels all over the place, your chart will look like a toddler’s doodle, and you’ll lose track of which levels to keep an eye on and which ones carry more weight.
Support Zones: Rather than a precise price point, support is usually identified as a price zone. Within this zone, numerous market participants often place their buy orders. And a resistance level is a point where it’s likely to stop rising and start falling – these are always located ABOVE the current price.

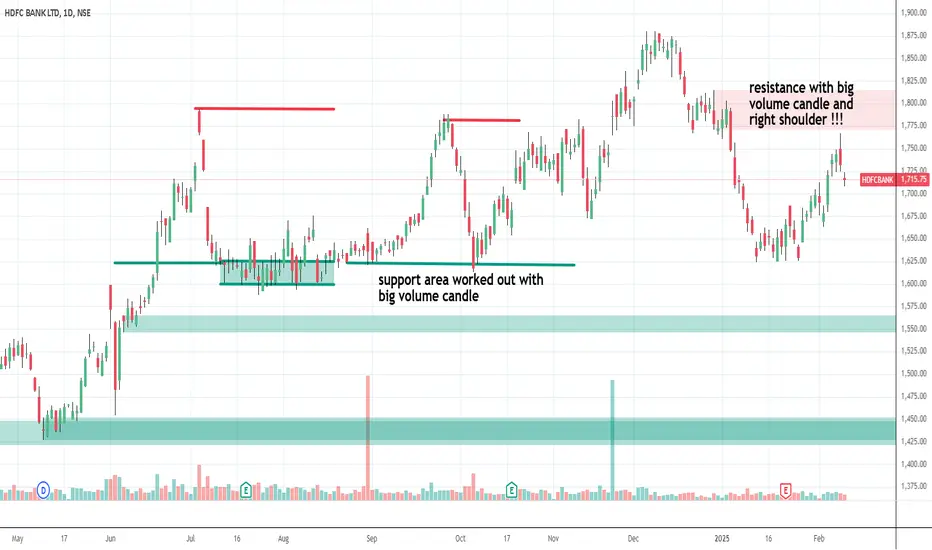
HDFC Bank - Exit with profitsHDFC bank was number 1 safe investments with sure profits due to MSCI money flow, It worked out well. support area with big volume candle given second opportunity to enter long. But now price is forming right shoulder for head and shoulder pattern and price is below resistance area with same big volume candle indicating bearish view now. It might re test support and based on action at previous support only we can say will price rise or not again. so its better to book profits and stay away from HDFC for now.
HDFC BANK LIMITED set to move upHDFC bank limited is having support at multiple timeframe and consolidating for some time.
looks good to buy cmp with sl below 1600.

Technical AnalysisTechnical analysis is a means of examining and predicting price movements in the financial markets, by using historical price charts and market statistics. It is based on the idea that if a trader can identify previous market patterns, they can form a fairly accurate prediction of future price trajectories.
Technical analysis is a strategy for predicting movement in the stock market, or other securities markets, that relies on information from short periods of time. For this reason, day traders or other short-term traders often use technical analysis.

MACD Divergence TradingMoving average convergence/divergence (MACD) is a technical indicator to help investors identify entry points for buying or selling. The MACD line is calculated by subtracting the 26-period exponential moving average (EMA) from the 12-period EMA. The signal line is a nine-period EMA of the MACD line.
The indicator is calculated by subtracting a 26-period Exponential Moving Average from the 12-period moving average. There is also a histogram available on the indicator which can also be used as a divergence indicator. As a result, you will then see the MACD line, which shows as an indicator below the price chart.

Option Trading Options are a type of contract that gives the buyer the right to buy or sell a security at a specified price at some point in the future. An option holder is essentially paying a premium for the right to buy or sell the security within a certain time frame.
When options are better. Options can be a better choice when you want to limit risk to a certain amount. Options can allow you to earn a stock-like return while investing less money, so they can be a way to limit your risk within certain bounds. Options can be a useful strategy when you're an advanced investor.

Advanced Swing TradingThe Put-Call Ratio (PCR) is a popular technical indicator used by investors to assess market sentiment. It is calculated by dividing the volume or open interest of put options by call options over a specific time period. A higher PCR suggests bearish sentiment, while a lower PCR indicates bullish sentiment.
However, no PCR can be considered ideal, but usually, a PCR below 0.7 is typically viewed as a strong bullish sentiment while a PCR more than 1 is usually considered as a strong bearish sentiment.

Technical Analysis Technical analysis is a means of examining and predicting price movements in the financial markets, by using historical price charts and market statistics. It is based on the idea that if a trader can identify previous market patterns, they can form a fairly accurate prediction of future price trajectories.
What exactly are the two types of technical analysis? Chart patterns and technical (statistical) indicators are the two main types of technical analysis. Chart patterns are a subjective type of technical analysis in which technicians use certain patterns to indicate regions of support and resistance on a chart.

Option TradingOptions are a type of contract that gives the buyer the right to buy or sell a security at a specified price at some point in the future. An option holder is essentially paying a premium for the right to buy or sell the security within a certain time frame.
When options are better. Options can be a better choice when you want to limit risk to a certain amount. Options can allow you to earn a stock-like return while investing less money, so they can be a way to limit your risk within certain bounds. Options can be a useful strategy when you're an advanced investor.

TradingOne of the most effective ways of studying is to carve space out between sessions. If you break up your study load over several days, you'll retain information far more readily than if you crammed it into your head during one long session.
Day trading and swing trading are two very different approaches to short-term investing. If you're more interested in an exciting, higher-risk environment that requires greater attention, day trading is better for you. Otherwise, the slower, more methodical path of swing trading might be a better option.

Advanced Database TradingOptions trading is a type of financial trading that allows investors to buy or sell the right to purchase or sell an underlying asset at a fixed price, at a future date. Options trading operates on the basis that the buyer has the option to exercise the contract but is not under any obligation to do so.
Option trading is largely a skill requiring knowledge of market trends, strategies, and risk management techniques. While there is an element of uncertainty in the markets, successful traders rely on analysis, planning, and discipline rather than luck.18 Dec 2024
