SBIN 1D Time frameCurrent Facts
Price is trading around ₹854–₹861.
In the past 52 weeks, it has moved between ₹680 (low) and about ₹875–₹880 (high).
Recently, the stock has shown a positive trend, moving up slowly but facing resistance near the higher levels.
🔍 Support & Resistance Zones
Immediate Support: ₹840–₹846 (if it stays above this, trend remains safe).
Stronger Support: ₹820–₹830 (this is the fallback level if the first support breaks).
Immediate Resistance: ₹860–₹869 (the stock is struggling to cross this zone).
Higher Resistance: ₹880–₹900 (if it breaks out strongly, these are the next targets).
⚙️ Technical View
Trend is positive to neutral — buyers are active but sellers are pushing back at resistance.
Momentum is moderate — not too weak, not too overheated.
A decisive breakout above ₹869 with volume can give a rally toward ₹880–₹900.
⚠️ Risks
If the price falls below ₹840, there is a chance of decline toward ₹820–₹830.
Weak breakout attempts without strong buying may cause sideways movement.
🔮 Possible Scenarios
Bullish: Strong move above ₹869 → targets ₹880–₹900.
Range: Stock stays between ₹840–₹860.
Bearish: Break below ₹840 → fall toward ₹820–₹830.
HDFCBANK

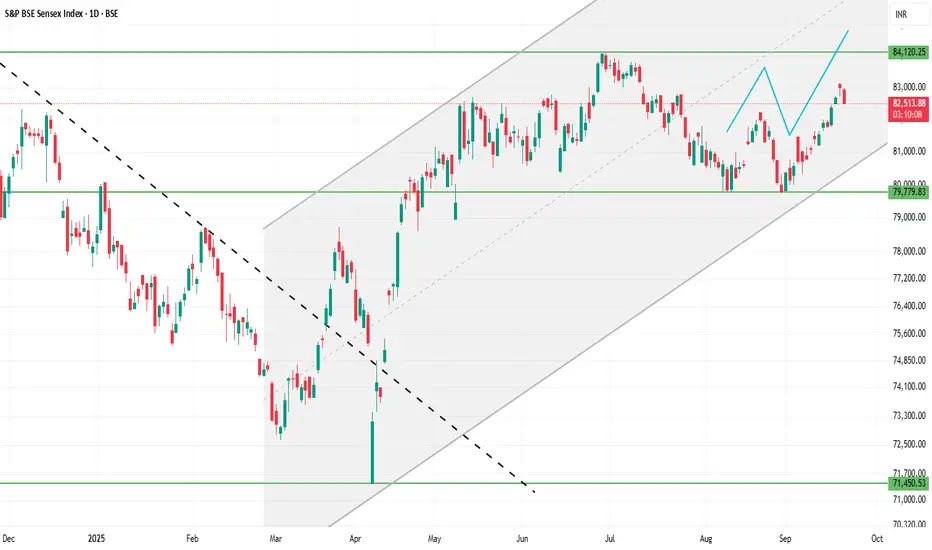
SENSEX 1D Time frameCurrent Facts
Current Level: 82,590.45 - 82,616.13
Trend: Mildly bullish; trading above short-term moving averages (20-day & 50-day EMA).
Momentum Indicators:
RSI (14-day): ~60 → bullish but not overbought.
MACD: Positive → supporting the uptrend.
Price Action: Daily candles show small upper wicks → minor profit-taking near resistance.
⚙️ Outlook
Bullish Scenario:
Holding above 82,450 → retest 82,650–82,700 and possibly 82,850–82,900.
Range / Consolidation:
Price oscillates between 82,400 – 82,650 → sideways trading likely.
Bearish Scenario:
Close below 82,400 → downside risk toward 82,250–82,300 or lower.
⚠️ Key Facts
82,500–82,600 acts as a short-term pivot: above it favors bulls, below it favors bears.
Resistance at 82,650–82,700 is key; breakout here may trigger further upside.
Support at 82,400–82,450 is critical; failing to hold may lead to short-term correction.
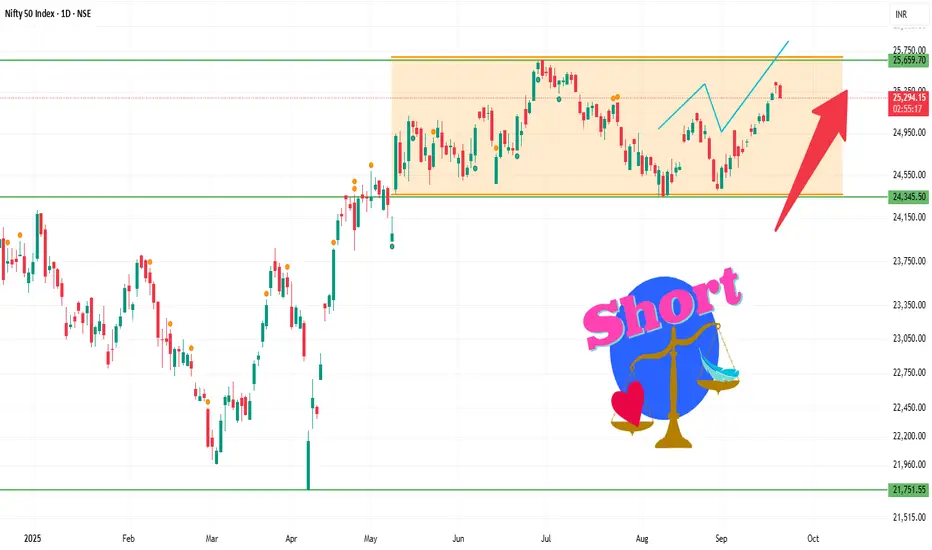
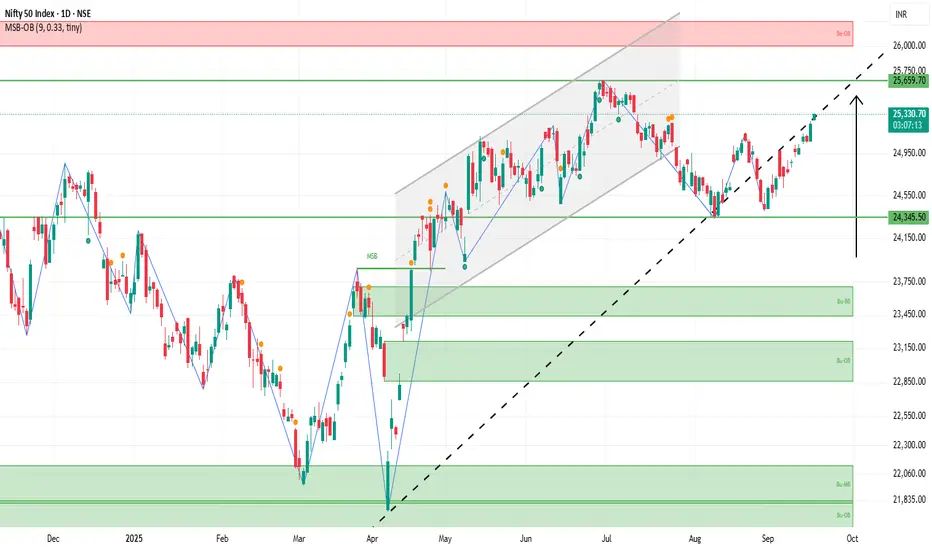
Nifty 1D Time frameCurrent Facts
Current Level: ~25,300–25,310
Trend: Mildly bullish; Nifty is trading above short-term moving averages (20-day & 50-day EMA).
Momentum Indicators:
RSI (14-day): ~60 → positive but not overbought.
MACD: Positive → supports short-term bullish bias.
Price Action: Daily candles show small upper wicks → slight profit-booking near resistance levels.
⚙️ Outlook
Bullish Scenario:
Holding above 25,270 → retest 25,350–25,370 and possibly 25,420–25,450.
Range / Consolidation:
Price oscillates between 25,270 – 25,350 → sideways action expected.
Bearish Scenario:
Close below 25,250 → downside risk toward 25,180–25,200 or lower.
⚠️ Facts
25,300–25,310 acts as a short-term pivot — above it favors bulls, below it favors bears.
Immediate resistance is at 25,350–25,370; breakout here can trigger upside momentum.
Support at 25,250 is crucial; failure to hold may result in deeper correction.
Smart Money Play: Watching HDFC Bank’s Bullish ZoneTrading Idea: HDFC Bank (NSE: HDFCBANK)
Price is currently trading around ₹976 after a recent pullback.
Key Observations:
Break of Structure (BOS) confirms bullish market structure.
Liquidity sweep around recent highs.
Daily Fair Value Gap (FVG) spotted between ₹910–₹930.
Bullish Order Block at ₹800–₹830 acting as strong higher timeframe support.
Plan:
Expecting a retracement into the Daily FVG zone (₹910–₹930).
If price reacts bullishly here, potential upside rally towards ₹1,040+.
Confirmation: Look for bullish reversal candles or demand zone rejections inside FVG.
Risk Management:
Aggressive entry: near FVG zone (₹910–₹930).
Conservative entry: only after bullish confirmation.
Stop-loss: below ₹890.
Targets: First TP at ₹990, extended TP at ₹1,040.
Bias: Bullish (after retracement).
Disclaimer: This is not financial advice. For educational purposes only. Please do your own research or consult with a financial advisor before making any investment decisions.

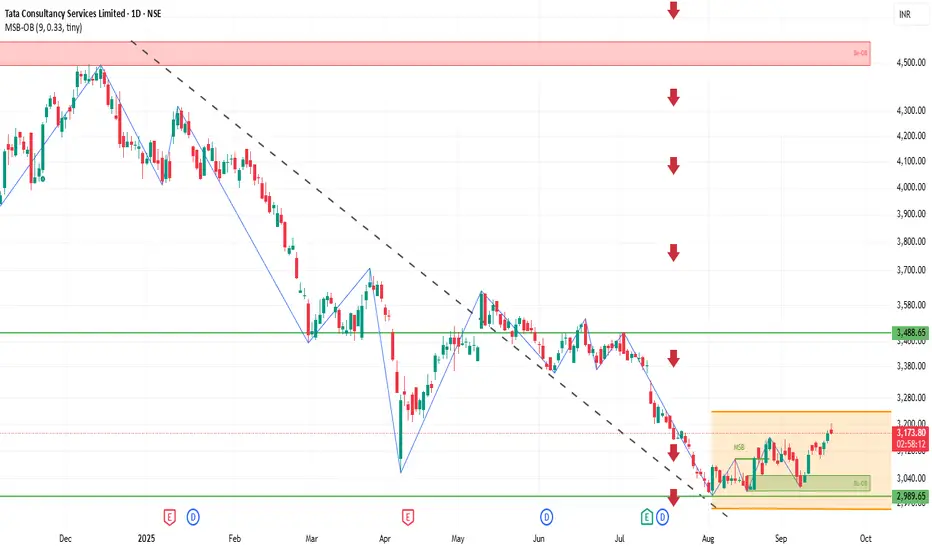
TCS 1D Time frameCurrent Snapshot
Price: ₹3,174
Stock has moved above earlier resistance zones (₹3,150 – ₹3,170).
Momentum looks positive, buyers are holding strength.
📌 Key Levels
Immediate Resistance: ₹3,190 – ₹3,200
Next Resistance: ₹3,220 – ₹3,250
Immediate Support: ₹3,150 – ₹3,160
Stronger Support: ₹3,100 – ₹3,120
✅ Outlook
If TCS sustains above ₹3,170, it can extend the rally toward ₹3,200 – ₹3,220.
If it slips back below ₹3,160, consolidation may happen around ₹3,120 – ₹3,150.
Larger trend remains bullish as long as price stays above ₹3,100.
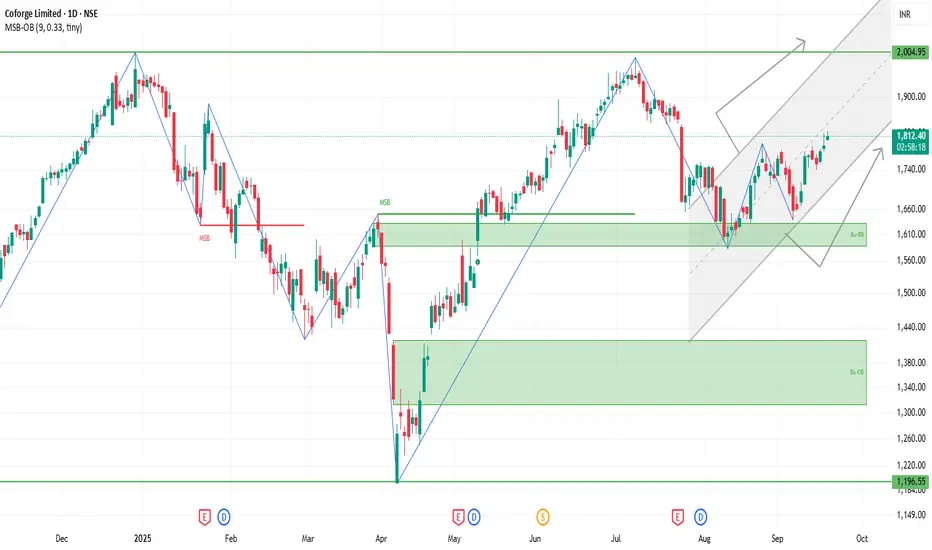
COFORGE 1D Time frameCurrent Snapshot
Price is trading near ₹1,812.
Stock is showing good strength above short-term and long-term moving averages.
Volatility is moderate, so sharp intraday swings are possible.
⚙️ Indicators / Momentum
Moving Averages: All key averages (short, medium, long) are bullish.
MACD / Momentum: Positive, supporting upside.
RSI: Slightly high, showing strength but near overbought zone → chances of small pullback.
📌 Key Levels
Immediate Resistance: ₹1,820 – ₹1,835.
Immediate Support: ₹1,790 – ₹1,800.
Stronger Support: ₹1,750 – ₹1,760 if weakness extends.
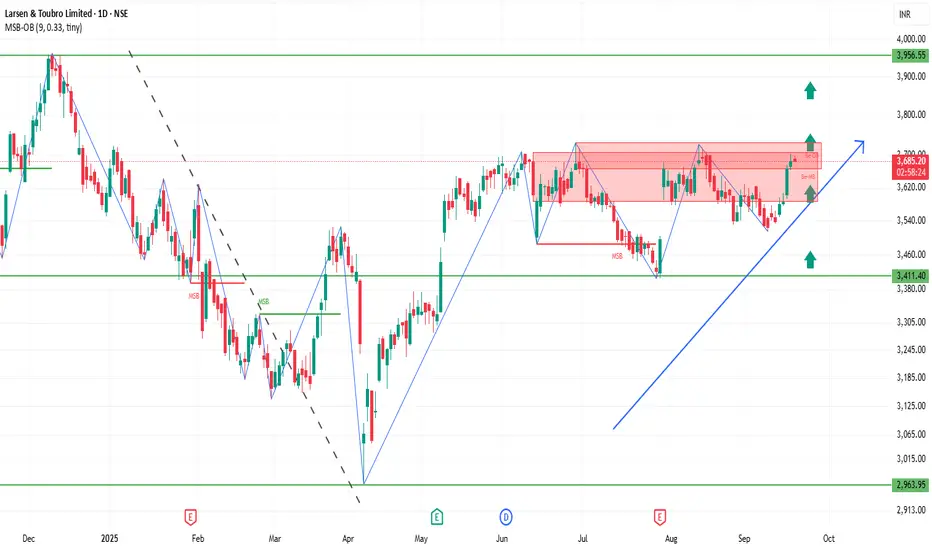
LT 1D Time frameCurrent Snapshot
Price: ₹3,695 (slightly higher than yesterday’s level).
Stock is holding near resistance but still above strong supports.
Trend is bullish to sideways.
📌 Key Levels
Immediate Resistance: ₹3,740 – ₹3,800.
Immediate Support: ₹3,650 – ₹3,670.
Stronger Support: ₹3,600, and deeper support near ₹3,100 on longer timeframe.
✅ Outlook
If LT sustains above ₹3,670, bulls remain strong and a breakout above ₹3,740 could push toward ₹3,800+.
If it falls below ₹3,650, then short-term weakness may test ₹3,600.
As long as it stays above ₹3,600, the larger trend remains intact.
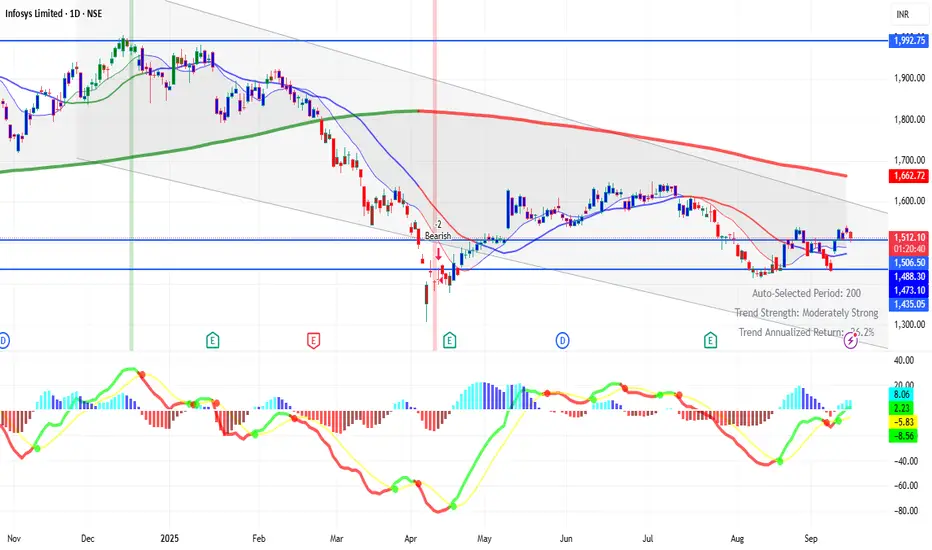
INFY 1D Time frameCurrent Snapshot
Price is trading near ₹1,545.
Stock is holding above the 50-day moving average, showing underlying strength.
Near medium-term averages (100-day and 200-day), so trend is stable with mild bullish bias.
⚙️ Indicators / Momentum
RSI (14): Mid-to-high range, showing steady strength but not overbought yet.
MACD: Positive, suggesting upward momentum is intact.
Overall Momentum: Slightly bullish with chances of consolidation near resistance.
📌 Key Levels
Immediate Resistance: ₹1,550 – ₹1,560.
Immediate Support: ₹1,510 – ₹1,520.
Stronger Support: ₹1,450 – ₹1,480 zone if bigger pullback happens.
✅ Outlook
As long as the stock stays above ₹1,510, trend remains bullish.
Breakout above ₹1,560 could open further upside targets.
If price slips below ₹1,510, short-term weakness may pull it toward ₹1,450 – ₹1,480.

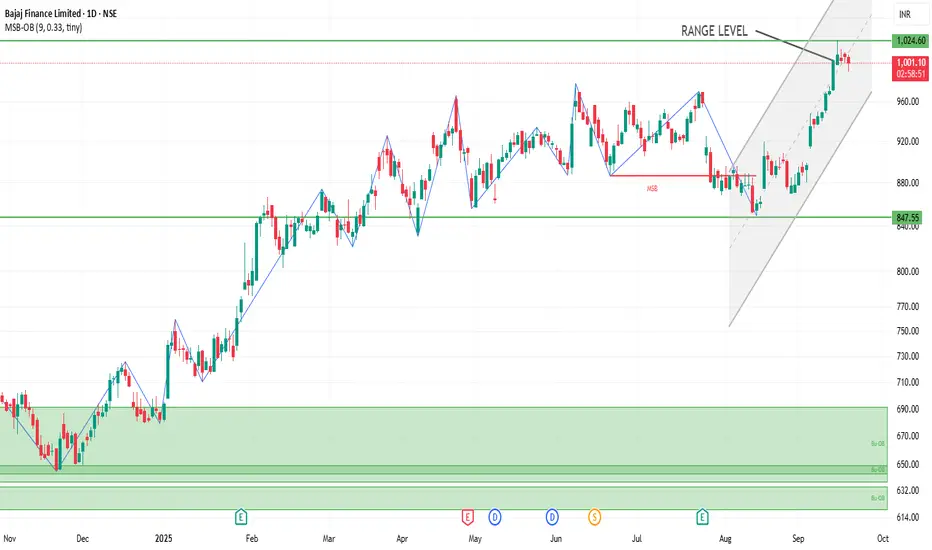
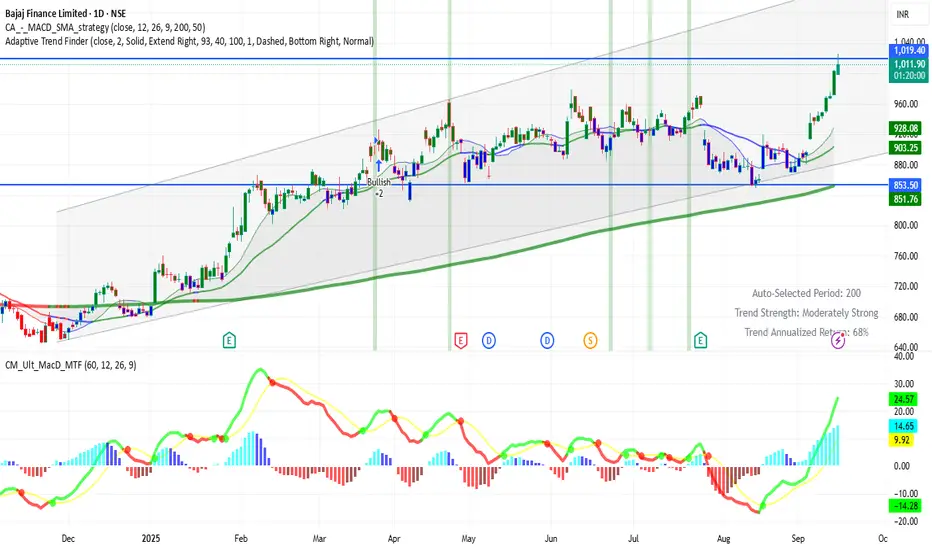
BAJFINANCE 1D Time frameCurrent Overview
Price is trading around ₹995 – ₹1,008.
Recently touched a 52-week high near ₹1,025.
Stock is moving above 50-day and 200-day moving averages, showing a strong uptrend.
⚙️ Indicators (Daily)
RSI (14) → Slightly overbought, but still stable.
MACD & Momentum → Mixed to positive, buyers still in control.
Volume → Strong volume seen near recent highs, showing active participation.
📌 Key Levels
Immediate Resistance: ₹1,010 – ₹1,025 (recent top).
Immediate Support: ₹995 – ₹1,000 (nearby cushion).
Stronger Support: ₹950 – ₹980 zone (50 & 100-day moving averages).
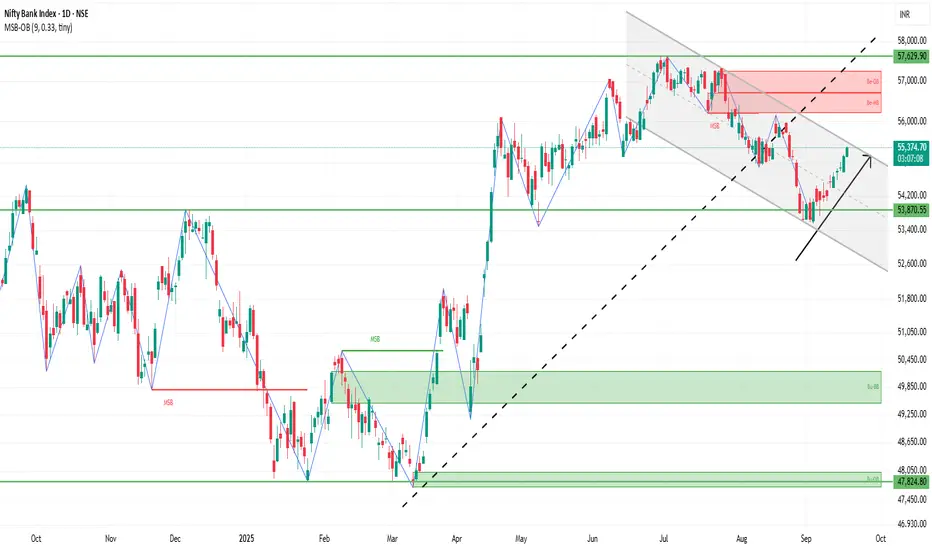
BANKNIFTY 1D Time frame📍 Current Price
BANKNIFTY is trading around 55,319.55, up 0.31% for the day.
🛑 Support Levels (Downside)
55,146.55: Recent low; immediate support.
55,000: Psychological level; key support zone.
54,777.75: Stronger support; breaking this may trigger a larger sell-off.
🔺 Resistance Levels (Upside)
55,397.05: Recent high; near-term resistance.
55,500: Round number resistance; next hurdle.
55,628.40: Strong resistance; breakout here may extend uptrend.
✅ Trend & Outlook
The trend is mildly bullish; price is above key support zones and moving averages.
Resistance is nearby; unless BANKNIFTY breaks 55,500–55,628 decisively, upward move may face pressure.
Downside risk exists if it falls below 55,146–55,000.
NIFTY 1D Time frame Today’s Nifty
Nifty is around 25,326.
It started higher than yesterday, so buyers are slightly stronger.
The trend is mildly bullish, not too strong.
Support (Where Nifty may stop falling)
25,229 → first safety net.
25,200 → key round number support.
25,000 → strong support; big drop if broken.
Resistance (Where Nifty may stop rising)
25,261 → small ceiling.
25,316 → bigger hurdle; breaking means bulls are strong.
25,350–25,360 → tough ceiling; breakout may continue uptrend.
Trend & Simple View
Mildly bullish now.
If Nifty breaks resistance, it may go higher.
If it falls below support, it may drop more.
Easy analogy: Nifty is like a ball bouncing between floor (support) and ceiling (resistance).
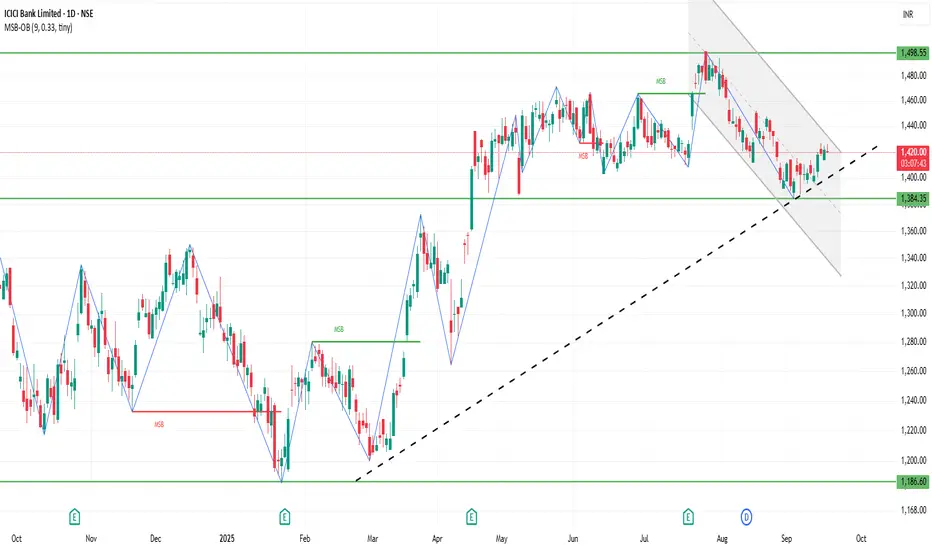
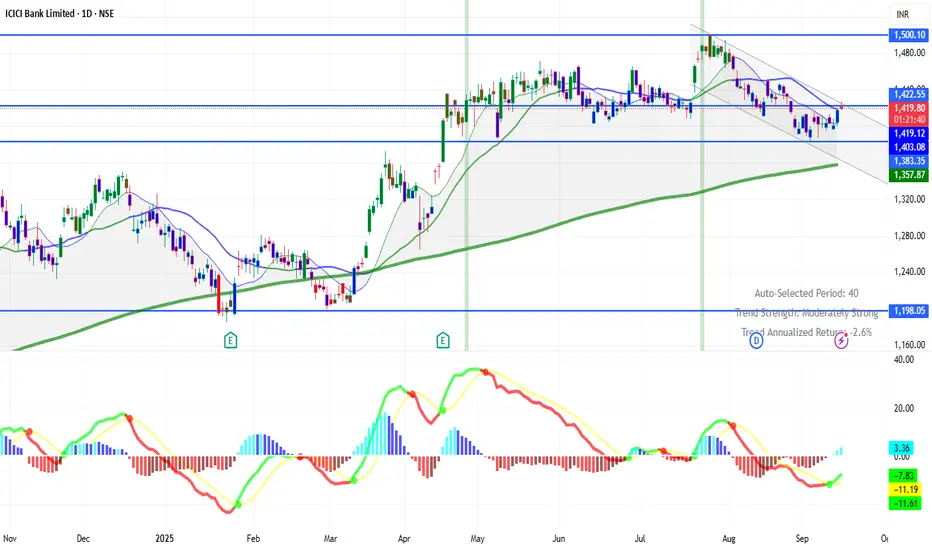
ICICIBANK 1D Time frameCurrent Stock Price
Current Price: ₹1,421.60
Day’s Range: ₹1,420.00 – ₹1,426.10
52-Week Range: ₹1,186.00 – ₹1,500.00
Market Cap: ₹10.17 lakh crore
P/E Ratio (TTM): 18.01
EPS (TTM): ₹74.05
Dividend Yield: 0.77%
Book Value: ₹436.67
📈 Trend & Outlook
Short-Term Trend: Bullish; the stock is trading near its 52-week high, indicating strong investor confidence.
Resistance Levels: ₹1,426.10 (day’s high), ₹1,500.00 (52-week high).
Support Levels: ₹1,420.00 (day’s low), ₹1,400.00 (psychological support).
Investor Sentiment: Positive, with strong institutional interest and favorable analyst outlooks.
🧭 Analyst Insights
Valuation: The stock is trading at a P/E ratio of 18.01, which is slightly below the sector average of 19.82, suggesting potential value.
Growth Prospects: The bank's strong earnings growth and robust capital position support its premium valuation.
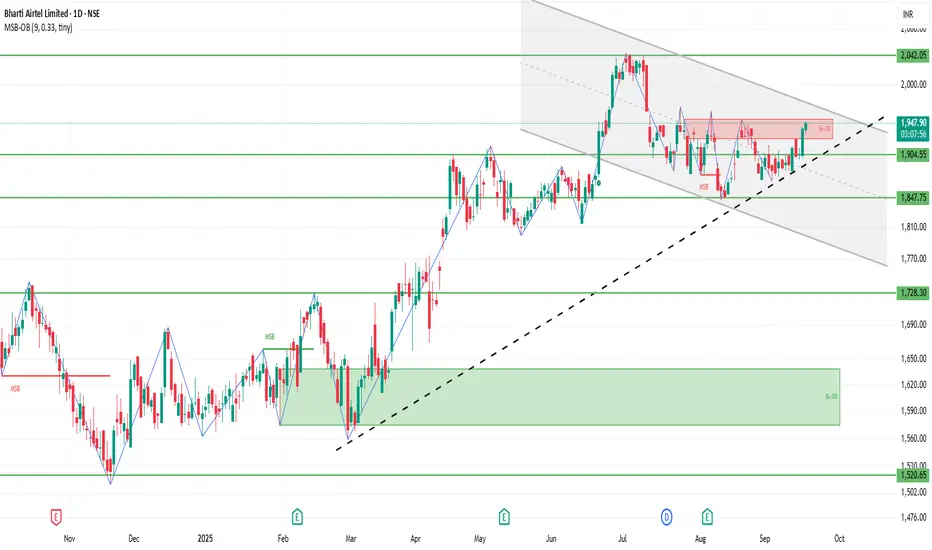
BHARTIARTL 1D Time frameCurrent Stock Price
Current Price: ₹1,944.50
Day’s Range: ₹1,933.25 – ₹1,944.85
52-Week Range: ₹1,510.80 – ₹2,045.80
Market Cap: ₹11.63 lakh crore
P/E Ratio (TTM): 31.89
EPS (TTM): ₹60.94
Dividend Yield: 0.82%
Book Value: ₹150.17
📈 Trend & Outlook
Short-Term Trend: Bullish; the stock is trading near its 52-week high, indicating strong investor confidence.
Resistance Levels: ₹1,944.85 (day’s high), ₹2,045.80 (52-week high).
Support Levels: ₹1,933.25 (day’s low), ₹1,910.00 (psychological support).
Investor Sentiment: Positive, with strong institutional interest and favorable analyst outlooks.
🧭 Analyst Insights
Valuation: The stock
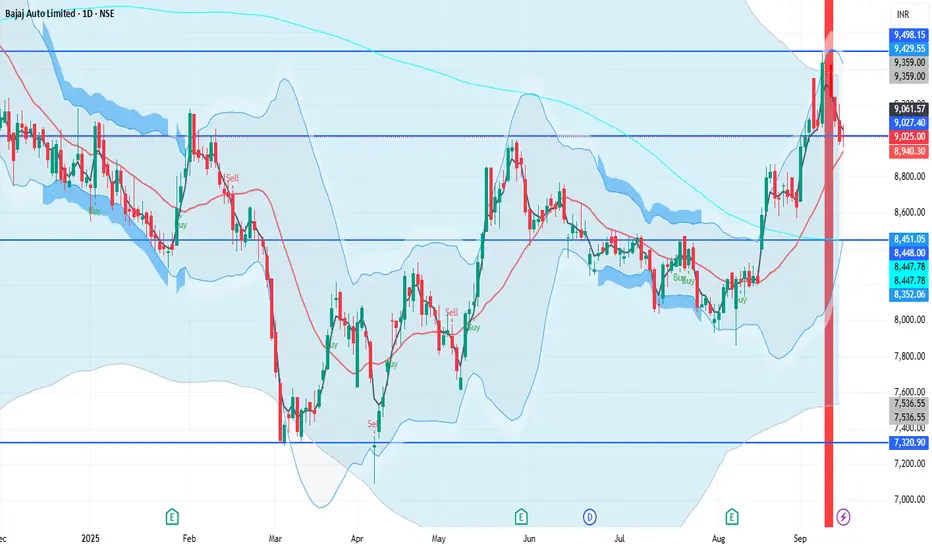
BAJAJ_AUTO 1D Time frameCurrent Price: ₹9,000 – ₹9,025
Day’s Range: ₹8,964 – ₹9,091.50
Previous Close: ₹8,999.50
🔹 Support & Resistance
Support 1: ₹8,950 – ₹8,900
Support 2: ₹8,800 – ₹8,750
Resistance 1: ₹9,050 – ₹9,100
Resistance 2: ₹9,200 – ₹9,250
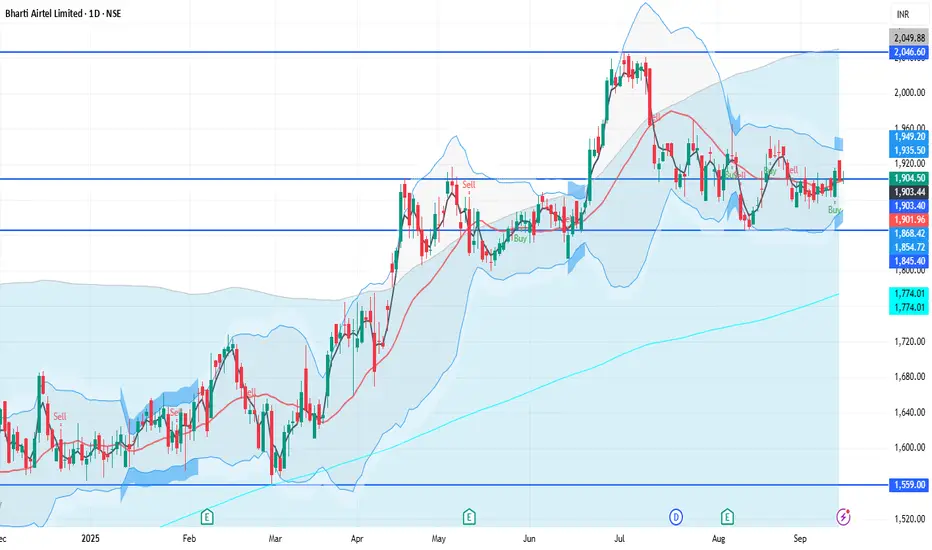
BHARTIARTL 1D Time frameUpdated Snapshot
Current Price: ₹1,903 – ₹1,906
Day’s Range: ₹1,901.60 – ₹1,925
Previous Close: ₹1,902.60
🔹 Support & Resistance
Support 1: ₹1,900 – ₹1,895
Support 2: ₹1,880 – ₹1,870
Resistance 1: ₹1,920 – ₹1,925
Resistance 2: ₹1,950 – ₹1,960
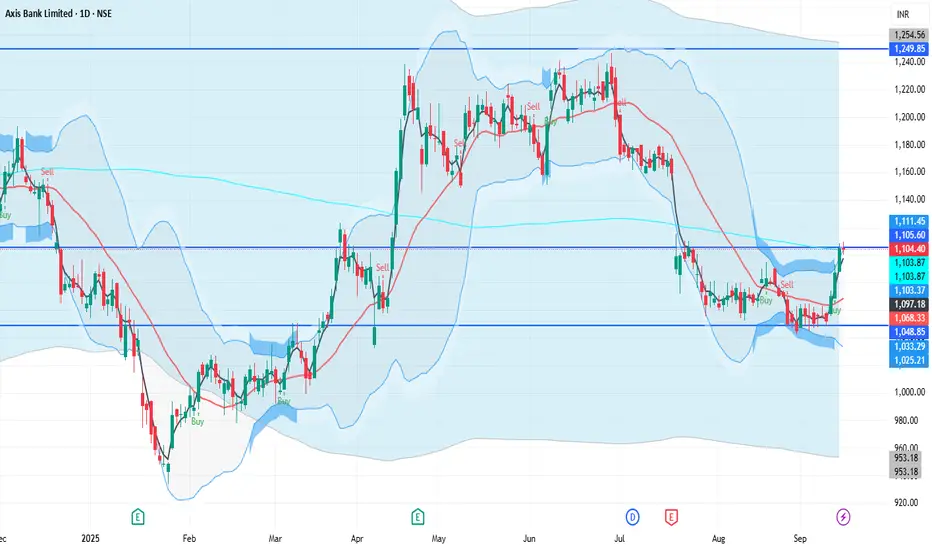
AXISBANK 1D Time frameUpdated Snapshot
Current Price: ₹1,105 – ₹1,107
Day’s Range: ₹1,101 – ₹1,110
Previous Close: ₹1,105.30
🔹 Support & Resistance
Support 1: ₹1,100 – ₹1,095
Support 2: ₹1,085 – ₹1,080
Resistance 1: ₹1,110 – ₹1,115
Resistance 2: ₹1,125 – ₹1,130
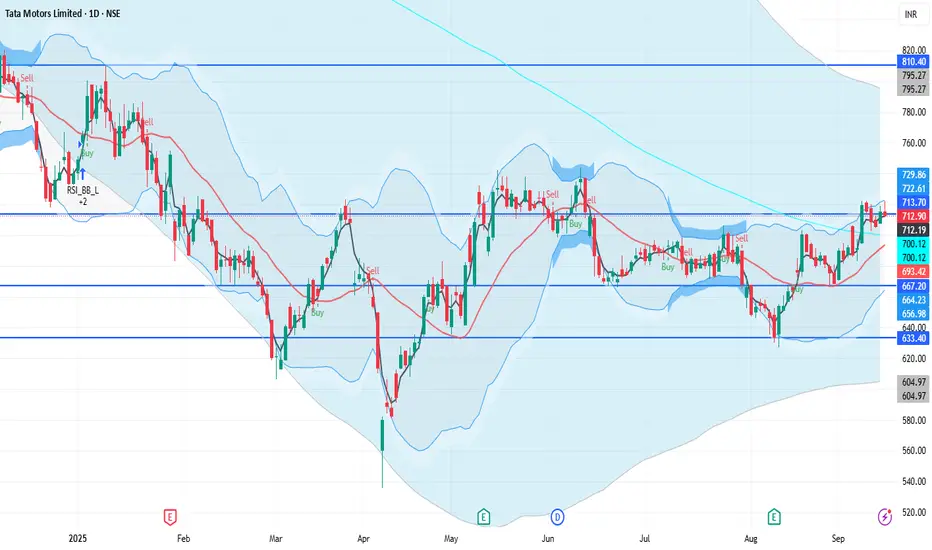
TATAMOTORS 1D Time frameUpdated Snapshot
Current Price: ₹712 – ₹715
Day’s Range: ₹712 – ₹721.95
Previous Close: ₹705.85
🔹 Support & Resistance
Support 1: ₹710 – ₹708
Support 2: ₹700 – ₹705
Resistance 1: ₹721 – ₹725
Resistance 2: ₹735 – ₹740
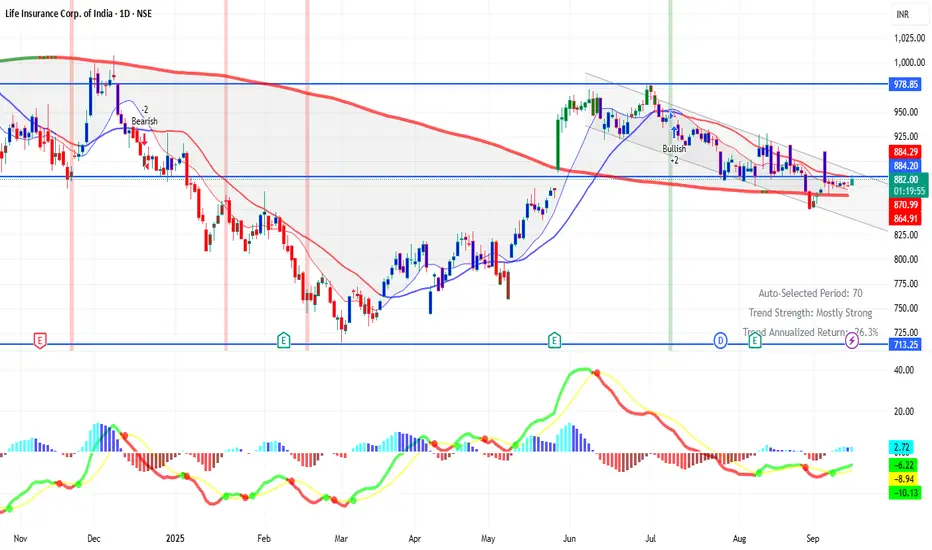
LICI 1D Time framePrice Action
Current Price: ₹882.50 (approx)
52-Week Range: ₹715.30 – ₹1,048.90
P/E Ratio: ~11.4
Book Value per Share: ~₹200+
🔹 Support & Resistance
Strong Support: ₹800 – ₹830
Immediate Resistance: ₹860 – ₹900
Next Resistance (medium-term): ₹1,000+
BAJFINANCE 1D Time frame
Current Price: ₹1018 (approx)
Day’s Range: ₹998 – ₹1,025.70
Previous Close: ₹970.25
🔹 Support & Resistance
Support 1: ₹981 – ₹960
Support 2: ₹947 – ₹934
Resistance 1: ₹1,030
Resistance 2: ₹1,049
INFY 1D Time frameCurrent Price: ₹1507 (approx)
Day’s Range: ₹1507 – ₹1543
Previous Close: ₹1509.10
🔹 Support & Resistance
Support 1: ₹1500
Support 2: ₹1490 – ₹1470
Resistance 1: ₹1539 – ₹1552
Resistance 2: ₹1560 – ₹1570
ICICIBANK 1D Time frameCurrent Price: ₹1,422 (approx)
Previous Close: ₹1,417.70
52-Week Range: ₹1,186 – ₹1,500
🔹 Support & Resistance (Daily)
Immediate Support: ₹1,390 – ₹1,392
Next Support: ₹1,360 – ₹1,365
Immediate Resistance: ₹1,407 – ₹1,415
Next Resistance: ₹1,416+
KOTAKBANK 1D Time frameCurrent Price: ₹1970.40 (approx)
Day Range: ₹1968 – ₹1981.60
Previous Close: ₹1972.30
🔹 Support & Resistance
Pivot: ₹1975.70
Resistance 1: ₹1983.40
Resistance 2: ₹1989.30
Resistance 3: ₹2002.90
Support 1: ₹1969.80
Support 2: ₹1962.10
Support 3: ₹1948.50

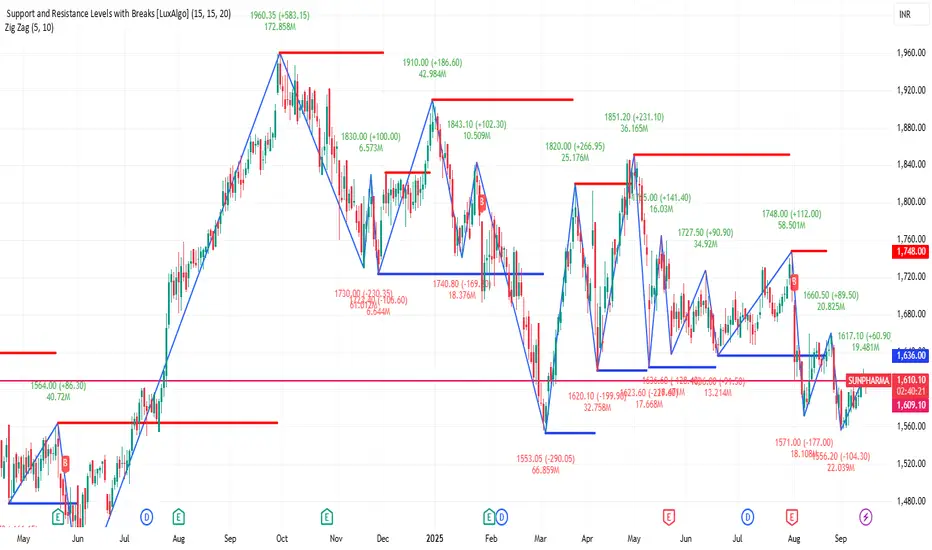
SUNPHARMA 1D Time frameUpdated Snapshot
Current Price: ₹1,607
Day’s Range: ₹1,595 – ₹1,617
Previous Close: ₹1,610
🔹 Support & Resistance
Immediate Support (S1): ₹1,600 – ₹1,595
Next Support (S2): ₹1,585 – ₹1,580
Immediate Resistance (R1): ₹1,615 – ₹1,617
Next Resistance (R2): ₹1,630 – ₹1,635