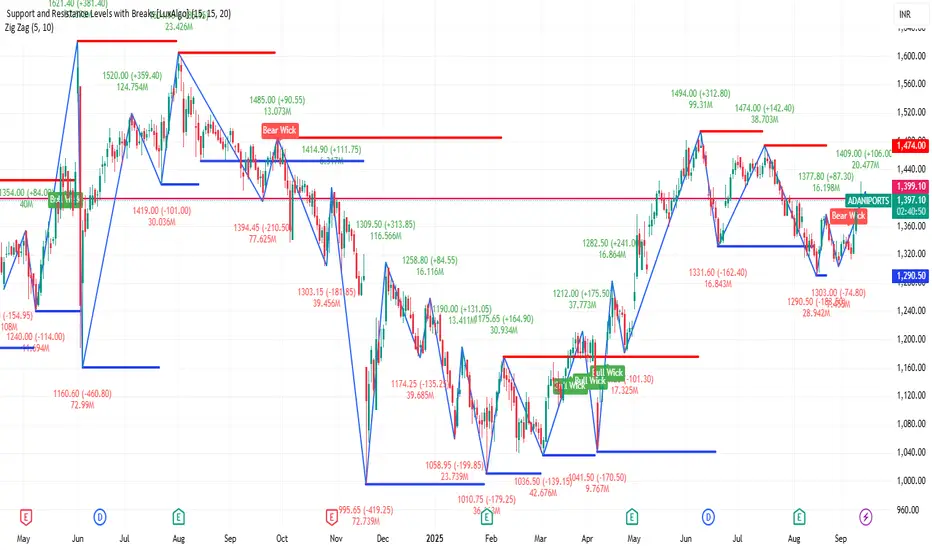
ADANIPORTS 1D Time frameUpdated Snapshot
Current Price: ₹1,399
Day’s Range: ₹1,391 – ₹1,406.50
Previous Close: ₹1,393.10
🔹 Support & Resistance
Support 1: ₹1,391 – ₹1,385
Support 2: ₹1,370 – ₹1,360
Resistance 1: ₹1,406 – ₹1,410
Resistance 2: ₹1,420 – ₹1,430
HDFCBANK
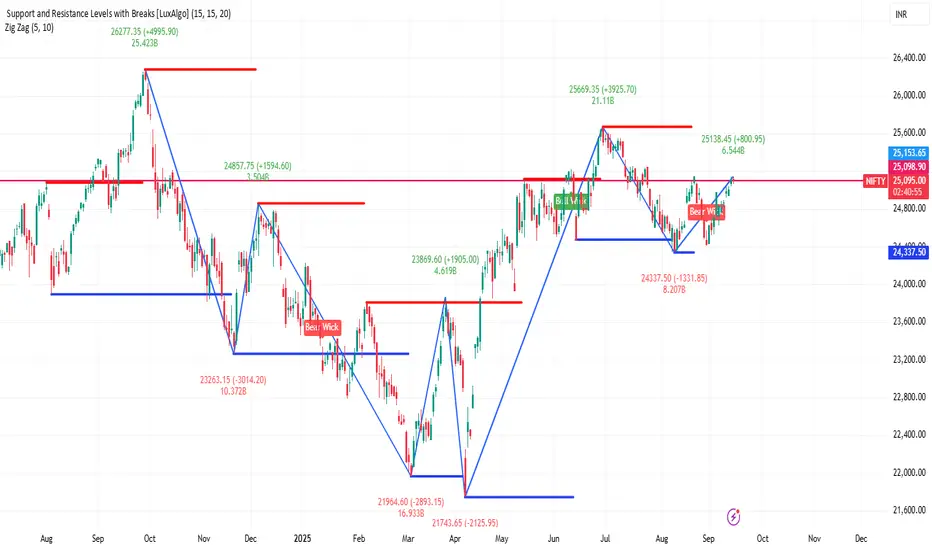
NIFTY 1D Time frameCurrent Price: ~25,085
Day’s Low: 24,900
Day’s High: 25,138
🔹 Support & Resistance (based on today’s range)
Support 1 (S1): 24,950 – 24,925
Support 2 (S2): 24,900 – 24,875
Resistance 1 (R1): 25,120 – 25,138
Resistance 2 (R2): 25,150 – 25,180
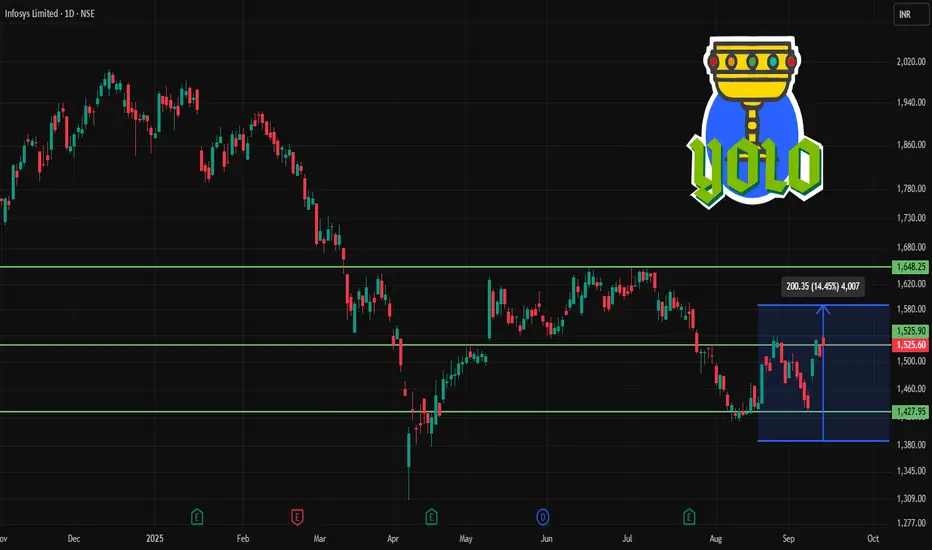
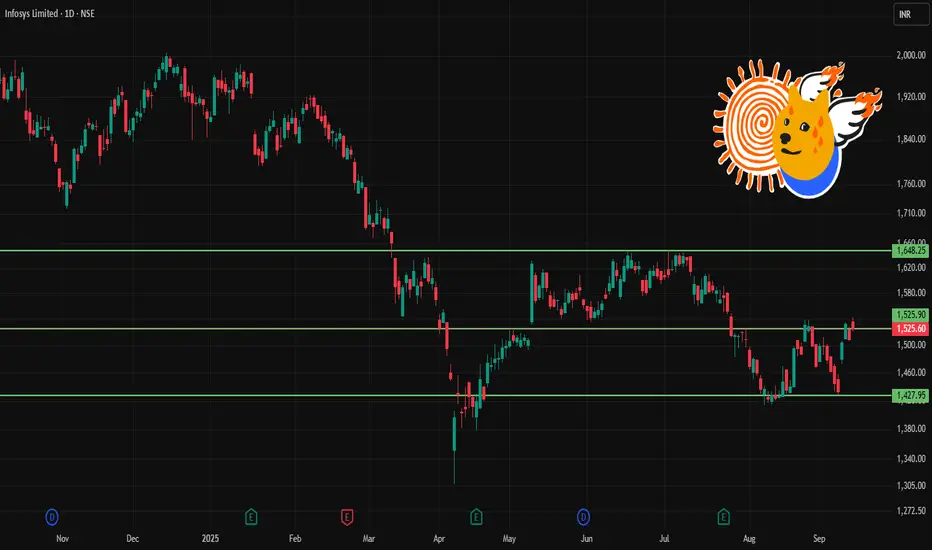
INFY 1D Time frameCurrent Price & Trend
Current Level: ~₹1,525
Trend: Neutral to bullish → stock is slowly recovering from recent lows.
Momentum: Buying support is visible near ₹1,500 zone.
Indicators
RSI: Around 59 → healthy, not yet overbought.
MACD: Positive crossover → signals upward momentum.
Moving Averages: Price is above short-term averages, but medium-term trend is still consolidating.
Bullish Scenario
If INFY sustains above 1,540, it can move toward 1,560 – 1,600.
A breakout above 1,600 could trigger further rally toward 1,650.
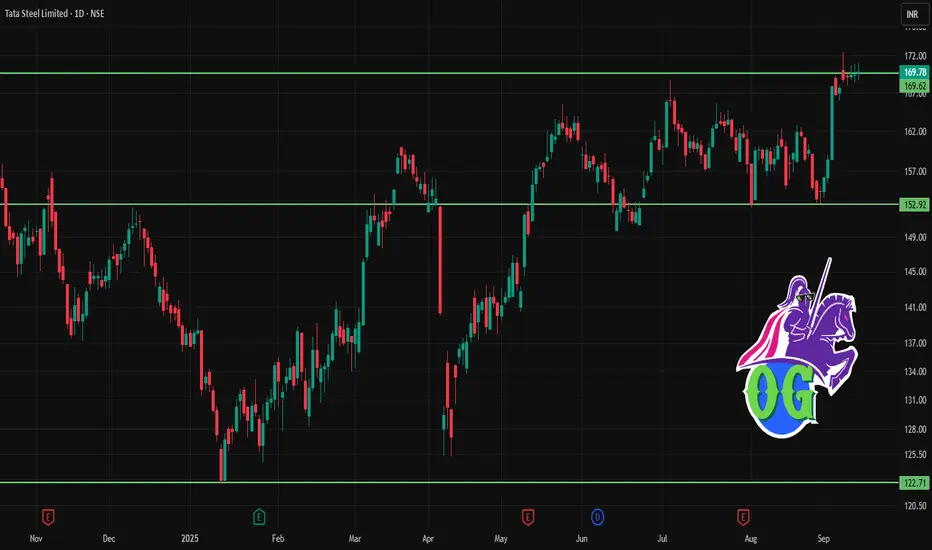
TATASTEEL 1D Time frameCurrent Price & Trend
Current Level: ₹169
Trend: Neutral to slightly bullish → stock is consolidating near support.
Momentum: Price is holding above strong support, but resistance is close.
RSI: Around 55 → neutral, leaning positive.
MACD: Flat to mildly bullish.
Moving Averages: Price is hovering around 20-day average; still above 50-day average → medium-term strength intact.
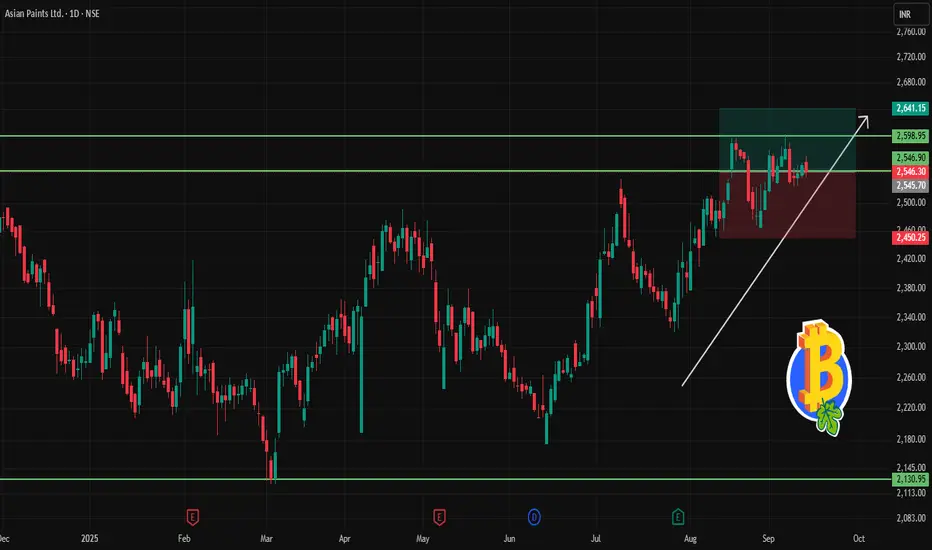
ASIANPAINT 1D Time frameCurrent Status
Price: ~ ₹2,546
It is well below its 52-week high (~₹3,394) and above its 52-week low (~₹2,125)
Market capitalization is large; the stock is considered a large-cap, stable name in decorative paints
Key Metrics
P/E (TTM) is high (≈ 67-70) → indicates expensive valuation relative to earnings
P/B is also elevated (≈ 12-13)
Return on Equity (ROE) ~ 18-20% — reasonable, not exceptional but solid
Bullish Scenario
If Asian Paints can reclaim and hold above ~₹2,550-₹2,600, it may move toward retesting higher resistance levels around ~₹2,750-₹3,000
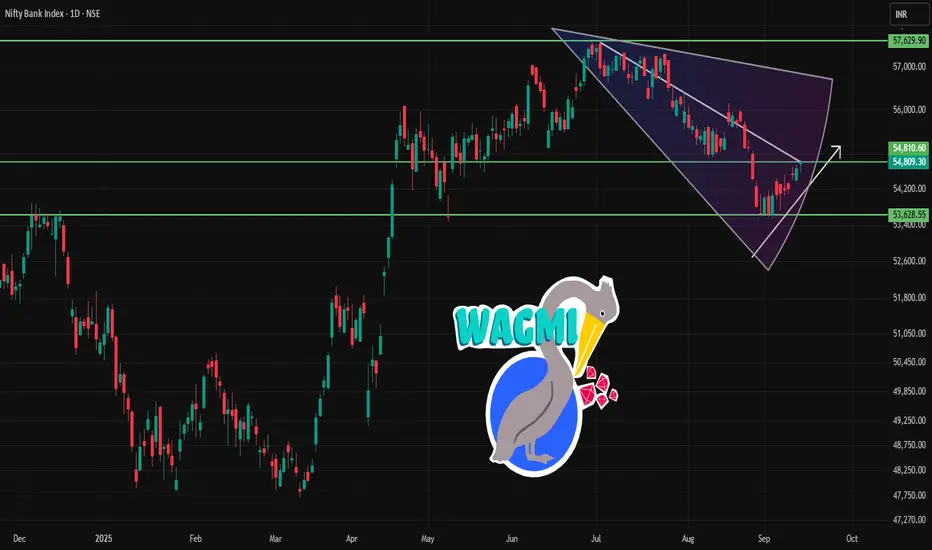
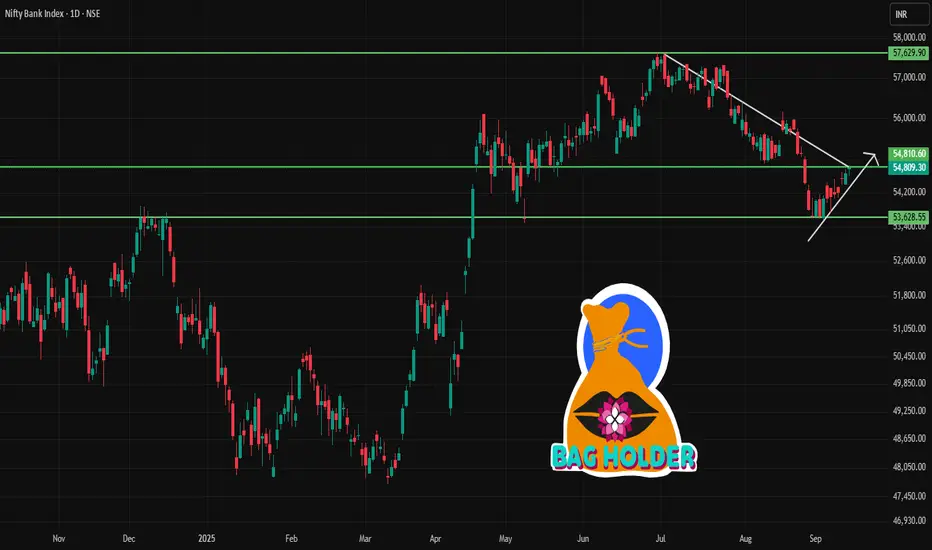
BANKNIFTY 1D Time frameCurrent Price & Trend
Current Level: 54,809
Trend: Neutral to mildly bullish
Range Context: Close to resistance zone, so movement here is crucial
Bullish Case
If Bank Nifty closes above 55,000–55,200, it can rally toward 55,500–55,700.
Sustained buying could push further toward 57,000 in coming sessions.
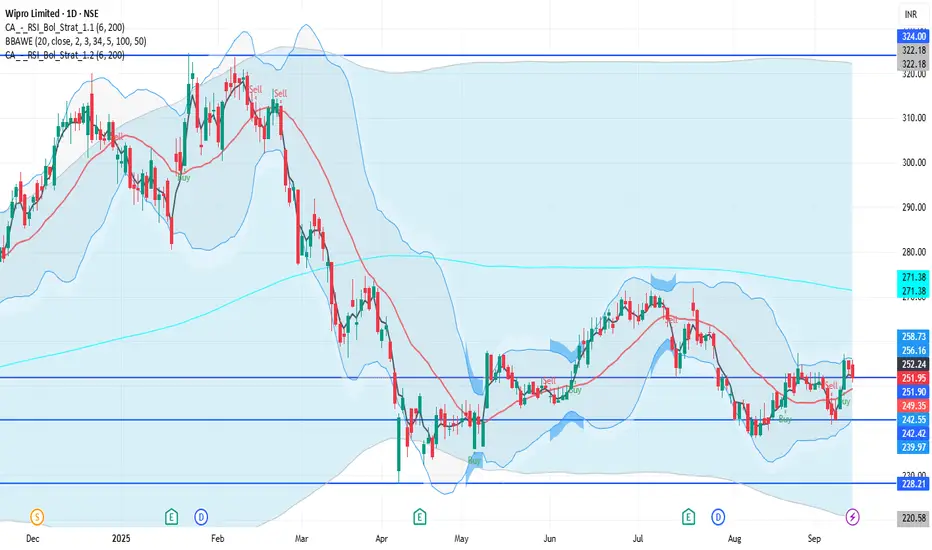
WIPRO 1D Time frameCurrent Price & Trend
Price: ₹251.95
Trend: Neutral; trading approximately 22.5% below its 52-week high of ₹324.60, reached on July 2, 2025.
Momentum: Indicators suggest a neutral to slightly bearish outlook.
Bullish Scenario
Breakout Above ₹257: A sustained move above ₹257 could target ₹265 – ₹270 in the short term.
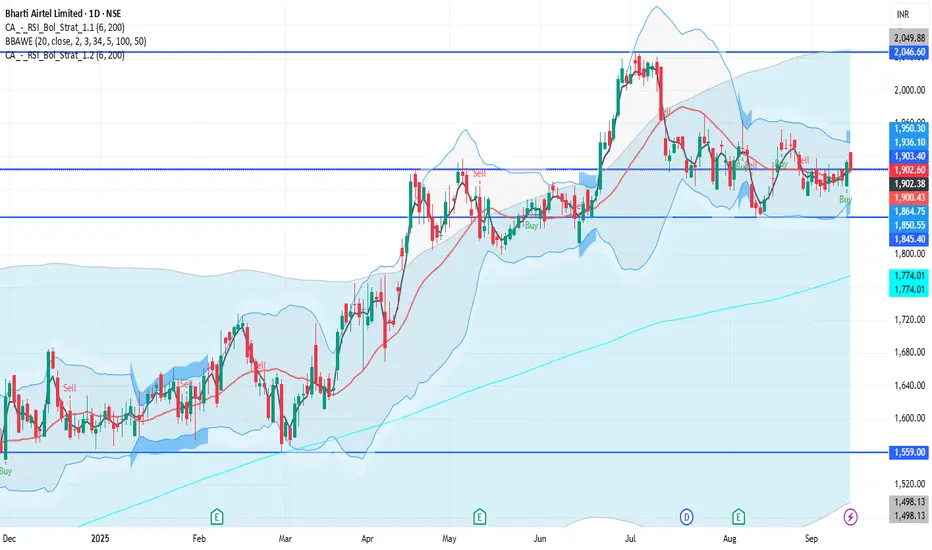
BHARTIARTL 1D Time frameCurrent Price & Trend
Price: ₹1,902.60
Trend: Neutral to mildly bullish; trading approximately 6.9% below its 52-week high of ₹2,045.50, achieved on July 2, 2025.
Momentum: Indicators suggest a neutral to slightly bullish outlook.
Bullish Scenario
Breakout Above ₹1,930: A sustained move above ₹1,930 could target ₹1,950 – ₹1,960 in the short term.
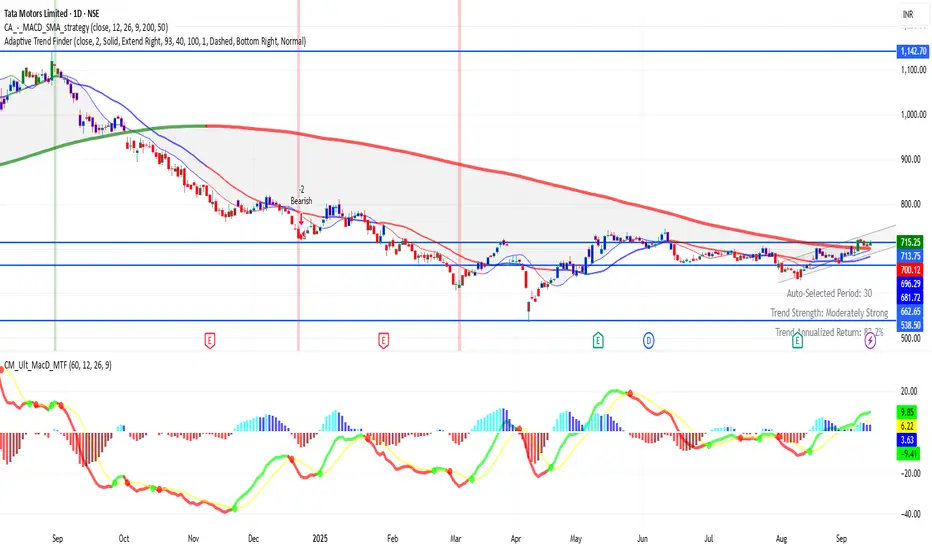
TATAMOTORS 1D Time frameCurrent Status
Price is around ₹715
The stock has been showing strength recently, with many of its moving averages (short- to long-term) supporting the rise.
Technical indicators like RSI, MACD, ADX etc. lean positive — buyers seem to have the upper hand.
There’s an inverted Head & Shoulders pattern forming, which is a bullish reversal signal if confirmed. Support zones are holding up so far.
Bullish Scenario
If Tata Motors stays above ₹700–705 support and breaks past ~₹720–725 with volume:
Possible upside to ~₹730-₹740
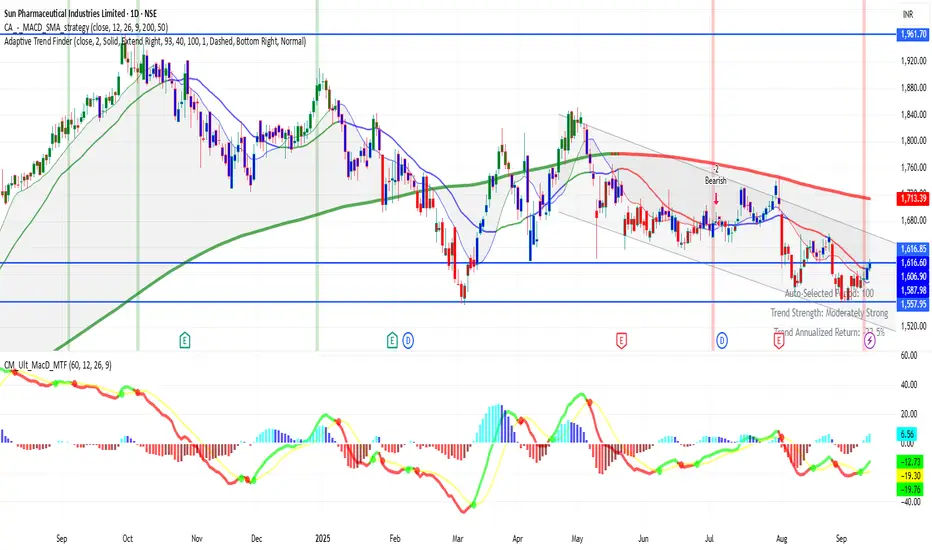
SUNPHARMA 1D Time frameCurrent Snapshot
Stock is around ₹1,616
52-week range: ~ ₹1,553 (low) up to ~ ₹1,960 (high)
Price is significantly below its 52-week peak, indicating past weakness or profit-taking from highs.
Bullish Scenario
If price can hold above the support (~₹1,590–₹1,600) and pushes above the immediate resistance (~₹1,620–₹1,630):
Could see a move toward ₹1,660–₹1,670.
If resistance is crossed with strength, next targets would be ~₹1,740-₹1,750 or more, depending on momentum.
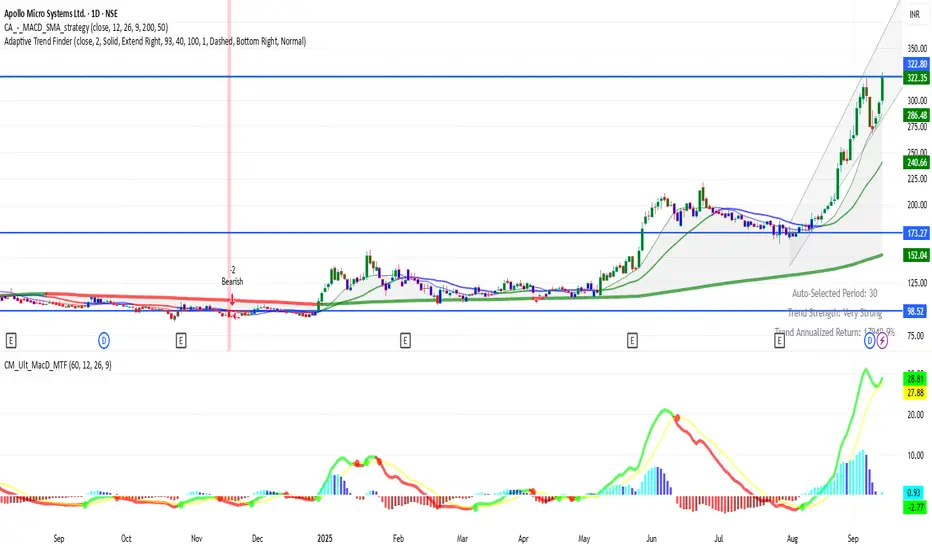
APOLLO 1D Time frame Current Status
Price: ₹322
Trend: Strong uptrend, stock recently made fresh highs.
Momentum: Very strong, but slightly overbought in daily indicators.
Key Levels
Immediate Resistance: ₹326 – ₹330 (recent high zone)
Next Resistance: ₹340 – ₹345 (if breakout continues)
Immediate Support: ₹300 – ₹305
Stronger Support: ₹280 – ₹285
SBIN 1D Time frame📉 Current Market Snapshot
Closing Price: ₹823.55
Day's Range: ₹819.80 – ₹825.80
52-Week High: ₹875.45
52-Week Low: ₹680.00
Market Cap: ₹7,60,188 crore
P/E Ratio (TTM): 9.57
P/B Ratio: 1.47
Dividend Yield: 1.93%
EPS (TTM): ₹86.06
Book Value: ₹527.66
Face Value: ₹1.00
Volume: 5,078,018 shares
VWAP: ₹822.84

BANKNIFTY 1D Time frame📉 Current Market Snapshot
Closing Price: ₹54,809.30
Day's Range: ₹54,580.35 – ₹54,852.25
52-Week Range: ₹47,702.90 – ₹57,628.40
Market Cap: ₹45,50,788 crore
P/E Ratio: 14.9
Dividend Yield: 1.09%
Price-to-Book Ratio: 2.03
1-Year Return: +5.87%
5-Year Return: +147.36%
10-Year Return: +12.5%
INFY 1D Time frame📉 Current Market Snapshot
Current Price: ₹1,525.60
Previous Close: ₹1,509.70
Day's Range: ₹1,521.10 – ₹1,542.90
52-Week High: ₹2,006.45
52-Week Low: ₹1,307.00
Market Cap: ₹6,33,794 crore
P/E Ratio: 23.0
Dividend Yield: 2.82%
ROE: 28.72%
Debt-to-Equity Ratio: 0.09
Beta: 1.11
EPS (TTM): ₹65.63
Face Value: ₹5.00
VWAP: ₹1,529.86
Volume: 12,856,963 shares
ATR (14): ₹5.72
MFI: 71.75
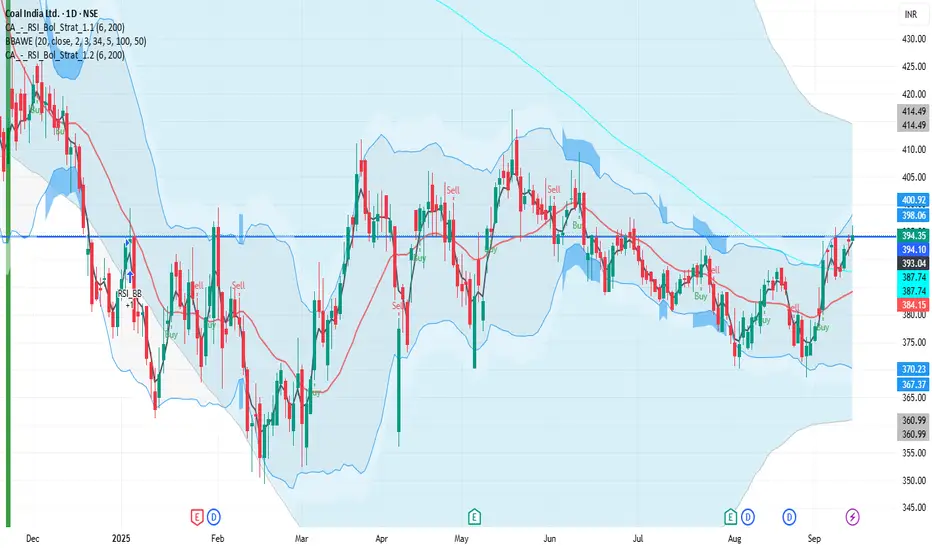
COALINDIA 1D Time frame📉 Current Market Snapshot
Current Price: ₹394.35
Previous Close: ₹391.90
Day's Range: ₹390.45 – ₹396.00
52-Week Range: ₹349.20 – ₹517.85
Market Cap: ₹2.42 lakh crore
P/E Ratio: 7.3
Dividend Yield: 6.72%
EPS (TTM): ₹53.78
ROE: 48.7%
Debt-to-Equity Ratio: 0.00
Beta: 1.01
RSI: 61.69
MACD Signal: 1.12
MFI: 71.75
ATR (14): ₹5.72
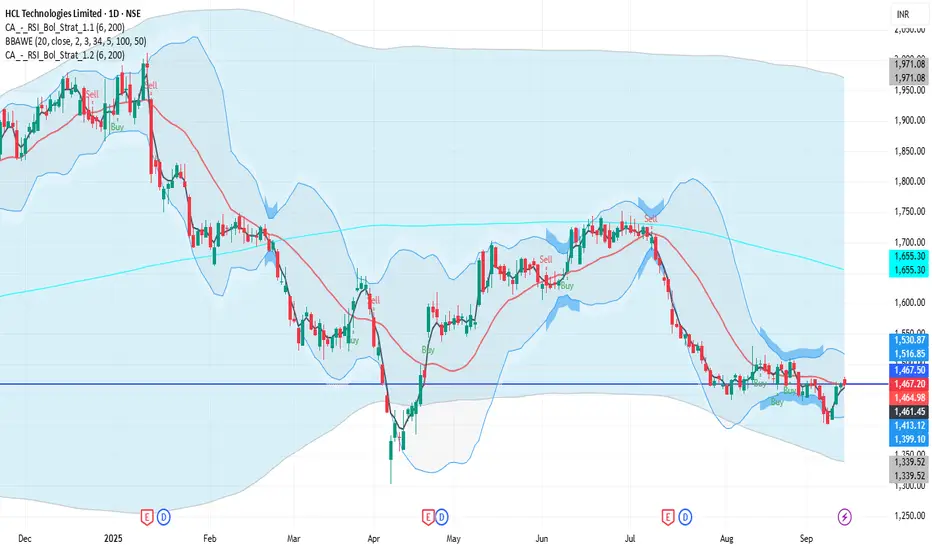
HCLTECH 1D Time frame📉 Current Market Snapshot
Current Price: ₹1,467
Previous Close: ₹1,467.20
Day’s Range: ₹1,463 – ₹1,480
📊 Key Support & Resistance Levels
Support Levels: ₹1,463, ₹1,450
Resistance Levels: ₹1,480, ₹1,500
LUPIN 1D Time frame📍 Current Price
₹2,043.40 (closing price)
Short-Term Outlook
Bullish Scenario: A sustained move above ₹2,070 could lead to a test of the 52-week high around ₹2,402.90.
Bearish Scenario: A drop below ₹2,000 may signal a potential pullback toward ₹1,950.

ASIANPAINT 1D Time frame📍 Current Price
₹2,546.30 (closing price)
Short-Term Outlook
Bullish Scenario: A sustained move above ₹2,587.40 could lead to a test of the 52-week high around ₹3,394.90.
Bearish Scenario: A drop below ₹2,505.00 may signal a potential pullback toward ₹2,400.

BANKNIFTY 1D Time frame📍 Current Level
₹54,669.60
Short-Term Outlook
Bullish Scenario: A sustained move above ₹55,000 could lead to a test of the 52-week high around ₹57,628.40.
Bearish Scenario: A drop below ₹54,300 may signal a potential pullback toward ₹54,000.

BPCL 1D Time frame📍 Current Price
₹318.00 (closing price)
Short-Term Outlook
Bullish Scenario: A sustained move above ₹322.65 could lead to a test of the 52-week high around ₹376.00.
Bearish Scenario: A drop below ₹312.30 may signal a potential pullback toward ₹300.00.

TATAMOTORS 1D Time frame📍 Current Price
₹715.25 (closing price)
Short-Term Outlook
Bullish Scenario: A sustained move above ₹731.00 could lead to a test of the 52-week high around ₹1,006.00.
Bearish Scenario: A drop below ₹690.00 may signal a potential pullback toward ₹680.00.

KOTAKBANK 1D Time frame📍 Current Price
₹1,972.30 (unchanged from previous close)
Short-Term Outlook
Bullish Scenario: A sustained move above ₹2,000 could lead to a test of the 52-week high around ₹2,301.90.
Bearish Scenario: A drop below ₹1,950 may signal a potential pullback toward ₹1,900.

MARUTI 1D Time frame📍 Current Price
₹15,325.00
Short-Term Outlook
Bullish Scenario: A sustained move above ₹15,450 could lead to a test of the 52-week high around ₹15,384.
Bearish Scenario: A drop below ₹15,100 may signal a potential pullback toward the ₹14,800 level.
