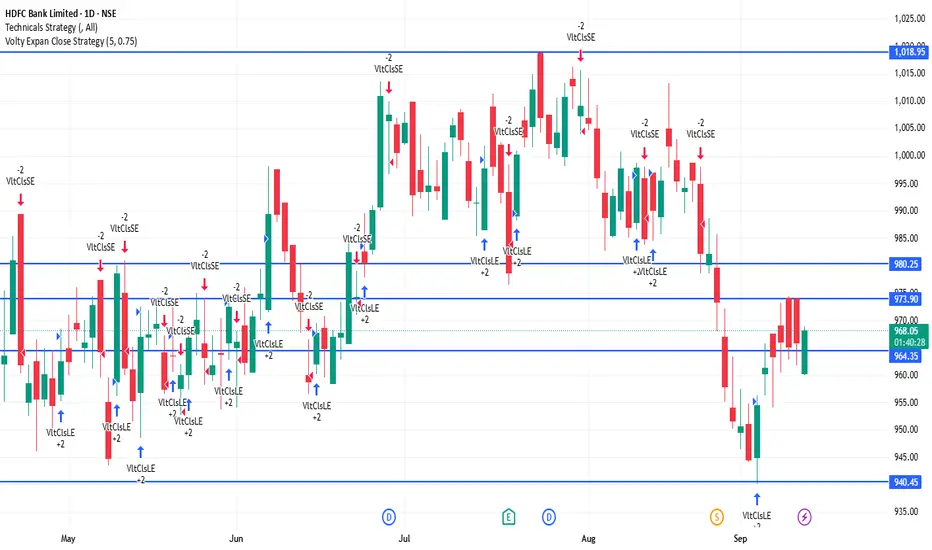
HDFCBANK 1D Time frame📍 Current Price Action
Current Price: ~₹968
Day Range: ₹960 – ₹975
Trend: Neutral to mildly bullish
⚙ Technical Indicators
RSI (14): ~53 → neutral momentum
MACD: Slightly positive → mild upside bias
ADX (14): ~32 → moderate trend strength
MFI (Money Flow Index): Mid-range → balanced buying/selling pressure
📊 Moving Averages
Short-term (5, 10, 20-day): Price trading above → bullish signals
Medium to Long-term (100, 200-day): Mixed to weak → acting as resistance
📉 Support & Resistance
Immediate Support: ₹960 – ₹965
Next Support Zone: ₹940 – ₹950
Immediate Resistance: ₹970 – ₹975
Next Resistance: ₹985 – ₹990
🧠 Summary
HDFC Bank is in a neutral to mildly bullish zone on the daily chart. Price is holding above short-term averages, but longer-term averages are acting as resistance. If the stock sustains above ₹975, it may move toward ₹985–₹990. Failure to hold ₹960 could drag it toward ₹940–₹950.
HDFCBANK

TATACONSUM 1D Time frame📍 Current Price Action
Current Price: ~₹1,105
Day Change: +0.3% approx
52-Week Range: ₹882 – ₹1,234
⚙ Technical Indicators
RSI (14): ~62-65 → bullish momentum
MACD: Positive → upside bias intact
ADX (14): Above 50 → strong trend strength
Stochastic / Williams %R: In overbought zone → short-term pullback risk
📊 Moving Averages
Short-term (5, 10-day): Bullish, price trading above
Medium-term (20, 50-day): Bullish, trend supportive
Long-term (100, 200-day): Bullish, strong structure
📉 Support & Resistance
Immediate Support: ₹1,080 – ₹1,090
Next Support Zone: ₹1,060 – ₹1,030
Immediate Resistance: ₹1,115 – ₹1,125
Major Resistance (52-week high): ₹1,230+
🧠 Summary
Tata Consumer is bullish on the daily chart. Indicators and moving averages show strong momentum, though overbought signals suggest chances of consolidation or mild pullback. Holding above ₹1,080 keeps the uptrend intact. A breakout above ₹1,125 can open the way toward ₹1,230+.

ITC 1D Time frame📍 Current Price Action
Current price around ₹415
Day’s range: ~ ₹412 – ₹417
52-week range: ~ ₹390 – ₹528
⚙ Technical Indicators
RSI (14): ~65 → bullish momentum, nearing higher strength
MACD: Positive → supports upside bias
ADX (14): High (≈ 60-65) → strong trend strength
Stochastic / Williams %R: Showing overbought signals → risk of short-term pullback or consolidation
📊 Moving Averages & Trend Structure
Short/medium/long-term moving averages (10, 20, 50, 100, 200 day) largely give buy signals
The 5-day MA is slightly below current price → short-term pullback potential
🔧 Support & Resistance Levels
Immediate Support: ~ ₹410
Next Support Zone: ~ ₹405 – ₹400
Immediate Resistance / Pivot Territory: ~ ₹416 – ₹417
Higher Resistance: ~ ₹420 – ₹422 (if the current resistance is cleared)
🧠 Summary
ITC is in a bullish trend on the daily chart with strong momentum and multiple indicators supporting upward move. But since some overbought signals are showing up, there’s a chance for a pullback or consolidation near resistance. Key to watch: holding above ₹410 keeps the bullish bias. Breaking above ~₹416-417 convincingly could open up room toward ~₹420+. If price falls below support near ₹405-410, downside risk increases.

MARUTI 1D Time frame📍 Current Price Action
Last traded price: ~₹ 15,096
Minimal intraday change (~0.1%, slightly up)
⚙ Technical Indicators
RSI (14): ~72 → strong uptrend / overbought conditions
Stochastic RSI: Low / showing weakness → possible cooling off
CCI (14): ~92 → uptrend strength
MFI (Money Flow Index): ~84 → strong buying pressure
📊 Moving Averages & Trend Strength
Price is above 50-day and 200-day SMAs & EMAs → long-term trend is bullish
20-day SMA/EMA are more neutral-to-slightly bullish
All major moving averages are broadly supporting upwards bias
🔧 Support & Resistance / Pivot Zones
Support Levels: ~₹ 14,900 – ₹ 15,000
Resistance Levels / Pivot: ~₹ 15,300 – ₹ 15,500
🧠 Summary
Maruti is in a strong uptrend on the daily chart. Overbought indicators like RSI and MFI suggest buying strength is high, which also means risk of a short-term pullback or consolidation. Key support ~₹ 15,000 needs to hold for bulls. If price clears resistance near ₹ 15,300-15,500 convincingly, upward move likely to continue.

SENSEX 1D Time frame📍 Current Price Action
Current Level: 81,548
Day’s Range: ~80,320 – 81,550
52-Week Range: 71,425 – 85,978
⚙ Technical Indicators
RSI (14): Around 43 → neutral to slightly bearish zone
MACD: Negative → mild downward pressure still visible
ADX (14): ~35-40 → moderate trend strength
Stochastic Oscillator: Near overbought zone → possible short-term pullback
Moving Averages:
Short-term (5, 10, 20-day): Mixed
Medium & long-term (50, 100, 200-day): Acting as resistance near highs
📊 Key Levels
Immediate Support: 80,800 – 81,000 zone
Immediate Resistance: 81,600 – 81,800 zone
Breakout Levels:
Above 81,800 → upside momentum could target 82,200+
Below 80,800 → downside may test 80,300 – 80,000
🧠 Summary
Sensex is currently at 81,548, near its resistance zone. Trend is neutral to mildly bullish in the short-term. Sustaining above 81,600–81,800 will confirm strength for further rally. A failure to hold could trigger a pullback toward 80,800–80,300.

BANKNIFTY 1D Time frame📍 Current Price Action
Level: ~54,670
Day’s Range: 54,402 – 54,757
52-Week Range: 47,703 – 57,628
⚙ Technical Indicators
RSI (14): ~60 → bullish momentum, not overbought yet
MACD: Positive → supports uptrend
Moving Averages:
Short-term (5, 10, 20-day): Bullish signals
Medium-term (50, 100-day): Supportive of trend
Long-term (200-day): Slight resistance near current level
Stochastic Oscillator: In overbought zone → strong momentum but risk of pullback
📊 Support & Resistance
Immediate Support: ~54,400
Immediate Resistance: ~54,750 – 55,000
Pivot Point: ~54,550
🧠 Summary
Bank Nifty is in a bullish short-term trend. Holding above 54,400 keeps momentum positive, while a breakout above 55,000 could open room for more upside. If resistance holds, the index may consolidate or retest lower supports.

NIFTY 1D Time frame📍 Current Price Action
Trading around 25,005 – 25,010
Day change: about +0.4%
⚙ Technical Indicators
Moving Averages (5, 10, 20, 50, 100, 200 day): All showing buy signals → bullish structure
RSI (14): In bullish territory, not overbought → healthy momentum
Stochastic Oscillator: Near overbought zone → indicates strength, but chance of a short pullback
MACD: Positive crossover → supports upward momentum
📊 Support & Resistance
Immediate Resistance: 25,000 – 25,100 zone
Immediate Support: 24,800 – 24,900 zone
If price sustains above 25,100 → next upside levels can open higher (towards 25,200+)
If it breaks below 24,900 → downside could test 24,700 levels
🧠 Summary
Nifty 50 is in a bullish daily trend, currently consolidating near psychological resistance at 25,000. As long as it holds above 24,900, the bullish momentum is intact. A breakout above 25,100 could extend the rally further.
Do you also want me to give the weekly time frame (1W) view for a bigger picture trend?

WIPRO 1D Time framw📈 Price Action
Previous Close: ₹255.75
Today's Close: ₹256.50
Daily Range: ₹253.00 – ₹257.00
Volume: 804,499 shares (significantly higher than the 50-day average of 369,496 shares)
52-Week Range: ₹228.00 – ₹324.55
🔧 Technical Indicators
Relative Strength Index (RSI): 63.59 — Indicates bullish momentum.
MACD: Positive — Suggests upward trend.
Moving Averages:
5-day MA: ₹254.50
50-day MA: ₹249.00
200-day MA: ₹265.00
Trend: Bullish, as the stock is trading above short-term moving averages.
Stochastic Oscillator: 76.47% — Indicates overbought conditions, suggesting potential for a pullback.
Average True Range (ATR): ₹0.05 — Indicates low volatility.
📊 Support & Resistance Levels
Immediate Support: ₹253.00
Immediate Resistance: ₹257.00
Pivot Point: ₹255.00
🧠 Trend Analysis
Trend: Bullish
Momentum: Positive
Volatility: Low
Summary: Wipro's stock is exhibiting a bullish trend with positive momentum. The current overbought condition, as indicated by the stochastic oscillator, suggests that the stock may experience a short-term pullback before continuing its upward trajectory. Traders should monitor the support and resistance levels for potential entry and exit points.

SUNPHARMA 1D Time frame📈 1-Day Price Action
current: ₹1,610.50
Open: ₹1,592.50
High: ₹1,614.00
Low: ₹1,592.50
Close: ₹1,611.10
Volume: 1.14 million shares
🔧 Technical Indicators
Relative Strength Index (14): 65.29 — indicates bullish momentum
MACD: 6.80 — suggests upward trend
Moving Averages: 5-day MA: ₹1,608.84, 50-day MA: ₹1,586.46, 200-day MA: ₹1,610.12 — all signaling a buy
Pivot Point: ₹1,610.10 — aligns with current trading level
📊 Trend & Levels
Trend: Bullish
Support: ₹1,600
Resistance: ₹1,620
🧠 Market Sentiment
Analysts maintain a positive outlook on Sun Pharma, with JM Financial retaining a "Buy" rating and a revised target price of ₹2,025, reflecting confidence in the stock's potential for appreciation over the next year.

BANKNIFTY 1D Time frameApologies for any confusion earlier. As of September 11, 2025, at 2:48 PM IST, the Nifty Bank (BANKNIFTY) index is trading at approximately ₹54,536.00 on the daily (1D) time frame.
The Economic Times
📊 Current Snapshot
Current Price: ₹54,681.00
Day’s Range: ₹54,402.40 – ₹54,733.90
Previous Close: ₹54,536.00
Opening Price: ₹54,413.05
Volume: Approximately 6.16 million shares
📈 Trend & Indicators
Trend: Neutral to mildly bullish; trading near short-term resistance.
RSI (14): Neutral zone.
MACD: Positive → indicating mild bullish momentum.
Moving Averages: Short-term averages indicate neutral to slightly bullish outlook.
🔮 Outlook
Bullish Scenario: Break above ₹54,800 with strong volume could target ₹55,000.
Bearish Scenario: Drop below ₹54,400 may lead to further decline toward ₹54,200.
Neutral Scenario: Consolidation between ₹54,400 – ₹54,800; breakout needed for directional move.
📌 Key Factors to Watch
Economic Indicators: Interest rates, inflation, and RBI policy updates.
Sector Performance: Trends in the banking sector.
Global Cues: Global market trends, US indices, crude oil, and currency movements.

NIFTY 1D Time frame📊 Current Snapshot
Current Price: ₹25,022.20
Day’s Range: ₹24,973.00 – ₹25,035.00
Previous Close: ₹24,976.10
Opening Price: ₹24,991.00
Volume: Moderate
📈 Trend & Indicators
Trend: Neutral to mildly bullish; trading near short-term resistance.
RSI (14): Neutral zone.
MACD: Positive → indicating mild bullish momentum.
Moving Averages: Short-term averages indicate neutral to slightly bullish outlook.
🔮 Outlook
Bullish Scenario: Break above ₹25,050 with strong volume could target ₹25,100.
Bearish Scenario: Drop below ₹24,950 may lead to further decline toward ₹24,900.
Neutral Scenario: Consolidation between ₹24,950 – ₹25,050; breakout needed for directional move.
📌 Key Factors to Watch
Economic Indicators: Interest rates, inflation, and RBI policy updates.
Sector Performance: Trends in the IT and financial sectors.
Global Cues: Global market trends, US indices, crude oil, and currency movements.

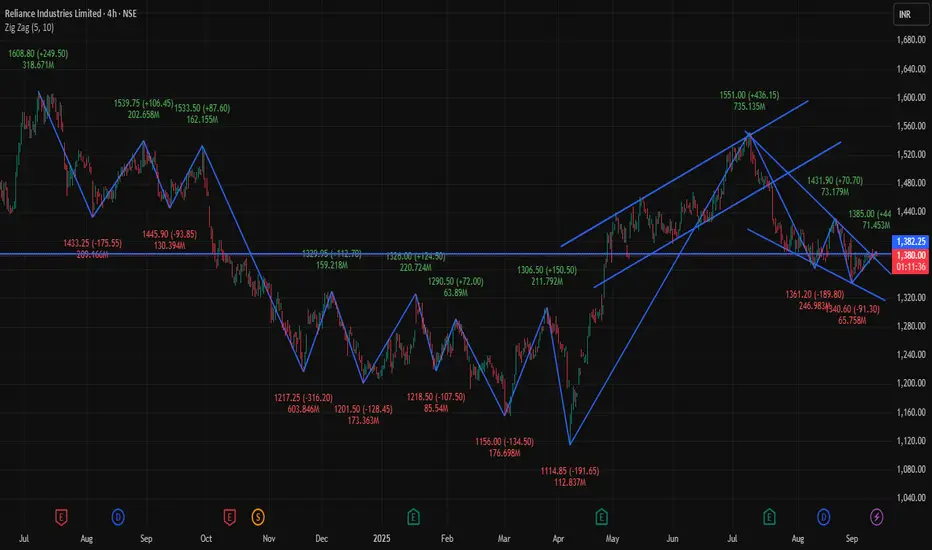
RELIANCE 4Hour 📊 Current Snapshot
Current Price: ₹1,380📈 Trend & Indicators
Trend: Neutral to mildly bullish; trading near short-term resistance.
RSI (14): Neutral zone.
MACD: Positive → indicating mild bullish momentum.
Moving Averages: Short-term averages indicate neutral to slightly bullish outlook.
🔮 Outlook
Bullish Scenario: Break above ₹1,385.50 with strong volume could target ₹1,390.00.
Bearish Scenario: Drop below ₹1,375.00 may lead to further decline toward ₹1,370.00.
Neutral Scenario: Consolidation between ₹1,375.00 – ₹1,385.50; breakout needed for directional move.
📌 Key Factors to Watch
Economic Indicators: Interest rates, inflation, and RBI policy updates.
Sector Performance: Trends in the energy and petrochemical sectors.
Global Cues: Global market trends, US indices, crude oil, and currency movements..90
Day’s Range: ₹1,375.00 – ₹1,385.50
Previous Close: ₹1,377.00
Opening Price (4H): ₹1,376.00
Volume: Approximately 371,445 shares traded
SENSEX 4Hour📊 Current Snapshot
Current Price: ₹81,561.00
Day’s Range: ₹81,235.42 – ₹81,643.88
Previous Close: ₹81,101.32
Opening Price (4H): ₹81,504.36
Volume: Approximately 6.16 million shares
📈 Trend & Indicators
Trend: Neutral to mildly bullish; trading near 50-hour and 200-hour moving averages.
RSI (14): Neutral zone.
MACD: Positive → indicating mild bullish momentum.
Moving Averages: Short-term averages indicate neutral to slightly bullish outlook.
🔮 Outlook
Bullish Scenario: Break above ₹81,643.88 with strong volume could target ₹81,917.15.
Bearish Scenario: Drop below ₹81,235.42 may lead to further decline toward ₹81,101.32.
Neutral Scenario: Consolidation between ₹81,235.42 – ₹81,643.88; breakout needed for directional move.
📌 Key Factors to Watch
Economic Indicators: Interest rates, inflation, and RBI policy updates.
Sector Performance: Trends in the IT and financial sectors.
Global Cues: Global market trends, US indices, crude oil, and currency movements.

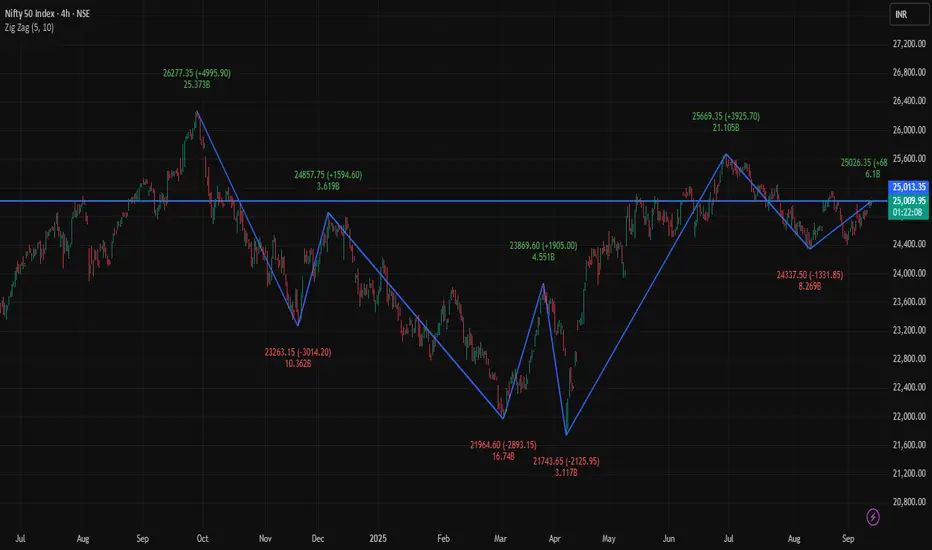
NIFTY 4H Time frame📊 Current Snapshot
Current Price: ₹25,010.95
Day’s Range: ₹24,940.15 – ₹25,008.95
Previous Close: ₹24,977.95
Opening Price (4H): ₹24,940.15
Volume: Approximately 6.16 million shares
📈 Trend & Indicators
Trend: Neutral to mildly bullish; trading near 50-hour and 200-hour moving averages.
RSI (14): Neutral zone.
MACD: Positive → indicating mild bullish momentum.
Moving Averages: Short-term averages indicate neutral to slightly bullish outlook.
🔮 Outlook
Bullish Scenario: Break above ₹25,008.95 with strong volume could target ₹25,186.00.
Bearish Scenario: Drop below ₹24,940.00 may lead to further decline toward ₹24,871.10.
Neutral Scenario: Consolidation between ₹24,940.00 – ₹25,008.95; breakout needed for directional move.
📌 Key Factors to Watch
Economic Indicators: Interest rates, inflation, and RBI policy updates.
Sector Performance: Trends in the IT and financial sectors.
Global Cues: Global market trends, US indices, crude oil, and currency movements.
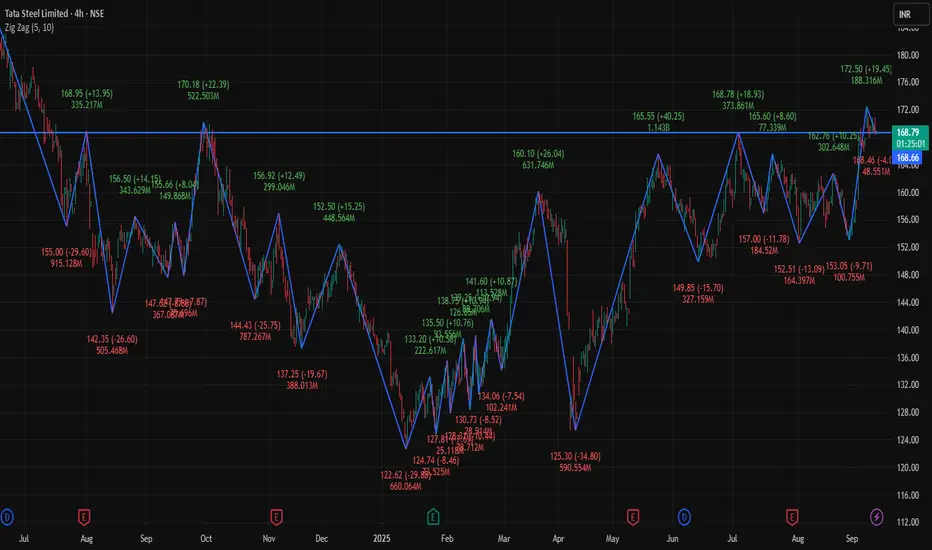
TATASTEEL 4H 📊 Current Snapshot
Current Price: ₹169.43
Day’s Range: ₹168.46 – ₹170.90
Previous Close: ₹169.43
Opening Price (4H): ₹169.35
📈 Trend & Indicators
Trend: Neutral to mildly bullish; trading near 50-hour and 200-hour moving averages.
RSI (14): Neutral zone.
MACD: Positive → indicating mild bullish momentum.
Moving Averages: Short-term averages indicate neutral to slightly bullish outlook.
🔮 Outlook
Bullish Scenario: Break above ₹170.90 with strong volume could target ₹172.50.
Bearish Scenario: Drop below ₹168.50 may lead to further decline toward ₹167.99.
Neutral Scenario: Consolidation between ₹168.50 – ₹170.90; breakout needed for directional move.
📌 Key Factors to Watch
Economic Indicators: Interest rates, inflation, and RBI policy updates.
Sector Performance: Trends in the metals and mining sectors.
Global Cues: Global market trends, US indices, crude oil, and currency movements.
HDFCBANK 1D Time frameCurrent Price Action
HDFCBANK is trading around ₹962–968.
Day’s low is near ₹960 and high is around ₹978.
The stock is consolidating in a tight range.
⚖️ Key Levels
Immediate Resistance: ₹968 – ₹970
Next Resistance: ₹975 – ₹980
Immediate Support: ₹960
Strong Support: ₹950 – ₹955
📊 Indicators
Moving Averages: Price is below the 50-day MA (short-term weakness) but above the 200-day MA (long-term trend still intact).
RSI (14-day): Around 40–45 → neutral to slightly weak momentum.
MACD: Negative bias, showing limited upside strength.
📈 Outlook
If HDFCBANK stays above ₹960, a bounce toward ₹970 – ₹975 is possible.
A breakout above ₹975 – ₹980 could turn the trend stronger.
If the stock slips below ₹955 – ₹950, it may head lower toward ₹940 – ₹935.
Current bias: Neutral to slightly bearish until price breaks above resistance.
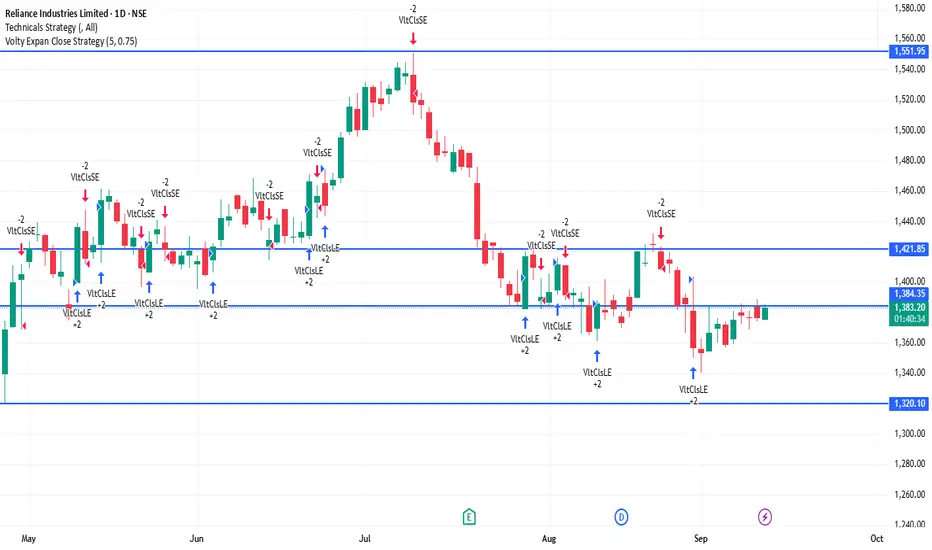
RELIANCE 1D Time frameCurrent Price Action
Reliance is trading around ₹1,384.
Day’s low is near ₹1,375 and high is near ₹1,385.
Price is consolidating in a narrow band after recent gains.
⚖️ Key Levels
Immediate Resistance: ₹1,385 – ₹1,390
Next Resistance: ₹1,400 – ₹1,410
Immediate Support: ₹1,375
Strong Support: ₹1,360 – ₹1,350
📊 Indicators
Moving Averages: Short- and medium-term averages remain bullish, confirming uptrend strength.
RSI (14-day): Around 58–60 → showing bullish momentum, still not overbought.
MACD: Positive crossover → indicates bullish bias.
📈 Outlook
As long as Reliance holds above ₹1,375, the bias stays bullish.
A breakout above ₹1,390 – ₹1,400 can push the stock toward ₹1,410 – ₹1,420.
If it falls below ₹1,375, it could slip toward ₹1,360 – ₹1,350.
SENSEX 1D Time frame📍 Current Price Action
Sensex is currently trading around 81,577.
Day’s low is near 81,216 and high is near 81,589.
The index is consolidating near recent highs.
⚖️ Key Levels
Immediate Resistance: 81,600 – 81,850
Next Resistance: 82,000 – 82,200
Immediate Support: 81,200 – 81,000
Strong Support: 80,800 – 80,500
📊 Indicators
Moving Averages: Short-, medium-, and long-term averages are in bullish alignment → trend remains positive.
RSI (14-day): Around 60–62 → shows bullish momentum, not in overbought zone.
MACD: Positive, confirming bullish bias.
📈 Outlook
As long as Sensex holds above 81,000, the bias stays bullish.
A breakout above 81,850 – 82,000 can open upside toward 82,500+.
If it slips below 81,000, a pullback toward 80,800 – 80,500 is possible.

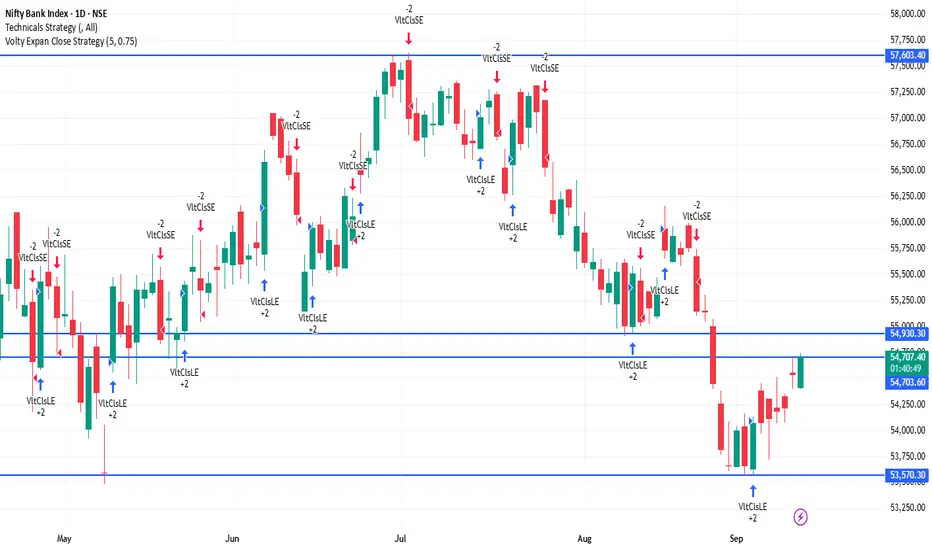
BANKNIFTY 1D Time frame📍 Current Price Action
BankNIFTY is trading around 54,680 – 54,817.
Day’s low is near 54,400, and high is near 54,825.
Index is consolidating near the upper end of the recent range.
⚖️ Key Levels
Immediate Resistance: 54,700 – 55,000
Next Resistance: 55,300 – 55,500
Immediate Support: 54,400
Strong Support: 53,800 – 53,500
📊 Indicators
Moving Averages: Short-, medium-, and long-term averages remain in a bullish alignment → trend still positive.
RSI (14-day): Around 60-65 → showing bullish momentum, but not extreme.
MACD: Still positive, indicating bullish momentum, though strength is flattening.
📈 Outlook
As long as BankNIFTY stays above 54,400, the bias remains bullish to neutral.
A breakout above 55,000 could push the index toward 55,300 – 55,500.
A breakdown below 54,400 could trigger a slide toward 53,800 – 53,500.
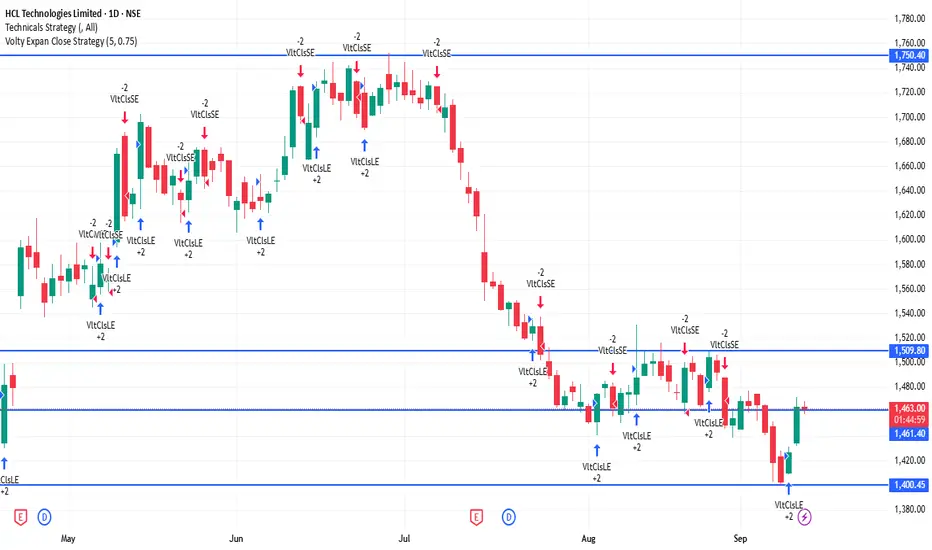
HCLTECH 1D Time frame📍 Current Price Action
HCLTECH is trading around ₹1,464.
Day’s low is near ₹1,458, and high is around ₹1,470.
The stock is consolidating near the upper end of its intraday range.
⚖️ Key Levels
Immediate Resistance: ₹1,470 – ₹1,475
Next Resistance: ₹1,495 – ₹1,500
Immediate Support: ₹1,450
Strong Support: ₹1,430 – ₹1,420
📊 Indicators
Moving Averages: Short-term MAs (5-, 10-day) slightly lagging, medium-term (20-, 50-day) supportive → trend mildly bullish.
RSI (14-day): Around 66 → showing bullish momentum, approaching overbought.
MACD: Positive, indicating mild bullish bias, but momentum is not extremely strong.
📈 Outlook
If HCLTECH holds above ₹1,450, potential upside toward ₹1,470 – ₹1,495 exists.
A breakout above ₹1,475 could open room toward ₹1,500.
On the downside, a drop below ₹1,450 may test ₹1,430 – ₹1,420 support.
Overall bias: Slightly bullish, but caution near resistance.
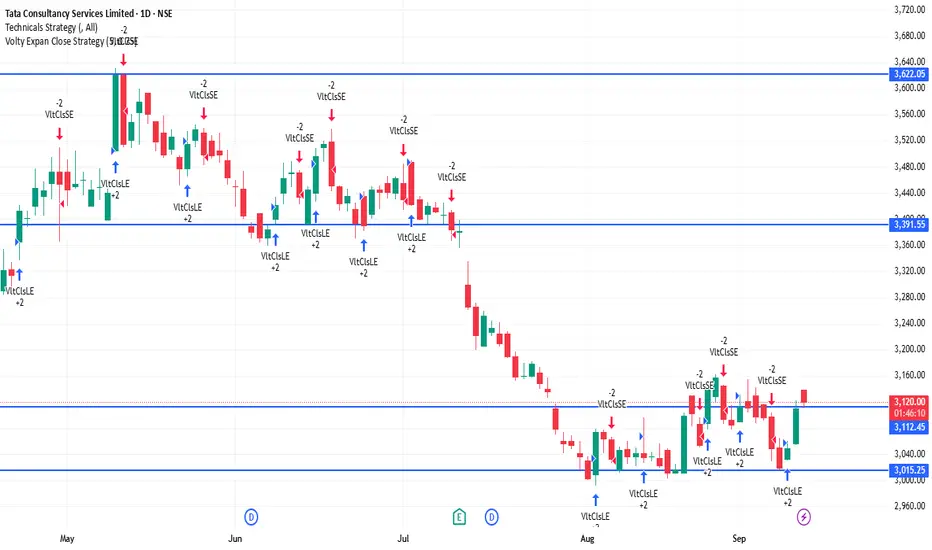
TCS 1D Time framePrice Action (Daily Chart)
Current price is around ₹3,117 - ₹3,120
Price is consolidating near support zones after a recent upward move.
Candle structure shows buying interest at lower levels, but resistance is capping the upside.
📊 Indicators
Moving Averages (MA):
Short-term MAs (5-day, 10-day) are slightly mixed.
Medium to long MAs (20, 50, 100, 200-day) are in buy zone, showing broader uptrend strength.
RSI (14-day): ~62-65 → indicates mild bullish momentum, not yet in overbought zone.
MACD: Shows positive crossover, momentum favors bulls but losing some strength.
⚖️ Key Levels
Immediate Resistance: ₹3,135 – ₹3,140
Next Resistance: ₹3,170 – ₹3,200
Immediate Support: ₹3,100 – ₹3,110
Strong Support: ₹3,050 – ₹3,000
📈 Outlook
Short-term sentiment: Neutral to slightly bullish as long as price holds above ₹3,100.
A breakout above ₹3,140 may open room toward ₹3,170–₹3,200.
A breakdown below ₹3,100 may drag price to ₹3,050–₹3,000.
Overall trend on daily timeframe is still uptrend, but near resistance, so caution is needed.
NIFTY 4H Time frame📊 Current Snapshot
Current Price: ₹24,976 - ₹25,006
Day’s Range (4H): ₹24,945 – ₹25,008
Previous Close: ₹24,973
Opening Price (4H): ₹24,991
Volume: Moderate
🔑 Key Support & Resistance Levels
Immediate Support: ₹24,945
Next Support: ₹24,900
Immediate Resistance: ₹25,008
Next Resistance: ₹25,050
📈 Trend & Indicators
Trend: Neutral to mildly bullish; trading near 50-hour and 200-hour moving averages.
RSI (14): 61 – Neutral zone.
MACD: Positive → indicating mild bullish momentum.
Moving Averages: Short-term averages suggest neutral to slightly bullish outlook.
🔮 Outlook
Bullish Scenario: Break above ₹25,008 with strong volume could target ₹25,050.
Bearish Scenario: Drop below ₹24,945 may lead to further decline toward ₹24,900.
Neutral Scenario: Consolidation between ₹24,945 – ₹25,008; breakout needed for directional move.
📌 Key Factors to Watch
Overall market sentiment.
Economic indicators: interest rates, inflation, RBI updates.
Global cues: US indices, crude oil, and currency movements.
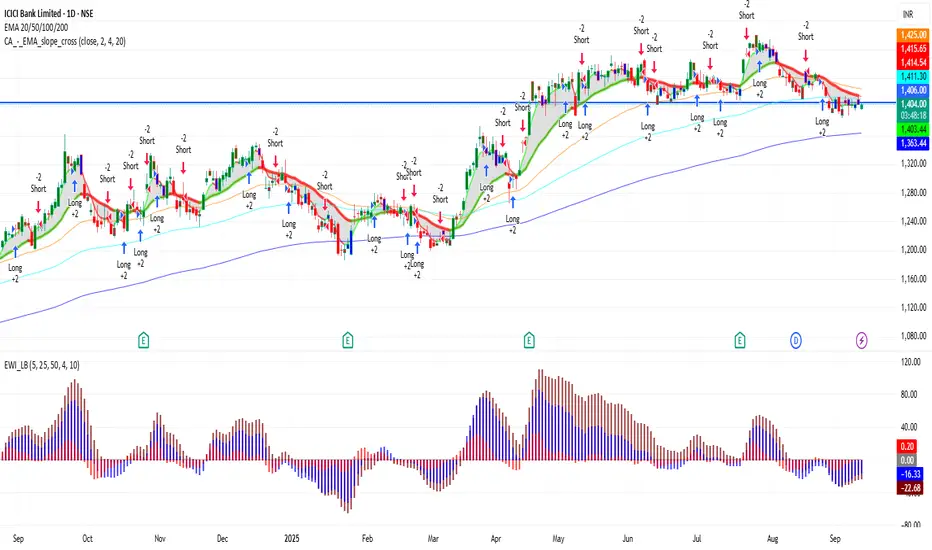
ICICIBANK 1D Time frame📊 Current Snapshot
Current Price: ₹1,406.10
Day’s Range: ₹1,402.00 – ₹1,416.35
52-Week Range: ₹1,186.00 – ₹1,500.00
Previous Close: ₹1,403.90
Opening Price: ₹1,403.70
Market Cap: ₹10.02 lakh crore
Volume: ~81.3 lakh shares
📈 Trend & Indicators
Trend: Neutral to mildly bullish; trading near 50-day and 200-day moving averages.
RSI (14): 60 – Neutral; no immediate overbought or oversold conditions.
MACD: Positive → indicates bullish momentum.
Moving Averages: Short-term moving averages suggest neutral to slightly bullish outlook.
🔮 Outlook
Bullish Scenario: Break above ₹1,416 with strong volume could target ₹1,450.
Bearish Scenario: Drop below ₹1,400 may lead to further decline toward ₹1,375.
Neutral Scenario: Consolidation between ₹1,400 – ₹1,416; breakout needed for directional move.
📌 Key Factors to Watch
Market Sentiment: Overall market trend and investor behavior.
Economic Indicators: Interest rates, inflation, and RBI policy updates.
Global Cues: Global market trends, US indices, crude oil, and currency movements.