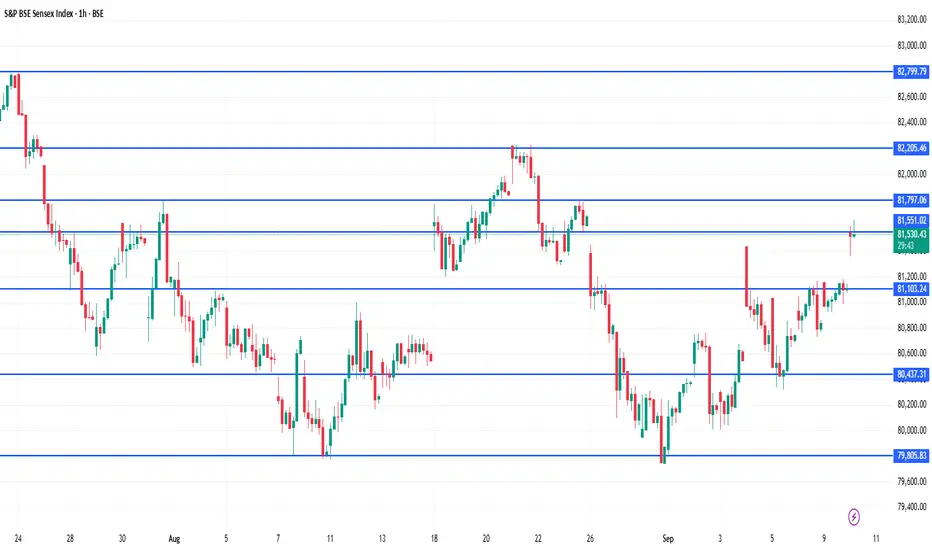
SENSEX 1hour Time frame📍 Sensex – 1H Important Levels (Current)
🔹 Support Zones
74,200 – 74,300 → Immediate intraday support
73,800 – 73,900 → Stronger support zone
73,400 – 73,500 → Major support, breakdown may trigger further downside
🔹 Resistance Zones
74,800 – 74,900 → Immediate 1H resistance
75,200 – 75,300 → Strong resistance; breakout can fuel upside momentum
75,600 – 75,800 → Major resistance; sellers likely to appear here
⚖️ Quick Summary
Bias: Mildly bullish as long as Sensex trades above 74,200.
A breakout above 74,900 may target 75,200 – 75,800.
A breakdown below 73,800 may drag it towards 73,400.
Current range to monitor: 74,200 – 74,900.
HDFCBANK
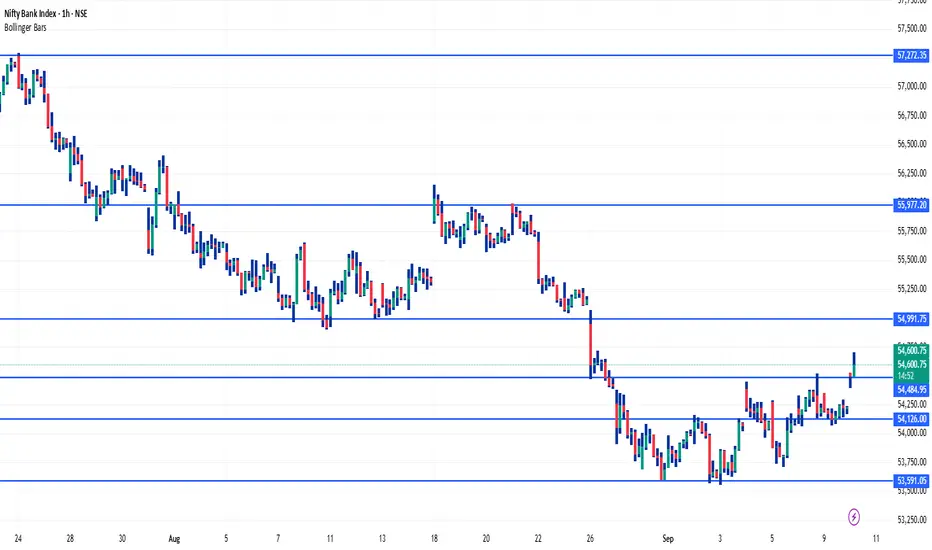
BANKNIFTY 1Hour Time frame📍 Bank Nifty – 1H Important Levels (Current)
🔹 Support Zones
47,800 – 47,900 → Immediate intraday support
47,400 – 47,500 → Strong support; buyers expected to defend here
47,000 – 47,100 → Major support; breakdown here can invite heavy selling
🔹 Resistance Zones
48,400 – 48,500 → Immediate 1H resistance
48,800 – 48,900 → Strong resistance zone
49,200 – 49,300 → Major resistance; breakout here may fuel a rally
⚖️ Quick Summary
Bias: Range-bound with a bullish tilt as long as Bank Nifty trades above 47,800.
Breakout above 48,500 can push towards 48,900 – 49,300.
Breakdown below 47,800 can drag the index to 47,400 – 47,000.
Current watch zone: 47,800 – 48,500.
USDJPY 1H📍 USDJPY – 1H
🔹 Support Zones
147.80 – 148.00 → Immediate intraday support
147.30 – 147.50 → Strong support; buyers likely active
146.80 – 147.00 → Major support; breakdown here may extend bearish momentum
🔹 Resistance Zones
148.50 – 148.70 → Immediate intraday resistance
149.00 – 149.20 → Strong resistance; breakout can trigger further rally
149.70 – 150.00 → Major psychological resistance
⚖️ Quick Summary
Bias: Currently range-bound with a bullish tilt as long as price stays above 147.80.
Breakout above 148.70 may open the way towards 149.20 – 150.00.
Breakdown below 147.80 may drag price back to 147.30 – 147.00.
Current watch zone: 147.80 – 148.70.

NIFTY 1H Important Levels 📍 NIFTY – 1H Important Levels
🔹 Support Zones
22,350 – 22,400 → Immediate intraday support
22,200 – 22,250 → Strong support zone
22,000 – 22,050 → Major support; breakdown here may trigger deeper selling
🔹 Resistance Zones
22,600 – 22,650 → Immediate resistance on 1H chart
22,800 – 22,850 → Strong resistance; breakout can push momentum higher
23,000 → Major psychological resistance
⚖️ Quick Summary
Bias: Mildly bullish as long as Nifty trades above 22,350.
Breakout above 22,650 may extend the rally towards 22,850 – 23,000.
Breakdown below 22,350 may drag it towards 22,200 – 22,000.
Current watch zone: 22,350 – 22,650.

SEBI Expedites IPO Approvals: A Deep Dive into India’s Capital SEBI Expedites IPO Approvals: A Deep Dive into India’s Capital Market Shift
1. Introduction
The Securities and Exchange Board of India (SEBI) has recently undertaken a significant step—fast-tracking Initial Public Offering (IPO) approvals. Traditionally, IPO approval in India has been a lengthy process, often stretching to six months. But SEBI’s new measures aim to cut this time nearly in half, potentially bringing it down to three months or less.
This shift comes at a time when India’s equity markets are booming, with record levels of fundraising expected in 2025. After raising around $20.5 billion through IPOs in 2024, analysts predict that 2025 could surpass this figure. According to reports, $8.2 billion has already been raised so far in 2025, with an additional $13 billion in IPOs already approved and nearly ₹18.7 billion pending approval.
2. Why SEBI is Expediting IPO Approvals
Several factors are driving SEBI to accelerate the IPO pipeline:
Surging Investor Appetite
Indian retail participation in stock markets has seen an explosion in recent years.
Over 11 crore Demat accounts are active as of 2025, compared to just 3.6 crore in 2019.
More retail investors mean more demand for IPOs, making faster approvals essential.
Global Capital Flows
India is seen as one of the fastest-growing large economies.
With global investors diversifying away from China, India is attracting billions in Foreign Portfolio Investments (FPIs).
A streamlined IPO process will help India capture this liquidity flow before it moves elsewhere.
Boosting Startup Ecosystem
Unicorns like PhysicsWallah, Urban Company, and WeWork India are preparing for listings.
Startups require quicker capital-raising routes to compete globally.
Regulatory Efficiency and AI Adoption
SEBI is now deploying AI-powered document screening tools to check IPO filings.
This reduces human delays and allows faster compliance checks.
Collaboration with merchant bankers and exchanges has also been strengthened.
Record Fundraising Target
SEBI expects India to break the $20B mark again in 2025, possibly setting an all-time record.
Expedited approvals are central to making this happen.
3. How the New Approval System Works
Traditionally, IPO approvals involved multiple manual steps:
Filing of Draft Red Herring Prospectus (DRHP).
SEBI reviews disclosures, company financials, risk factors, and governance.
Queries are raised with the company, leading to back-and-forth communication.
Final approval takes 4–6 months.
Now under the fast-track mechanism:
AI Pre-Screening: Automated checks scan filings for missing data, compliance issues, and inconsistencies.
Concurrent Review: Instead of sequential reviews, SEBI, merchant bankers, and exchanges review documents simultaneously.
Time-Bound Queries: Companies are given strict deadlines to respond to SEBI’s queries.
Standardization: Risk disclosure formats and governance checks are now standardized across sectors.
This is expected to cut approval timelines by 40–50%.
4. IPO Pipeline for 2025
Some big-ticket IPOs in the pipeline include:
PhysicsWallah (₹3,820 crore) – Edtech unicorn expanding into AI-driven education.
Urban Company – Already raised ₹854 crore from anchor investors; IPO opening soon.
LG Electronics India – Large consumer electronics brand targeting India’s growing tech-savvy population.
WeWork India – Despite global challenges, the Indian arm remains profitable and expansion-focused.
Credila Financial Services – Education loan subsidiary of HDFC, a high-demand financial segment.
The SME IPO market is equally hot with listings like Goel Construction debuting at a 15% premium and Prozeal Green Energy getting SEBI approval.
5. Benefits of Faster IPO Approvals
For Companies
Quicker access to capital for expansion.
Ability to capitalize on favorable market sentiment without delays.
Reduced costs of prolonged regulatory processes.
For Investors
More frequent and diverse IPO opportunities.
Increased transparency due to standardized disclosures.
Higher liquidity as more firms enter the public market.
For Indian Markets
Strengthened image of India as an investment hub.
Alignment with global best practices (US SEC and Hong Kong’s IPO process are faster).
Improved global competitiveness for Indian startups.
6. Risks and Challenges
Speed vs. Quality
Faster approvals must not compromise on due diligence.
Weak companies slipping through could hurt investor trust.
Market Saturation
Too many IPOs in a short span could lead to oversupply, reducing listing gains.
Retail Investor Overexposure
Retail investors may flock to IPOs without understanding fundamentals, increasing risk of losses.
Global Volatility
Geopolitical tensions, US interest rate decisions, or oil price shocks can derail IPO plans.
7. Global Context
Globally, IPO markets have been mixed:
US Markets: Tech IPOs are recovering but still face valuation pressure.
China: Tighter regulations have slowed down IPO fundraising.
Middle East: Saudi Arabia and UAE continue to see large IPOs in energy and infrastructure.
In this scenario, India is positioning itself as a global IPO leader, especially in the tech and services sector.
8. Investor Strategy for 2025 IPOs
For investors, the IPO rush creates both opportunities and challenges. Some strategies include:
Focus on Fundamentals
Look for companies with strong financials, governance, and growth potential.
Avoid IPOs driven purely by hype.
Anchor Investor Signals
Strong anchor participation (like Urban Company’s ₹854 Cr funding) signals institutional confidence.
Sector Plays
Edtech, Renewable Energy, Fintech, and Consumer Services are hot sectors.
Traditional sectors like construction and manufacturing are also showing resilience.
Listing Gains vs. Long-Term Holding
Some IPOs (like Goel Construction SME) deliver quick listing pops.
Larger IPOs (like PhysicsWallah, Urban Company) may be better for long-term growth.
9. Case Study: Urban Company IPO
Urban Company is a prime example of SEBI’s faster approval ecosystem.
Filed DRHP earlier in 2025.
Received SEBI approval within 12 weeks.
Raised ₹854 crore from anchors before IPO launch.
Price band set at the higher end, reflecting strong demand.
Market analysts project strong long-term growth given India’s rising demand for home services.
This showcases how SEBI’s new process benefits both issuers and investors.
10. Conclusion
SEBI’s decision to expedite IPO approvals is a game-changer for India’s financial markets. By cutting approval times, using AI-driven compliance, and standardizing processes, SEBI is creating a faster, more transparent, and investor-friendly IPO environment.
With major companies like PhysicsWallah, Urban Company, Neilsoft, and Prozeal entering the market, and regulatory support from SEBI, 2025 is poised to be a record-breaking year for IPO fundraising in India.
However, investors must balance enthusiasm with caution—choosing fundamentally strong IPOs, monitoring global market conditions, and avoiding blind bets driven by hype.
In essence, SEBI’s move reflects India’s ambition to emerge as a global capital-raising hub, connecting domestic growth stories with global capital at unprecedented speed and scale.
Trading Master Class With ExpertsHistory & Evolution of Options
Options are not a modern invention. Their roots go back thousands of years.
Ancient Greece: The earliest recorded use of options was by Thales, a philosopher who secured the right to use olive presses before harvest. When olive yields turned out abundant, he profited by leasing the presses at higher prices.
17th Century Netherlands: Options became popular in the Dutch tulip mania, where people speculated on tulip bulb prices.
Modern Options: Organized option trading as we know it started in 1973 with the creation of the Chicago Board Options Exchange (CBOE). Alongside, the Black-Scholes model for option pricing was introduced, which gave traders a scientific framework to value options.
Today, options are traded globally — from U.S. exchanges like CBOE, CME, and NASDAQ to Indian platforms like NSE’s Options Market. They’ve also expanded into forex, commodities, and even cryptocurrencies like Bitcoin.
Why Traders Use Options
Options serve different purposes:
Investors: Hedge portfolios (e.g., protective puts).
Traders: Speculate on price moves (buying calls/puts).
Institutions: Manage risk exposure across assets.
Market Makers: Provide liquidity and earn spreads.
Risk Management in Options Trading
Options can wipe out capital if not managed properly. Key practices include:
Position Sizing: Never risk more than a fixed % of capital.
Stop Loss & Exit Rules: Define risk before entering.
Diversification: Avoid concentrating all trades on one asset.
Understanding Margin: Selling options requires large margin because risks are unlimited.
Hedging: Use spreads to limit risk.

Technical Analysis Foundations1. Historical Background of Technical Analysis
Early Origins
Japanese Rice Trading (1700s): Candlestick charting was developed by Munehisa Homma, a rice trader, who discovered that market psychology and patterns could predict future prices.
Charles Dow (Late 1800s): Considered the father of modern technical analysis, Dow developed the Dow Theory, which laid the groundwork for trend analysis.
Evolution in the 20th Century
With the rise of stock exchanges in the U.S. and Europe, charting methods gained popularity.
The creation of indicators like Moving Averages, RSI, MACD, and Bollinger Bands in the mid-20th century expanded the technical toolkit.
Modern Era
Today, technical analysis is powered by computers, algorithms, and AI-based models.
Despite these advances, the core principle remains the same: history tends to repeat itself in markets.
2. Core Principles of Technical Analysis
Technical analysis is built on three central assumptions:
Price Discounts Everything
Every factor—economic, political, psychological—is already reflected in price.
Traders don’t need to analyze external events; studying price is enough.
Prices Move in Trends
Markets don’t move randomly. Instead, they form trends—uptrend, downtrend, or sideways.
Identifying and following the trend is the foundation of profitable trading.
History Repeats Itself
Human behavior in markets tends to repeat due to psychology (fear, greed, hope).
Chart patterns like Head & Shoulders or Double Tops repeat because investor reactions are consistent over time.
3. Types of Charts
Charts are the backbone of technical analysis. The three most commonly used chart types are:
1. Line Chart
Simplest chart, connecting closing prices with a line.
Best for long-term trend analysis.
2. Bar Chart
Displays open, high, low, and close (OHLC) in each bar.
Provides more detail than line charts.
3. Candlestick Chart
Invented in Japan, now the most popular.
Each candlestick shows open, high, low, and close with a body and wicks.
Offers visual insight into market psychology (bullish vs. bearish sentiment).
4. Understanding Market Structure
1. Trends
Uptrend: Higher highs and higher lows.
Downtrend: Lower highs and lower lows.
Sideways: Price consolidates within a range.
2. Support and Resistance
Support: Price level where buying pressure overcomes selling.
Resistance: Price level where selling pressure overcomes buying.
Key to identifying entry and exit points.
3. Breakouts and Pullbacks
Breakout: Price moves beyond support or resistance with strong volume.
Pullback: Temporary retracement before the trend resumes.
5. Technical Indicators
Indicators are mathematical calculations applied to price or volume data. They are divided into two main types:
1. Trend Indicators
Moving Averages (SMA, EMA): Smooth price data to identify trend direction.
MACD (Moving Average Convergence Divergence): Measures momentum and trend strength.
2. Momentum Indicators
RSI (Relative Strength Index): Identifies overbought (>70) or oversold (<30) conditions.
Stochastic Oscillator: Compares closing price to recent highs/lows.
3. Volatility Indicators
Bollinger Bands: Show price volatility around a moving average.
ATR (Average True Range): Measures market volatility.
4. Volume Indicators
OBV (On Balance Volume): Tracks cumulative buying/selling pressure.
Volume Profile: Highlights price levels where significant trading occurred.
6. Chart Patterns
Patterns represent the psychology of market participants. They are broadly classified into continuation and reversal patterns.
1. Reversal Patterns
Head and Shoulders: Signals a trend reversal from bullish to bearish.
Double Top/Bottom: Indicates a change in trend after testing a key level twice.
2. Continuation Patterns
Flags and Pennants: Short-term consolidations within a strong trend.
Triangles (Symmetrical, Ascending, Descending): Signal breakout in the direction of trend.
3. Candlestick Patterns
Doji: Market indecision.
Hammer / Shooting Star: Potential reversal signals.
Engulfing Patterns: Strong reversal signals based on candlestick body size.
7. Volume and Market Confirmation
Volume is a critical element in technical analysis:
Rising volume confirms the strength of a trend.
Low volume during a breakout may signal a false move.
Divergence between price and volume often hints at a reversal.
8. Timeframes in Technical Analysis
Intraday (1-min, 5-min, 15-min): For day traders and scalpers.
Swing (Hourly, 4H, Daily): For medium-term traders.
Position (Weekly, Monthly): For long-term investors.
The principle of Multiple Time Frame Analysis is key: Traders often analyze higher timeframes for trend direction and lower timeframes for precise entries.
9. Market Psychology and Sentiment
Technical analysis is rooted in psychology:
Fear and Greed: Drive most market movements.
Herd Behavior: Traders follow crowds, amplifying trends.
Overconfidence: Leads to bubbles and crashes.
Sentiment indicators like VIX (Volatility Index) or Put/Call ratios are often used to gauge market mood.
10. Risk Management in Technical Analysis
No strategy works without risk control. Key principles:
Position Sizing: Risk only 1–2% of capital per trade.
Stop Loss: Predetermine exit levels to minimize loss.
Risk-Reward Ratio: Aim for trades with at least 1:2 risk-reward.
Conclusion
Technical analysis is both an art and a science. It blends mathematical tools with human psychology to understand market behavior. While it has limitations, its principles of trend, support/resistance, and pattern recognition remain timeless.
For beginners, mastering chart basics, support/resistance, and risk management is the starting point. For advanced traders, integrating multiple indicators, refining strategies, and incorporating psychology make the difference.
Ultimately, technical analysis is not about predicting the future with certainty—it’s about increasing probabilities and managing risk. With discipline and practice, it becomes a powerful tool for navigating financial markets.

Derivatives & Options TradingPart 1: What Are Derivatives?
Definition
A derivative is a financial contract whose value depends (or is derived) from the value of an underlying asset, index, or interest rate. For example:
A wheat futures contract derives its value from wheat prices.
A stock option derives its value from the stock price of a company.
A currency forward derives its value from the exchange rate of two currencies.
Thus, derivatives do not have standalone intrinsic value—they only exist because of their relationship with something else.
History of Derivatives
Derivatives are not new. In fact, they date back thousands of years:
Ancient Greece (600 BCE): The philosopher Thales used an early version of an option contract to secure the right to use olive presses.
17th Century Japan: The Dojima Rice Exchange in Osaka was the world’s first organized futures market.
19th Century USA: The Chicago Board of Trade (CBOT) formalized futures contracts in commodities like wheat and corn.
20th Century: Derivatives expanded beyond agriculture into financial assets like stocks, bonds, and interest rates.
Today, derivatives markets are global, electronic, and worth trillions of dollars daily.
Part 2: Types of Derivatives
Derivatives can be classified into four major categories:
1. Forwards
Private agreements between two parties to buy/sell an asset at a future date at a predetermined price.
Customized and traded over-the-counter (OTC).
Example: A coffee exporter enters into a forward contract with a U.S. buyer to sell coffee at $2 per pound in six months.
2. Futures
Standardized contracts traded on exchanges.
Legally binding to buy/sell an asset at a set price and date.
Highly liquid, with margin requirements for risk management.
Example: Nifty 50 futures in India or S&P 500 futures in the U.S.
3. Options
Contracts giving the buyer the right (but not obligation) to buy or sell the underlying asset at a set price before/at expiration.
Two types:
Call Option → Right to buy.
Put Option → Right to sell.
Traded globally on exchanges like NSE (India), CME (USA), etc.
4. Swaps
Agreements to exchange cash flows, often involving interest rates or currencies.
Example: A company with floating-rate debt may enter into an interest rate swap to convert it into fixed-rate payments.
Part 3: Understanding Options in Detail
Among all derivatives, options stand out because of their flexibility, leverage, and strategic use.
1. Basic Terms
Underlying Asset: The stock, commodity, or index on which the option is based.
Strike Price: The pre-agreed price at which the option can be exercised.
Premium: The price paid by the option buyer to the seller (writer).
Expiry Date: The date on which the option contract ends.
Call Option: Right to buy the asset at the strike price.
Put Option: Right to sell the asset at the strike price.
2. Call Options Example
Suppose Reliance stock trades at ₹2,500. You buy a Call Option with a strike price of ₹2,600 expiring in 1 month.
If Reliance rises to ₹2,800, you exercise the call and buy at ₹2,600 (profit = ₹200 per share minus premium).
If Reliance falls to ₹2,400, you simply let the option expire (loss limited to premium).
3. Put Options Example
Suppose Infosys trades at ₹1,600. You buy a Put Option with strike price ₹1,550.
If Infosys drops to ₹1,400, you sell at ₹1,550 (profit = ₹150 minus premium).
If Infosys rises above ₹1,550, you let it expire.
4. Option Writers (Sellers)
Unlike buyers, sellers have obligations.
Call Writer: Must sell at strike price if buyer exercises.
Put Writer: Must buy at strike price if buyer exercises.
Writers earn the premium but face unlimited risk if the market moves against them.
Part 4: Option Pricing
Options pricing is complex because it depends on several factors. The most widely used model is the Black-Scholes Model, but conceptually:
Factors Affecting Option Premium:
Spot Price of Underlying – Higher stock price increases call premium, decreases put premium.
Strike Price – Closer strike to market price = higher premium.
Time to Expiry – More time = more premium.
Volatility – Higher volatility increases both call & put premiums.
Interest Rates & Dividends – Minor impact but factored in.
This combination of variables explains why options are dynamic instruments requiring constant analysis.
Part 5: Options Trading Strategies
Options are not only used for speculation but also for hedging and generating income.
1. Hedging
Example: An investor holding Infosys stock can buy a put option to protect against downside.
2. Speculation
Traders can bet on price direction with limited risk.
Example: Buying a call option before earnings announcement.
3. Income Generation
Option writers earn premiums by selling covered calls or puts.
Popular Option Strategies:
Covered Call – Holding stock + selling call option to earn premium.
Protective Put – Buying stock + buying put for downside protection.
Straddle – Buying both call & put at same strike → betting on volatility.
Strangle – Buying out-of-the-money call & put → cheaper volatility play.
Butterfly Spread – A limited-risk, limited-reward strategy based on three strikes.
Iron Condor – Popular income strategy using four legs (two calls + two puts).
These strategies allow traders to profit not only from direction but also from volatility and time decay.
Part 6: Risks in Derivatives & Options
While derivatives are powerful, they come with risks.
1. Market Risk
Prices can move unpredictably, leading to heavy losses.
2. Leverage Risk
Small moves in underlying can cause big gains/losses due to leverage.
3. Liquidity Risk
Some derivatives may be illiquid, making exit difficult.
4. Counterparty Risk
In OTC contracts, one party may default. (Exchanges reduce this via clearing houses).
5. Complexity Risk
Beginners may misunderstand how pricing works, especially with options.
This is why regulators like SEBI (India) and CFTC (USA) impose margin requirements and position limits.
Part 7: Global Derivatives Markets
Major Hubs
CME Group (USA): Largest derivatives exchange, trades in futures & options.
Eurex (Europe): Known for interest rate and equity derivatives.
NSE (India): World leader in options trading volume, especially index options.
SGX (Singapore): Popular for Asian index derivatives.
Indian Derivatives Market
Launched in 2000 with Nifty futures.
Now among the top in the world by volume.
Products include index futures, stock futures, index options, stock options, and currency derivatives.
Part 8: Real-World Applications
Hedging:
Farmers hedge crop prices with futures.
Importers hedge currency risk with forwards.
Investors hedge stock portfolios with index options.
Speculation:
Traders use leverage to profit from short-term moves.
Options allow betting on volatility.
Arbitrage:
Taking advantage of mispricing between spot and derivatives markets.
Example: Cash-futures arbitrage.
Portfolio Management:
Funds use derivatives to reduce volatility and enhance returns.
Part 9: Benefits of Derivatives & Options
Risk Management: Hedge against uncertainty.
Leverage: Control large positions with small capital.
Flexibility: Profit from direction, volatility, or even time decay.
Liquidity: Highly traded instruments (especially index options).
Price Discovery: Futures help determine fair value of assets.
Part 10: Risks & Criticism
Despite benefits, derivatives have faced criticism:
They were central in the 2008 Global Financial Crisis (credit default swaps).
Excessive speculation can destabilize markets.
High leverage magnifies losses.
Warren Buffett famously called derivatives “financial weapons of mass destruction” if misused.
Conclusion
Derivatives and options trading represent one of the most fascinating and powerful segments of financial markets. From their ancient roots in agricultural trade to their modern dominance in global finance, derivatives play a crucial role in hedging, speculation, and arbitrage.
Options, in particular, offer unmatched flexibility by allowing traders to design strategies suited to bullish, bearish, or neutral market conditions. However, with this power comes complexity and risk.
For investors and traders, the key lies in education, discipline, and risk management. Derivatives can either safeguard portfolios and create wealth—or, if misused, lead to catastrophic losses.
Thus, mastering derivatives and options trading is less about chasing quick profits and more about understanding risk, probability, and strategy in a dynamic market environment.
Part 4 Learn Institutional Trading Risks of Options Trading
Options can be powerful but come with risks:
Time Decay (Theta): Options lose value as expiry nears.
High Volatility: Premiums can fluctuate wildly.
Leverage Trap: While leverage amplifies profits, it also magnifies losses.
Unlimited Risk (for Sellers): If you sell options, your risk can be theoretically unlimited.
Complex Strategies: Advanced option strategies require deep knowledge.
How Options Work in Practice
Let’s take a step-by-step breakdown using a Nifty Call Option Example:
Nifty Spot: 20,000
You buy a Call Option with Strike = 20,000, Premium = 150, Expiry = 1 month.
Scenario A: Nifty goes to 20,500
Option intrinsic value = 500 (20,500 - 20,000)
Profit = 500 - 150 = 350 per unit × Lot size (say 50) = ₹17,500 profit.
Scenario B: Nifty falls to 19,800
Option expires worthless.
Loss = Premium × Lot size = ₹150 × 50 = ₹7,500 loss.
This shows both the leverage and limited risk nature of options.

Trading Master Class With ExpertsAdvanced Concepts
1. Implied Volatility (IV)
The market’s forecast of future volatility. High IV inflates option premiums.
2. Volatility Skew & Smile
Different strikes trade at different implied volatilities.
3. Greeks in Real Trading
Delta hedging by institutions.
Vega trading during events (like earnings).
Theta harvesting in sideways markets.
4. Algorithmic & Quantitative Option Trading
Automated strategies based on volatility models.
Statistical arbitrage between options and futures.
Case Studies & Real Examples
1. Reliance Earnings Event
Stock at ₹2,500. IV jumps before results.
Trader buys Straddle (Call + Put).
After results, volatility collapses → straddle loses money despite stock moving.
Lesson: IV matters as much as direction.
2. Bank Nifty Intraday Trading
Traders scalp weekly options for small moves.
Requires strict stop-loss and risk control.

Option Trading The Mechanics of Option Pricing
1. Intrinsic Value vs. Time Value
Intrinsic Value: The profit if the option were exercised now.
Time Value: The extra value due to remaining time until expiry.
Option Premium = Intrinsic Value + Time Value.
2. Moneyness of Options
In the Money (ITM): Immediate profit if exercised.
At the Money (ATM): Strike ≈ Current price.
Out of the Money (OTM): No immediate profit, only time value.
3. Option Greeks (The DNA of Options)
Delta: Sensitivity of option price to underlying movement.
Gamma: Sensitivity of Delta to underlying movement.
Theta: Time decay – options lose value as expiry nears.
Vega: Sensitivity to volatility.
Rho: Sensitivity to interest rates.
Understanding Greeks is critical for advanced traders.
Risks in Option Trading
Options are not risk-free.
Premium Decay (Theta Risk): Options lose value daily.
Volatility Risk: Implied volatility crush can hurt positions.
Liquidity Risk: Wide bid-ask spreads increase costs.
Assignment Risk: Writers can be forced to fulfill contracts.
Unlimited Losses: Naked option selling is dangerous.

Support & Resistance Levels for Today’s Market1. Introduction: Why Support & Resistance Matter
In trading, one of the most powerful and time-tested concepts is support and resistance (S&R). Whether you are a beginner exploring intraday charts or a seasoned trader looking at weekly setups, S&R levels act like the invisible walls of the market.
Support is a price zone where buyers step in, halting a decline.
Resistance is a zone where sellers emerge, stopping an advance.
These levels reflect the psychology of crowds, institutional behavior, and liquidity zones. Without them, trading would feel like driving without brakes or signals.
Every day, traders mark fresh S&R levels based on the previous day’s highs, lows, closes, option data, and market structure. That’s why they’re so critical in today’s market outlook.
2. The Psychology Behind Support & Resistance
To understand why these levels work, we need to dig into trader psychology:
Support Zones: Imagine a stock falling from ₹200 to ₹180. Many buyers who missed at ₹200 now feel ₹180 is a “cheap” price, so they step in. Short-sellers also book profits. This creates buying demand → market stabilizes.
Resistance Zones: Suppose the same stock climbs back from ₹180 to ₹200. Traders who bought late at ₹200 earlier may exit to break even. Short-sellers also re-enter. Selling pressure builds → market stalls.
Thus, S&R levels form from collective trader memory. The more times a level is tested, the stronger it becomes.
3. How to Identify Support & Resistance Levels for Today
For daily trading, traders usually rely on:
(a) Previous Day High & Low
Yesterday’s high often acts as resistance.
Yesterday’s low often acts as support.
Example: If Nifty made a high of 24,200 yesterday, that zone may cap today’s rallies.
(b) Opening Price & First 15-Minute Range
The opening levels define intraday sentiment.
A breakout above the first 15-min high = bullish bias.
A breakdown below the first 15-min low = bearish bias.
(c) Moving Averages
20 EMA (Exponential Moving Average) is a strong intraday S/R level.
50 & 200 EMAs act as swing-level S/R.
(d) Pivot Points
Calculated from (High + Low + Close) / 3.
Traders use them to mark Support (S1, S2, S3) and Resistance (R1, R2, R3) levels.
(e) Volume Profile Zones
High Volume Nodes (HVN) = strong support/resistance.
Low Volume Nodes (LVN) = possible breakout/breakdown areas.
(f) Option Chain Data (OI)
In index trading (Nifty, Bank Nifty), strike prices with highest Call OI = resistance.
Strike prices with highest Put OI = support.
4. Types of Support & Resistance
(a) Horizontal Levels
Flat lines connecting multiple swing highs or lows. Most commonly used.
(b) Trendline Support/Resistance
Drawn diagonally across rising lows (support) or falling highs (resistance).
(c) Fibonacci Levels
Retracement levels (38.2%, 50%, 61.8%) often act as S&R.
(d) Dynamic Levels
Moving averages, VWAP, Bollinger bands that shift daily.
(e) Psychological Levels
Round numbers like Nifty 24,000 or Bank Nifty 50,000 act as magnets for price.
5. Why Support & Resistance Work Better in Today’s Market
Today’s markets (2025) are highly algorithm-driven, but even algo models respect liquidity zones → which are essentially S&R levels.
Retail traders watch them → self-fulfilling prophecy.
Institutions place big buy/sell orders near S&R → liquidity builds.
Option writers defend key strikes → market reacts.
So, S&R remains relevant even in the era of algo trading.
6. Trading Strategies Using Support & Resistance
Let’s break down practical intraday and swing strategies:
Strategy 1: Bounce from Support
Wait for price to test support (yesterday’s low, pivot S1, etc.).
Look for bullish candlestick pattern (hammer, engulfing).
Enter long trade → Stop loss below support → Target = resistance.
Strategy 2: Reversal at Resistance
Price approaches strong resistance.
Look for bearish rejection (shooting star, Doji).
Enter short trade → Stop loss above resistance → Target = support.
Strategy 3: Breakout of Resistance
Resistance is tested multiple times.
Strong volume breakout = momentum trade.
Example: Nifty crossing 24,200 with OI shift confirms breakout.
Strategy 4: Breakdown of Support
If support breaks with volume, fresh shorts open.
Example: Bank Nifty falling below 50,000 with heavy Put unwinding.
Strategy 5: Range Trading
If market is sideways, trade between support & resistance.
Buy near support → Sell near resistance.
7. Support & Resistance in Different Timeframes
1-Min / 5-Min Charts → For scalpers, short-term S&R.
15-Min / 1-Hour Charts → Best for intraday.
Daily Charts → Strong S&R for swing & positional trades.
Weekly Charts → Long-term zones watched by institutions.
For today’s market, intraday traders focus mainly on 15-min & hourly charts.
8. Common Mistakes Traders Make
Blindly Buying at Support / Selling at Resistance
Always confirm with volume & candlestick pattern.
Ignoring Breakouts & Breakdowns
Many traders keep waiting for a bounce but miss the trend.
Using Only One Tool
Combine pivots, moving averages, and OI for better accuracy.
Forgetting Stop Loss
S&R levels can break – never trade without a plan.
9. Case Study: Support & Resistance in Nifty (Example)
Suppose Nifty closed yesterday at 24,050 with a high of 24,200 and low of 23,950.
Support Zones for Today:
23,950 (yesterday’s low)
23,900 (Put OI support)
23,850 (pivot S1)
Resistance Zones for Today:
24,200 (yesterday’s high)
24,250 (Call OI buildup)
24,300 (pivot R1)
Trading Plan:
If Nifty sustains above 24,200 with volume → Buy for 24,300.
If Nifty falls below 23,950 → Short for 23,850.
This is exactly how professionals set up today’s market trade plan.
10. Advanced Insights: Volume Profile + Options Data
A modern trader should combine:
Volume Profile → Where most trading occurred yesterday.
Options OI Shifts → Which strikes are defended/attacked today.
Price Action Confirmation → Candlestick rejections, breakouts.
This 3-way approach increases accuracy.
Conclusion: Why Support & Resistance Will Never Die
Markets evolve – from floor trading to electronic, from manual to algo. But one thing remains timeless: human behavior. Fear, greed, profit-taking, and FOMO all play out at support and resistance levels.
For today’s market, S&R acts as your trading compass.
They guide your entries and exits.
They highlight where risk is lowest and reward is highest.
They help you trade with discipline instead of emotion.
Whether you are an intraday trader, a swing trader, or an investor, mastering support and resistance is like mastering the grammar of market language. Without it, you can’t construct profitable trades.

Entry to Exit: Step-by-Step Trade Management1. Introduction
Trading is not only about finding the right entry point—it’s about how you manage your trade once you’re inside the market. Many beginners spend countless hours searching for the “perfect” entry strategy, but professionals know that trade management is where the real game is won or lost.
Think of trading as a journey. Entry is the start, exit is the destination, and trade management is the road that connects the two. Without proper management, even the best entry signals can turn into losing trades. On the other hand, with disciplined management, even an average entry can become profitable.
In this guide, we’ll break down the entire trade lifecycle—from preparation to execution, from entry to exit—step by step.
2. Pre-Trade Preparation
Before entering a trade, preparation is key. Just like a pilot runs through a checklist before takeoff, a trader should have a trade checklist.
🔹 Market Research & Analysis
Study broader market trends (bullish, bearish, sideways).
Check fundamentals (earnings reports, economic news, sector performance).
Perform technical analysis (support/resistance levels, chart patterns, moving averages).
🔹 Building a Trade Plan
A trade without a plan is like sailing without a map. A strong trade plan includes:
Entry criteria – What signals will you wait for before entering?
Stop-loss level – Where will you cut the trade if it goes against you?
Target level – Where will you take profit?
Position size – How much capital will you risk?
🔹 Defining Risk per Trade
Professional traders don’t risk everything in one trade. A common rule is the 1-2% risk rule. For example:
If you have ₹1,00,000 capital and risk 1% per trade → max loss = ₹1,000.
This ensures survival even after multiple losing trades.
3. Entry Strategies
Your entry is the first step into the battlefield. A good entry maximizes reward while minimizing risk.
🔹 Types of Entries
Breakout Entries – Entering when price breaks a key resistance/support.
Pullback Entries – Waiting for price to retrace to a support/resistance level before entering.
Reversal Entries – Entering when trend shows signs of changing direction.
🔹 Confirmation Tools
Candlestick patterns (engulfing, hammer, doji).
Indicators (RSI for momentum, MACD for trend confirmation).
Volume analysis (rising volume = strong move).
🔹 Avoiding FOMO Entries
Jumping into trades without confirmation leads to poor risk-reward setups. Always stick to your predefined entry signals.
4. Stop Loss & Risk Management
Stop-loss is your insurance policy. Without it, one bad trade can wipe out weeks of profits.
🔹 Types of Stops
Hard Stop – Pre-set level, automatically exits trade.
Mental Stop – Decided in mind, but dangerous if emotions take over.
ATR Stop – Based on volatility (Average True Range).
🔹 Break-Even Adjustment
When trade moves in your favor, shift stop-loss to entry point → removes risk.
🔹 Risk-Reward Ratio (RRR)
Only take trades with minimum 1:2 or 1:3 ratio. Example: risk ₹1,000 for potential ₹2,000–₹3,000 gain.
5. Trade Monitoring & Mid-Trade Adjustments
Once in a trade, your job is to manage it intelligently.
🔹 When Market Moves in Your Favor
Use trailing stop-loss to lock profits.
Scale out gradually (book partial profits at key levels).
🔹 When Market Moves Against You
Never widen stop-loss (it increases risk).
Accept the loss gracefully—capital preservation is priority.
🔹 Scaling In & Out
Scaling in: Add to your position as trade confirms in your favor.
Scaling out: Reduce position gradually, booking partial profits while still staying in.
6. Trade Psychology
Emotions are the biggest enemy of traders. Fear and greed often sabotage good strategies.
🔹 Common Emotional Traps
Fear of Missing Out (FOMO) – Chasing trades without signals.
Fear of Loss – Closing positions too early.
Greed – Holding too long, ignoring exit plan.
🔹 Discipline Rules
Follow your plan, not your emotions.
Accept that losses are part of the game.
Think in terms of probabilities, not certainties.
7. Exit Strategies
A trade is not complete until you exit. Profits exist only when booked.
🔹 Exit Types
Target-Based Exit – Close trade when it hits your planned profit target.
Trailing Stop Exit – Ride trend while protecting profits.
Time-Based Exit – Exit if price doesn’t move within certain time.
🔹 Letting Profits Run
The hardest skill is to hold winners long enough while not giving back gains. Trailing stops help balance safety & profit.
🔹 Avoid Early Exits
Many traders exit too soon because of emotions. Always follow your planned exit rule, not short-term market noise.
8. Post-Trade Review
Every trade—win or lose—is a learning opportunity.
🔹 Trading Journal
Record every trade:
Entry, exit, stop-loss.
Reasons for trade.
Emotions felt.
Lessons learned.
🔹 Review Process
Analyze losing trades → were they due to bad setup or bad discipline?
Analyze winning trades → did you follow your plan, or was it luck?
Constantly refine your strategy.
9. Conclusion
Trade management is the bridge between analysis and profitability. The entry may give you the opportunity, but it’s management that determines the outcome.
Prepare before you trade.
Enter only with clear signals.
Manage risk with position sizing and stop-loss.
Control emotions during the trade.
Exit with discipline.
Learn from every trade.
By mastering trade management, you shift from gambling to professional trading. In the end, trading isn’t about predicting the market perfectly—it’s about managing uncertainty profitably, from entry to exit.
Part 7 Trading Master Class With ExpertsOptions vs. Futures vs. Stocks
Stocks: Simple ownership.
Futures: Obligation to buy/sell at a future date.
Options: Rights without obligation.
Options are less risky than futures (for buyers) but more complex.
Real-World Examples
Example 1: You buy Nifty 20,000 Call at ₹100 premium. Lot size = 50.
Cost = ₹5,000.
If Nifty rises to 20,200, your profit = ₹10,000 - ₹5,000 = ₹5,000.
If Nifty stays below 20,000, you lose only premium = ₹5,000.
Psychology & Risk Management
Options are not just math, they need psychology:
Don’t over-leverage.
Accept losses early.
Use stop-loss.
Stick to defined strategies.
Manage emotions of greed and fear.

Part 6 Learn Institutional Trading Deep Dive into Option Strategies
One of the biggest advantages of options is the ability to combine them into structured strategies. Let’s expand on some common and advanced ones:
A. Single-Leg Strategies
These involve buying or selling just one option.
Long Call: Buy a call option expecting prices to rise.
Low risk (limited to premium paid).
High reward if stock surges.
Long Put: Buy a put option expecting prices to fall.
Best for bearish outlook.
Acts as portfolio insurance.
Short Call (Naked Call): Sell a call without owning stock.
You receive premium.
Unlimited risk if stock rises sharply.
Short Put (Naked Put): Sell a put option.
You receive premium.
Big risk if stock collapses.
B. Multi-Leg Strategies (Spreads & Hedging)
Bull Call Spread: Buy a lower strike call & sell a higher strike call.
Profits if stock rises moderately.
Lower risk than naked call.
Bear Put Spread: Buy higher strike put & sell lower strike put.
Works in moderately bearish markets.
Covered Call: Own stock + sell call option.
Generates steady income.
Capped upside potential.
Protective Put: Own stock + buy put option.
Insurance against stock falling.

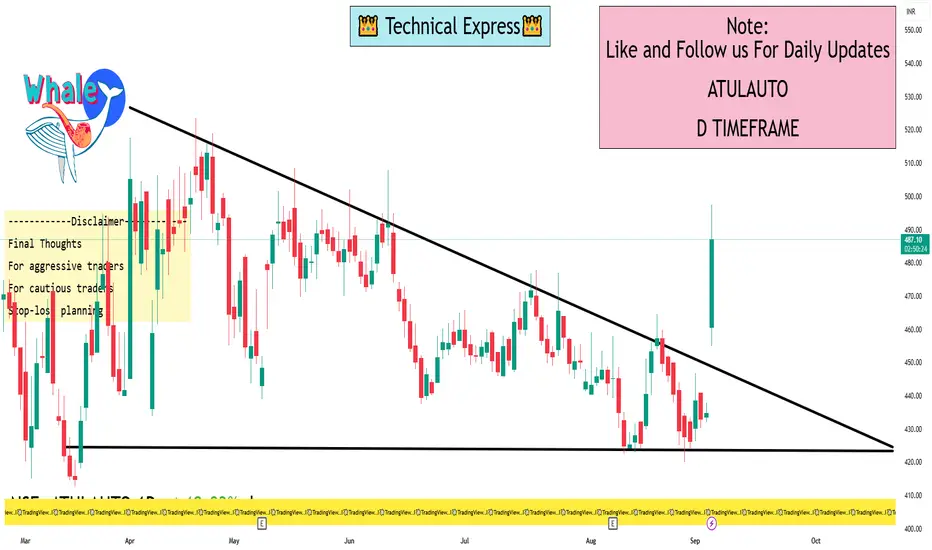
ATULAUTO 1 Day ViewIntraday Support & Resistance (1-Day Level)
MunafaSutra reports:
Short-term Resistance: ₹434.01 and ₹438.97
These levels are cited as valid for intra-day trading scenarios
ICICI Direct shows:
First Support: ₹422.5
Second Support: ₹418.7
Third Support: ₹413.2
Second Resistance: ₹437.2
Third Resistance: ₹441.0
Summary of intraday levels:
Support zone: ~₹422–₹419
Resistance zone: ~₹437–₹441
Current Price Context
ICICIdirect shows a day high of ₹499.05 and day low of ₹449.00, with a last traded price around ₹490.20 as of September 4, 2025
Investing.com also confirms this high volatility range: day’s range ~₹454.95 to ₹497.60
This suggests the stock has already experienced a significant intraday rally, trading well above the traditional short-term resistance levels noted by analysts.
Technical Ratings (Daily Basis)
TradingView categorizes the 1-day timeframe technical summary for Atul Auto as "Neutral" across both Oscillators and Moving Averages
Final Thoughts
For aggressive traders: A breakout above the ₹495–₹503 zone could spark further upside.
For cautious traders: Watch for potential consolidation and hold above ₹475–₹484 as signs of strength. A dip to ₹434–₹444 still maintains bullish structure for now.
Stop-loss planning: Consider trailing protection below key support levels, e.g., around the pivot zone (₹475) or lower support (₹434).
Part 10 Trading Masterclass With ExpertsTypes of Options
There are two fundamental types of options:
(a) Call Option
A call option gives the buyer the right to buy the underlying asset at a fixed strike price before or on expiration.
Buyers of calls expect the price to rise.
Sellers of calls expect the price to stay flat or fall.
Example:
Suppose you buy a call option on TCS with a strike price of ₹3,500, expiring in one month. If TCS rises to ₹3,800, you can exercise the option and buy at ₹3,500, making a profit. If TCS stays below ₹3,500, you lose only the premium.
(b) Put Option
A put option gives the buyer the right to sell the underlying asset at the strike price before or on expiration.
Buyers of puts expect the price to fall.
Sellers of puts expect the price to rise or stay stable.
Example:
You buy a put option on Infosys with a strike of ₹1,500. If Infosys drops to ₹1,200, you can sell at ₹1,500 and earn profit. If Infosys stays above ₹1,500, you lose only the premium.
The Four Basic Positions
Every option trade can be boiled down to four core positions:
Long Call – Buying a call (bullish).
Short Call – Selling a call (bearish/neutral).
Long Put – Buying a put (bearish).
Short Put – Selling a put (bullish/neutral).
All advanced strategies are combinations of these four.

Part 9 Trading Masterclass With ExpertsIntroduction to Options
An option is a type of derivative contract. A derivative derives its value from an underlying asset, which could be a stock, index, commodity, currency, or bond. When you buy or sell an option, you don’t directly own the asset but instead own the right to buy or sell it at a pre-agreed price within a specific period.
At its core, an option is a contract between two parties:
The buyer (holder) of the option, who pays a premium for rights.
The seller (writer) of the option, who receives the premium and carries obligations.
Unlike shares, where ownership is straightforward, options deal with probabilities, rights, and conditions. This makes them flexible but also more complex.
Key Features of Options
Before diving deeper, let’s simplify the main features:
Underlying Asset – The financial instrument on which the option is based (e.g., Reliance Industries stock, Nifty50 index).
Strike Price (Exercise Price) – The price at which the underlying asset can be bought or sold.
Expiration Date (Maturity) – The last date the option can be exercised.
Option Premium – The cost of buying the option, paid upfront by the buyer to the seller.
Right but Not Obligation – The buyer can choose to exercise the option but is not compelled to.

Part 7 Trading Masterclass With ExpertsOptions Greeks and Their Role
Every strategy depends heavily on the Greeks:
Delta: Sensitivity to price changes.
Gamma: Rate of change of delta.
Theta: Time decay of option value.
Vega: Sensitivity to volatility.
Rho: Sensitivity to interest rate changes.
Traders use Greeks to fine-tune strategies and manage risk exposure.
Risk Management in Options
Risk control is crucial. Key principles:
Never risk more than you can afford to lose.
Use spreads instead of naked options.
Monitor Greeks daily.
Diversify across strikes and expiries.
Set stop-loss and exit plans.

Part 2 Ride The Big Moves Why Use Options Trading Strategies?
Options are powerful, but without strategy, they are risky. Strategies are used to:
Hedge Risks – Protect existing investments from price fluctuations.
Speculate – Bet on the direction of stock prices with controlled risk.
Generate Income – Earn steady returns through premium collection.
Leverage Capital – Control larger positions with smaller investments.
Diversify Portfolio – Use non-linear payoffs to balance stock positions.
Classification of Option Strategies
Broadly, option trading strategies can be divided into:
Directional Strategies – Profiting from a specific market direction (up or down).
Non-Directional Strategies – Profiting from volatility regardless of direction.
Income Strategies – Generating consistent returns by selling options.
Hedging Strategies – Protecting existing portfolio positions.

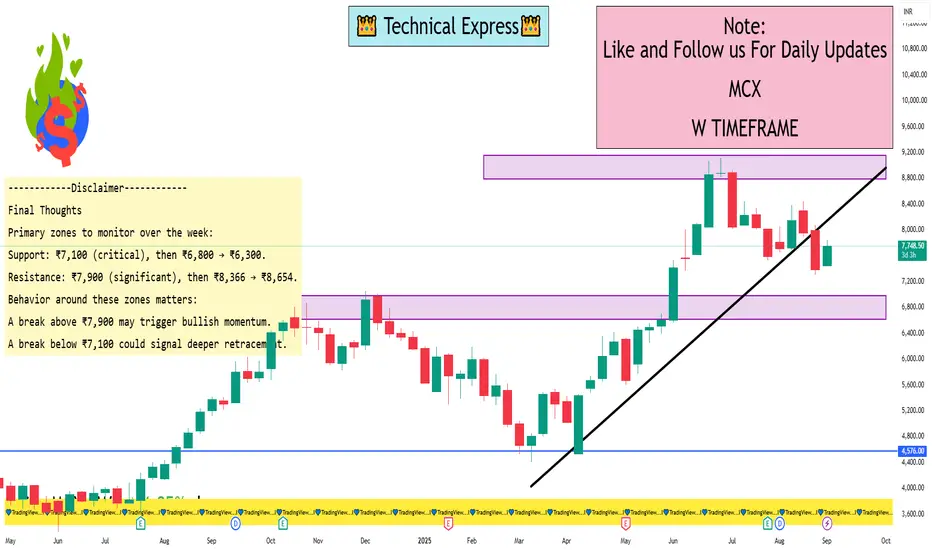
Multi Commodity Exchange of India Ltd 1 Week ViewWeekly Time-Frame: Key Levels (Pivot-Based)
Using weekly pivot-point analysis from TopStockResearch:
Resistance Levels:
R1 (Standard): ₹7,878.33
R2 (Standard): ₹8,366.67
R3 (Standard): ₹8,653.83
Pivot Point (PP): ₹7,591.17
Support Levels:
S1 (Standard): ₹7,102.83
S2 (Standard): ₹6,815.67
S3 (Standard): ₹6,327.33
This gives a broad weekly trading range: ₹6,327 – ₹8,654.
Weekly Outlook (EquityPandit as of Sept 1–5, 2025)
Immediate Support: ₹7,102.83
Immediate Resistance: ₹7,878.33
Secondary Support: ₹6,815.67
Secondary Resistance: ₹8,366.67
Extended Range (week’s extremes): ₹6,327.33 – ₹8,653.83
Intraday to Short-Term Levels (EquityPandit)
Support Zones: ₹7,548 – ₹7,302 – ₹7,166
Resistance Zones: ₹7,929 – ₹8,065 – ₹8,311
Interpretation & Strategy
Key Weekly Range: ₹7,100 – ₹7,900.
Holding above ₹7,100 indicates potential to rally toward ₹7,900–₹8,000, with further resistance toward ₹8,366–8,654.
A break below ₹7,100 could expose downside risk to ₹6,800, and possibly ₹6,300 if weakness intensifies.
Aggressive traders may watch:
Short-term range: ₹7,300–₹7,550 (support) vs ₹7,900–₹8,300 (resistance).
Pivot point note: Weekly pivots are derived from previous weeks’ price action using high, low, and close, and provide leading signals for potential reversal or breakout zones
Heritage Foods Ltd 1 Day ViewIntraday Price Levels
Moneycontrol reports:
Open: ₹470.00
High: ₹487.00
Low: ₹467.00
Previous Close: ₹470.00
Reuters indicates:
Range: ₹467.00 – ₹479.30
Previous Close: ₹470.05
Investing.com (Historical Data) shows for September 2, 2025:
Open: ₹470.00
High: ₹481.85
Low: ₹468.00
Close: ₹480.25 (~+2.18%)
Financial Express (Sector Snapshot):
Price: ₹481.00
Day Change: +₹10.95 (+2.33%)
What Does This Tell Us?
Overall Trend: Heritage Foods opened at ₹470 and traded higher throughout the day.
Intraday High: Between ₹479 to ₹487, depending on the source.
Intraday Low: Narrow, ranging from ₹467 to ₹468.
Close / Mid Range Level: Around ₹480–₹481, indicating a bullish closing range.
Volatility Range: Intraday movement spanned up to 20 points (~4%), showing decent trading activity.

Things Traders Should Avoid1. Ignoring Risk Management
One of the biggest mistakes traders make is trading without a clear risk management plan. Risk management is the backbone of trading. Without it, even the best strategies will eventually fail.
Key Errors to Avoid:
Over-leveraging: Using high leverage magnifies both profits and losses. Many traders blow up accounts by taking oversized positions.
Not using stop-loss orders: Some traders believe they can manually exit trades at the right time. In reality, markets move too fast, and emotions cloud judgment.
Risking too much on one trade: A common guideline is not to risk more than 1–2% of trading capital per trade. Ignoring this rule can wipe out months of profits in a single mistake.
No position sizing strategy: Jumping into trades with random lot sizes leads to inconsistent results.
👉 Example: Imagine a trader with $10,000 capital risks $5,000 on one trade because they feel “confident.” If the trade goes wrong, half the account is gone. Recovering from such a loss requires a 100% gain, which is extremely difficult.
2. Overtrading
Overtrading happens when traders place too many trades, often driven by greed, boredom, or revenge trading.
Mistakes Within Overtrading:
Chasing the market: Entering trades without proper signals because of fear of missing out (FOMO).
Revenge trading: After a loss, trying to “get back” money quickly by doubling positions.
Trading without rest: Markets will always offer opportunities. Overexposure reduces focus and increases mistakes.
👉 Example: A trader loses $200 on a bad trade. Instead of stopping to analyze the mistake, they place another trade with double the position size, hoping to win back losses. Often, this leads to an even bigger loss.
3. Lack of Trading Plan
Trading without a structured plan is like sailing without a compass. A trading plan defines when to enter, when to exit, how much to risk, and which strategies to follow.
Common Errors:
Random decision-making: Buying or selling based on gut feeling.
No journal keeping: Traders who don’t document their trades cannot identify patterns in their mistakes.
Constantly changing strategies: Jumping from one method to another without giving it time to work.
👉 Example: A trader buys a stock because they “heard on TV it’s going up.” Without entry rules, stop-loss, or profit target, the trade is based purely on luck.
4. Letting Emotions Control Decisions
Trading psychology is often more important than technical skills. Emotional trading leads to poor decisions.
Emotional Traps:
Fear: Prevents traders from taking good trades or causes them to exit too early.
Greed: Leads to holding onto winning positions for too long until profits disappear.
FOMO: Entering trades late because others are profiting.
Ego & overconfidence: Refusing to admit mistakes, holding onto losing trades in the hope they recover.
👉 Example: A trader buys a stock at ₹500, it rises to ₹550, but instead of booking profit, greed makes them wait for ₹600. The stock falls back to ₹480, turning profit into loss.
5. Trading Without Education
Many beginners jump into trading with little knowledge, believing they can “figure it out as they go.” This often ends in losses.
What Traders Avoid Learning:
Market fundamentals: Basic concepts like how interest rates, inflation, or company earnings affect prices.
Technical analysis: Chart patterns, indicators, and price action signals.
Risk-reward ratio: Understanding whether a trade is worth the potential risk.
Brokerage & fees: Ignoring transaction costs that eat into profits.
👉 Example: A new trader hears about “options trading” and buys random call options without knowing how time decay works. Even though the stock moves slightly in their favor, the option premium decays, and they lose money.
6. Relying Too Much on Tips & News
Traders who depend solely on TV channels, social media influencers, or WhatsApp tips rarely succeed.
Mistakes:
Acting on rumors: Many news stories are exaggerated or already priced in.
Not verifying sources: Following random advice without checking fundamentals or technicals.
Late entry: By the time news is public, smart money has already acted.
👉 Example: A trader buys a stock after hearing “strong quarterly results” on TV. But by then, the stock is already up 10%. The trader enters late and suffers when the price corrects.
7. Ignoring Market Trends
Fighting the trend is one of the costliest mistakes. Many traders try to “pick tops and bottoms” instead of riding the trend.
Errors:
Catching falling knives: Buying a stock just because it “has fallen too much.”
Selling too early in a bull run: Going short against strong upward momentum.
Not respecting price action: Ignoring charts that clearly show the trend direction.
👉 Example: During a bull market, a trader repeatedly short-sells thinking “this rally can’t last.” Each time, they lose money as the market keeps moving higher.
8. Poor Time Management
Successful trading requires patience and timing. Rushing into trades or neglecting the right timeframes leads to losses.
Errors:
Day trading without time: Traders with full-time jobs trying to scalp during lunch breaks.
Ignoring timeframes: Using a 1-minute chart for long-term investments or a daily chart for intraday scalps.
Not waiting for setups: Jumping in before confirmation.
👉 Example: A trader sees a stock forming a breakout pattern but enters early. The stock pulls back before breaking out, hitting their stop-loss.
9. Overcomplicating Strategies
Many traders load their charts with 10+ indicators, hoping for a perfect signal. In reality, complexity leads to confusion.
Mistakes:
Indicator overload: RSI, MACD, Bollinger Bands, Stochastic, all at once.
No price action focus: Forgetting that price itself is the ultimate indicator.
Constant tweaking: Changing settings after every losing trade.
👉 Example: A trader waits for five indicators to align before trading. By the time the signals confirm, the price has already moved.
10. Lifestyle & Psychological Habits to Avoid
Trading is not just about charts and strategies—it’s also about mindset and lifestyle.
Mistakes:
Lack of sleep: Fatigue reduces focus and increases impulsive decisions.
Trading under stress: Personal problems or financial pressure cloud judgment.
Unrealistic expectations: Believing trading will double money every month.
Neglecting health: Sitting for hours without breaks affects mental sharpness.
👉 Example: A trader under debt pressure tries to make “quick money” by doubling account size. Stress pushes them into risky trades, worsening the situation.
11. Not Adapting to Market Conditions
Markets are dynamic. A strategy that works in a trending market may fail in a range-bound market.
Errors:
Rigid strategies: Refusing to adapt when volatility changes.
Ignoring global events: Economic data, elections, or geopolitical tensions affect all markets.
No backtesting: Not testing strategies across different conditions.
👉 Example: A trader uses breakout strategies during low volatility. Instead of clean moves, the market fakes out, hitting stop-loss repeatedly.
12. Treating Trading Like Gambling
Trading is about probabilities, not luck. When traders treat it like a casino, losses are inevitable.
Mistakes:
All-in bets: Putting entire capital on one trade.
No analysis: Buying or selling randomly.
Relying on luck: Believing one “big trade” will make them rich.
👉 Example: A trader bets entire account on a penny stock hoping it will double. Instead, the stock crashes, wiping them out.
Conclusion
Trading can be rewarding, but only for those who avoid the common traps. The key things traders should avoid include:
Ignoring risk management
Overtrading
Trading without a plan
Emotional decision-making
Relying on tips and news
Fighting the trend
Poor time management
Overcomplicating strategies
Unrealistic expectations
The markets will always be uncertain. A trader’s job is not to predict perfectly but to manage risk, follow discipline, and protect capital. By avoiding the mistakes outlined above, traders can significantly improve their chances of long-term success.