Hdfclifeanalysis
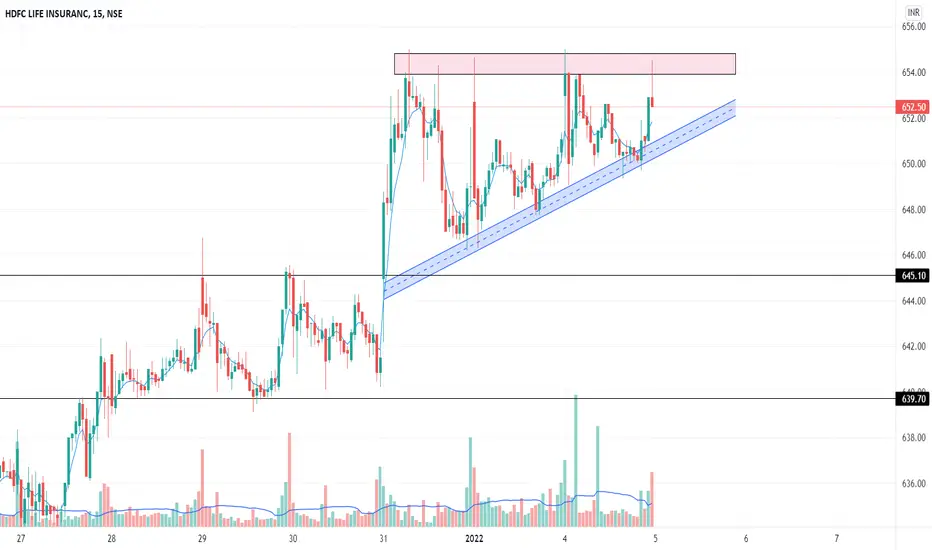
Simple Trade Setup | HDFCLIFE | 16-12-2021 [ INTRADAY ]NSE:HDFCLIFE
Observations:
1) On 1hr time frame, we can see it has major suppor range of 660-665 level range.
If it sustain above it then we can see an good upmove.
Also we can see the resistance Trendline.
Please refer below chart : 1hr Time Frame.
-------------------------------------
Trade Setup for Date: 16-12-2021
1) Don't Jump in to trade at the beginning of the market. Let it get settle for 15-20min first and judge the price action.
2) Everything is mentioned on the chart. I hope it is easy to understand.
3) All the levels will work as support, resistance, entry and exit w.r.t price action near that level.
4) Avoid gap up or gap down chase. Wait and trade between levels.
Please refer below chart for levels.
Hope I made it easy to understand it.
Do comment your doubt or suggestion.
Note: Trade with Strict SL. It may or may not hit all the levels. So one can book profit / loss at respective level considering how price action works near that level.

HDFC Life Insurance Company Ltd - 05.12.2021HDFC Life Insurance Company Ltd - 05.12.2021
The stock is trading @ 691 levels
There is an Engulfing Bear in daily chart
The prices are below ema
Stochastic overbought in daily chart
The stock is trading under a Channel Range
Let the prices go below 687
watch out for the price action

NSE:HDFCBANK trying to bounce from support levelsNSE:HDFCBANK
#NSE:HDFCBANK bouncing from support, all the levels marked on chart !!!

Hdfclife breakout After a long time and Weekly and daily breakout .Targets and Sl on the charts ! IF there is a dip can add too ! FUNDAMENTALLY good stock .Short term 745 760 775 850 .. long term 1k .

HDFC Life FuturesBuy HDFC Life
Trading above 20 EMA in 15m charts.
RSI above 50
Comfortable above resistance.
Double bottom pattern.

HDFCLIFE on keep on radarNSE:HDFCLIFE
HDFCLIFE can look for buy above 692/693
short term
First target will be 699/702
second target will be 705
more to go up..


BUY HDFC LIFE ABOVE 706HDFC Life looks a good buy if sustains above 706 for the marked targets until 688 is intact on a closing basis.
To motivate me, Please like the idea If you agree with the analysis.
Happy Trading!
InvestPro India Team

HDFCLIFE : Reversal HDFCLIFE
- Perfectly reveres from support.
- can give good R:R
Just for Educational purpose only.

HDFC LIFEHDFC LIFE ek din market ek hi jagah pr hold kiya hai jaise hi market 740 ke up close hota hai to hmm log buye kre ge aur T1 760 baniye ge ok , aur marke niche jab aaye to is 729 level ko breack hone ke bad hmm log sell kre ge aur 200 ema fist T1 leye ge

HDFC Life Insurance View*Support Zone
*In a Range for many Days
*Falling Volumes
If 660 Support Zone break Short Tgt Is 620
if 679 Resistance zone will break then Long TGT Will be 720
*Always Enter With good confirmation & Maintain proper Risk Reward.
******* Knowledge Purpose only ********
I am not a SEBI registered adviser. All the information provided by me are for educational/informational purposes only. There have been no promises, guarantees or warranties suggesting that any trading/investing based on any information, will result in a profit or will not result in a loss.
>> Visit My Ideas Page for Daily Stock Analysis & check my previous stock analysis how accurate they are for Swing and Intraday Trades<<


LNA-IRCTC, HEROMOTO, HDFCLIFE, ATULAUTO, AMARAJA, TAMO and moreLNA stand for Late night analysis
Follow me on trading view: in.tradingview.com
We discuss potential stocks provided by you guys only in my DMs and comment sections so give your stocks in comments and DM me for tommorows video :)
👑 Terms used if you don't know :
✣ Contraction pattern: A pattern starting with a broadening high candlestick and low candlestick and converging to a fixed point, these highs and lows created in between them are bulls vs bears fight going on inside the pattern and if it comes to the lower part of it, surely bulls will take it to the topmost point and vice-versa until one of them wins
✣ Structure and trend: Two types of trends that exist in the market today are uptrends and downtrends. Each type of trend tells a different story and has its own impact on a trader's success in the market. While uptrends show a series of higher highs and higher lows, downtrends show lower highs and lower lows
✣Breakout: Breakouts are commonly associated with ranges or other chart patterns, including triangles( HERE WE WILL SEE THIS ONE ), flags, wedges , and head-and-shoulders. These patterns are formed when the price moves in a specific way which results in well-defined support and/or resistance levels. Traders then watch these levels for breakouts
✣ RSI DIVERGENCE: A bullish divergence occurs when the RSI creates an oversold reading followed by a higher low that matches correspondingly lower lows in the price. This indicates rising bullish momentum, and a break above oversold territory could be used to trigger a new long position.
✣ Supply/ Demand: In the supply zone , the prices are higher than the bid price, and in the demand zone , they are lower. The bid price is what a trader is willing to pay for a stock
👑 Important levels - explained well
👑 Comment your thoughts and queries regarding anything on this analysis of mine, feel free buddy :)
⌛ Motivational and psychological area ⌛
✣Trade only if you are in the right mindset, if you have been emotionally weak for some time, take your time and don't trade, trade with a happy and + mindset only.
✣If you want to make money, firstly be prepared to lose it, only that much which you can afford and that much by which you can make a mistake again, learn from them and grow
✣Don't lose hope and keep grinding
✣I have seen my friends on youtube streaming games with watching 10, constantly they streamed for a year or two and now they are buzzing with 1k to 2k watching daily.
✣Focus on the process, you are here to make money not stupid decisions and lose it all
✣No one will help you climb the mountain, few will tell the path, so follow good people, make good mentors and make good decisions and choices in the stock market.
✣Believe in yourself :)
🎓🎓 Some info about me :)
➼My name is Apoorv and I am a 2nd year Engineering student, I want to pursue trading as my career, and thus whatsoever setups or trades I potentially see on my charting platform, I post it here and share them with you all.
➼I hope you will love my simple analysis style.
➼Feel free to suggest your view on this as learning is earning here :)
➼I take my trades on my Zerodha account :)
➼I don't take all the trades I post
➼These charts are my and only my work, my thought process, just from an educational point of view and no calls

HDFC Life moving for BONSE:HDFCLIFE
Vol addition
can add small qty now
add more on dips
T1 735,750, 770
Support 650

hdfc life hdfc life: weekly chart: inverse head n shoulder pattern breakout retest with neckline breakout with apnawala candle on weekly chart time to buy delivery for next 90 days. tgt 750/770/800 SL 670 on closing basis.

HDFCLIFE: Bullish Formation of ending diagonal & a impulse move on lower time frame suggest that the stock is ready to get retraced fully from where it has been started. Buy on cmp with SL of 674, add on dips (if any) & look for the target of 720-25 area


HDFC LIFE BUY ZONE || GOOD 12% MOVE EXPECTED || BUYPlease check the chart and comment if you have any doubts.

HDFC Life IDEA!Use Bollinger Bands as an indicator in Tradingview.
Buy at the lower band and sell at the upper band.
This makes trading easy.
This is our new recommendation also "HDFC Life"
You can buy it NOW and sell it at the upper band.
*NOTE: ITS BAND CAN VARY ON TRADING DAYS.*

HDFCLIFE || Inverse Head And Shoulders ||SWINGInverse Head And Shoulders :--
The price falls to a trough and then rises; the price falls below the former trough and then rises again; finally, the price falls again but not as far as the second trough. Once the final trough is made, the price heads upward, toward the resistance found near the top of the previous troughs.
Buy - Above 730
TG1-880

Head and Shoulder Pattern in HDFCLIFE sell below 702If HDFCLIFE breakout the support and trading below 702 then possible further downfall in this stock up to 675. Only Short position if trading below the head and shoulder support.
