Surya roshni reversal pattern breakoutSurya roshni reversal pattern breakout.
inverted head & shoulders pattern breakout.
It may go up to 740.
as per pattern target.
Note: only for learning, trade at your own risk.
Head_and_shoulder

Linc LimitedLINC:- Stock has done upside move by forming head and shoulder pattern and may breakout as well but now it is back for retesting if it is found between 447 to 455 then we can plan to buy
#You can plan the trade as per your risk appetite now
Hello traders,
As always, simple and neat charts so everyone can understand and not make it too complicated.
rest details mentioned in the chart.
will be posting more such ideas like this. Until that, like share and follow :)
check my other ideas to get to know about all the successful trades based on price action.
Thanks,
Ajay.
keep learning and keep earning.

Rising Interest Rates - Problem for high debts companies. Tata Motors clear Head & Shoulder break down as we saw in Tesla so target for TELCO is around 300 levels & in Elliott Wave counts we are in Wave 1 of (C) which could take us till 365 levels before bouncing in Wave 2 of (C) which might result is retest of Neckline around 400 Levels.

Hold 4-5 Days and Gain 5%Inverse Head & Shoulder Pattern Breakout in CHAMBAL FERTILISER
Book profits within the first 30 minutes of the market opening
- Try to exit by taking 5-6% profit of each trade
- SL can be taken when the 5/15 min candle closes below 44EMA
Now, why do I prefer swing trades? The primary reason is that I have observed that 90% of the stocks give most of the movement in just 3-4 days and the rest of the time they either consolidate or fall
CMP- 307
Target Price 323
Note:- I am not SEBI Registered This Trade is only educational Purpose

ANURASANURAS:- Head and shoulders pattern has been formed, breakout has been given, but take care of the breakout candle, where it gives closing.
Hello traders,
As always, simple and neat charts so everyone can understand and not make it too complicated.
rest details mentioned in the chart.
will be posting more such ideas like this. Until that, like share and follow :)
check my other ideas to get to know about all the successful trades based on price action.
Thanks,
Ajay.
keep learning and keep earning.

JMC Projects (India) LimitedJMCPROJECT:- Head and shoulder pattern is formed, plan something only after the breakout, till then keep your eye
Hello traders,
As always, simple and neat charts so everyone can understand and not make it too complicated.
rest details mentioned in the chart.
will be posting more such ideas like this. Until that, like share and follow :)
check my other ideas to get to know about all the successful trades based on price action.
Thanks,
Ajay.
keep learning and keep earning.

Dynamic Cables LimitedDYCL:- Head and shoulder pattern is made and that too with good volumes. Keep your eye on it.
Hello traders,
As always, simple and neat charts so everyone can understand and not make it too complicated.
rest details mentioned in the chart.
will be posting more such ideas like this. Until that, like share and follow :)
check my other ideas to get to know about all the successful trades based on price action.
Thanks,
Ajay.
keep learning and keep earning.

Short - Trend line Break & Neckline Break, Now at ResistanceIn past few days reliance has break both the trend line and neckline of head and shoulder, currently trading at resistance level 2580, there is high likelihood this will be rejected.
CMP - 2575
Target - 2540, 2510
Stoploss - 2610
Disclaimer
The above study is only for education and research

H&S pattern in HINDUNILVR ???!!!!Chart depicts the situation...
Strong DOJI candle on 9th december(day candle) with volume at perfect resistance level shows some sort of lag in bulls approach, which may leave space for bears to get back to go through a down swing move inside the triangular primary channel.(clearly seen in weekly time frame)
Now, coming to 2hr time frame,
1. Head and Shoulders pattern (right shoulder in progress..)
2. Entry can be after breakdown after the right shoulder.
3. Risky entry can be now....with a SL ON 2HR CANDLE CLOSING ABOVE 2721.
4. Target levels as mentioned in chart.
Let's wait and watch ...how it moves...!!!
Note- just sharing my view....not a tip nor advice!!!

Good swing pickThe stock has made a head and shoulder pattern and given a strong closing today. Sell above 19550 level for both intraday and swing .
first target 5% Carry only on day closing above trigger basis.

BANKBARODABANKBARODA:- Stock has formed head and shoulders, good for short term, keep an eye.
Hello traders,
As always, simple and neat charts so everyone can understand and not make it too complicated.
rest details mentioned in the chart.
will be posting more such ideas like this. Until that, like share and follow :)
check my other ideas to get to know about all the successful trades based on price action.
Thanks,
Ajay.
keep learning and keep earning.

ASAHIINDIAASAHIINDIA:- Head and shoulders pattern forming, keep an eye on it
Hello traders,
As always, simple and neat charts so everyone can understand and not make it too complicated.
rest details mentioned in the chart.
will be posting more such ideas like this. Until that, like share and follow :)
check my other ideas to get to know about all the successful trades based on price action.
Thanks,
Ajay.
keep learning and keep earning.

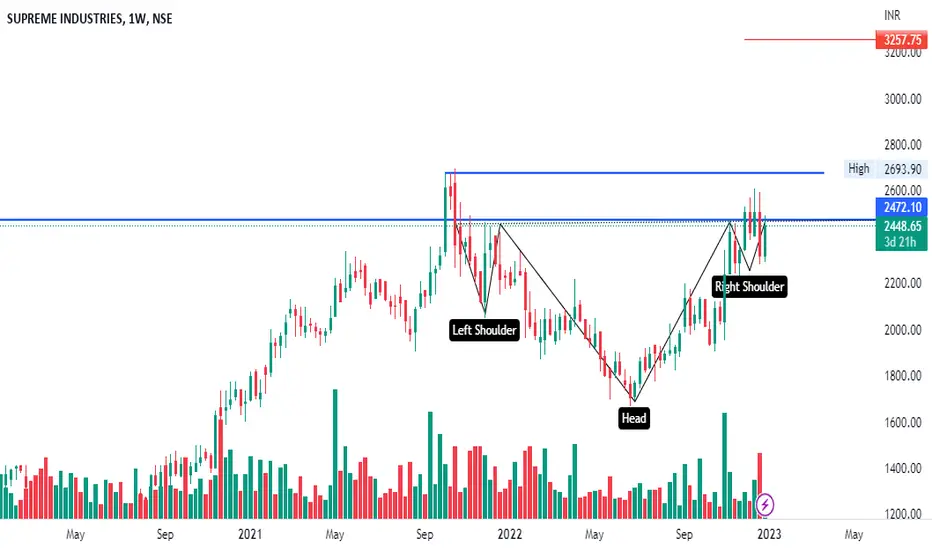
SUPREMEINDSUPREMEIND:- Head and shoulder pattern is showing formation, volume is also good, make some plans only after 2693, till then keep an eye.
Hello traders,
As always, simple and neat charts so everyone can understand and not make it too complicated.
rest details mentioned in the chart.
will be posting more such ideas like this. Until that, like share and follow :)
check my other ideas to get to know about all the successful trades based on price action.
Thanks,
Ajay.
keep learning and keep earning.
WABAGWABAG:- Head and shoulders pattern is showing formation, make action plan only after breakout, keep on eye.
Hello traders,
As always, simple and neat charts so everyone can understand and not make it too complicated.
rest details mentioned in the chart.
will be posting more such ideas like this. Until that, like share and follow :)
check my other ideas to get to know about all the successful trades based on price action.
Thanks,
Ajay.
keep learning and keep earning.

M&M ASKING FOR A SHORTM&M ( leading auto sector brand ) is making a head and shoulder pattern in its daily chart and could go below 1000.
One can buy january puts or short future according to thier risk management ......
This is only my assumption please do your own anaylsis before trading..........

Nifty Down to 18000 range ??!!!Chart pattern insisting the opinion titled above!!
Reasons:
1. 9th December Day Candle - Bearish engulfing candle with wick at bottom ( but low got tested the next day ) .
2. H&S pattern in process (right shoulder yet to form).
3. Major Trendline resistance above.
Target and Sacred SL mentioned in chart !!
Let's see how it moves!!!
Note - Just sharing my probable view....not a tip nor advice!!!!!

HEAD AND SHOULDER BREAKOUT (AWL)Head And Shoulder Breakout
CMP: 435
Targets for Downside: 591 and 551
SL: 671 Above Previous Swing High
AWL Broke this years major support retested the support area and now heading to downside.
Disclaimer: This is for educational purposes only, not any recommendations to buy or sell.

Natural gas farming too many head & shoulders patterns 20 Dec 22There are multiples Head and Shoulder pattern seen in Natural gas in Daily and Weekly timeframe make us feel bearish below 436

POSITIONAL VIEW S&P500 - SHORTS&P500 is continiously rejecting from its long term counter trend line
there is a huge possibility that s&p500 will touch its pre-pandemic level very soon

MAHINDCIEMAHINDCIE:- formed head and shoulder pattern, wait for proper breakout. keep on eye
Hello traders,
As always, simple and neat charts so everyone can understand and not make it too complicated.
rest details mentioned in the chart.
will be posting more such ideas like this. Until that, like share and follow :)
check my other ideas to get to know about all the successful trades based on price action.
Thanks,
Ajay.
keep learning and keep earning.

ICICI Bank : Swing Trade for +1.62% upside potential14 Dec 2022
Nice consolidation for past 2 weeks can be seen in the stock, 936 zone is respected for the said period, likely BO
Trade can be above 936 with stop below 930 for potential Target of 939-943-947-950
Wish You Happy & safe trading
Views are for ‘’EDUCATIONAL PURPOSE ONLY’’ trade at your own risk.
"Always Respect Risk"
Happy Trading
Jai Hind Jai Bharat

Nifty inverse head and shoulders It's educational purpose before investing consult ur financial advisor.check for patter breakout untill yellow zone..

Dow looks like has further downside Dow is looking like coming down to 32500 soon
a head and shoulder pattern formation
Maribozu at the neck like
Be aware!
