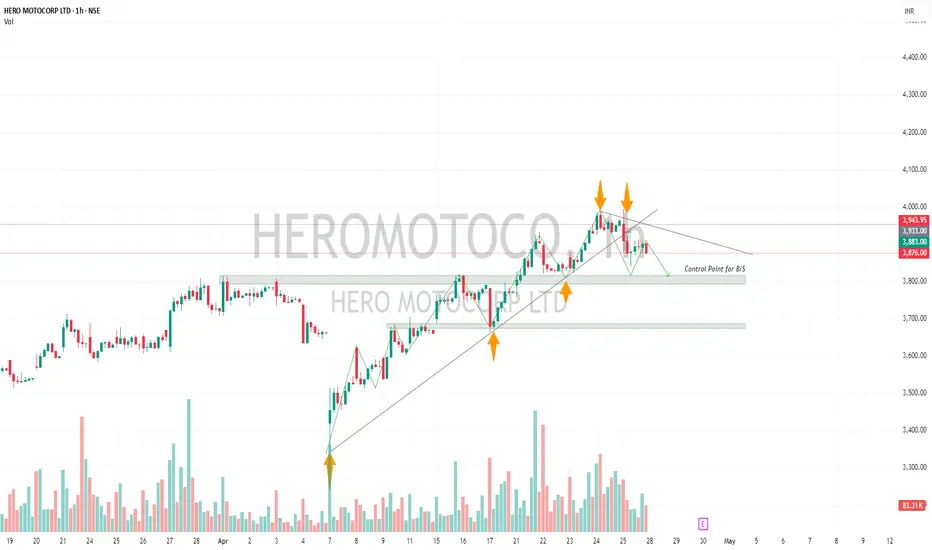
HEROMOTOCO-Positional Short Trade Stock upside taking support from trendline. Friday's session 25'th April The stock has shown weakness potential trend reversal.
There are two possibilities:
1)Head and Shoulder Pattern
2)Descending Tringle Pattern
For both the possibilities it the neckline/Support zone 3800 needs to break. If that happens it may test 3680.
If opens gap up Above 3960 Avoid!
Please don't forget click on follow button so you won't miss any upcoming ideas.
Any confusion, feel free to drop msg. Happy to help :)
This is only for educational purpose, please manage your risk accordingly.
Head_and_shoulder
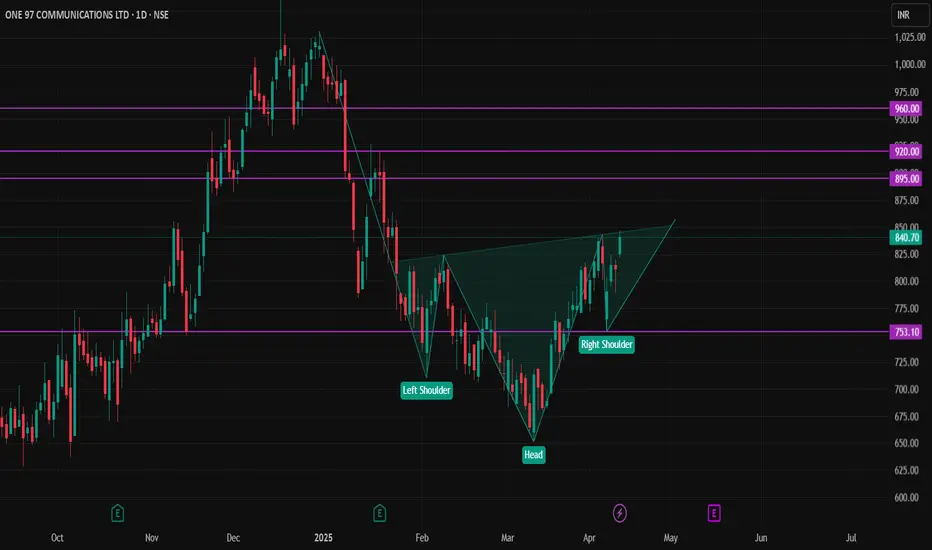
PAYTM STOCKNSE:PAYTM Stock is waiting for breakout the inverted head and shoulders pattern.
buy sustain above 750 rupees,
Target 1 is 885 to 895 rupees,
Target 2 is 915 to 920 rupees,
Target 3 is 950 to 960 rupees,
Stoploss close below 750 rupees atleast 1 day candle.
SBI - Bullish Head and Shoulder patternState Bank of India (SBI) has completed the formation of a bullish inverse head and shoulders pattern on the daily chart — a strong technical indicator of trend reversal from bearish to bullish.
Neckline Breakout:
The pattern has confirmed a clean breakout above the neckline at ₹785, accompanied by rising volume, validating the breakout and signaling that buyers have taken control from sellers.
Support Structure:
Both the left and right shoulders of the pattern have been formed around the strong support zone of ₹725, further strengthening the reliability of this setup.
Candle Confirmation:
The head of the pattern was formed with a Morning Star candlestick pattern, a classic bullish reversal signal, reinforcing the likelihood of an upward move.
Volume Analysis:
During the formation of the head and shoulders pattern, volume was gradually declining, indicating healthy consolidation.
The volume spike at the breakout point adds conviction, showing renewed interest and participation by buyers.
Momentum & Moving Averages:
RSI (Relative Strength Index): RSI is trading above 60, indicating strong bullish momentum without yet entering overbought territory.
EMA Crossover: A bullish crossover has occurred, with the 20-day EMA crossing above the 50-day EMA, a classic trend continuation signal.
The positive slope of both EMAs supports a sustained uptrend.
Price Target & Risk Management:
Target (as per measurement rule): The price target is calculated by measuring the distance from the bottom of the head to the neckline and projecting that from the breakout point.
Estimated Upside Target: ₹880
Stop-Loss (SL) Options: Fixed SL: Below the right shoulder, around ₹730.
Trailing SL: Use the 50-day EMA to dynamically protect gains as the price moves higher.
Conclusion:
SBI is exhibiting a strong bullish setup, with confirmation from price action, volume, and momentum indicators. The inverse head and shoulders pattern breakout, supported by key technical signals like EMA crossover and RSI strength, indicates potential for a trend continuation to the upside. Long positions can be considered with a clear risk-reward structure.

POWERGRID - LONGInverted Head and Shoulders (Bullish Reversal Pattern)
Breakout: Price has broken above the neckline on a bullish candle with good volume, confirming the breakout.
✅ Entry Point
Breakout Entry: ₹300–₹305 zone (close above neckline).
Since price is at ₹304.10 currently, it's still close to the breakout — suitable for entry.
🎯 Targets
Measured move = Height from Head to Neckline, then projected above neckline:
Neckline: ₹300
Head Low: ~₹245
Height = ₹300 - ₹245 = ₹55
🔼 Target 1: ₹300 + ₹55 = ₹355
(Final resistance line on your chart = ₹356.05 — matches perfectly!)
🔼 Optional Intermediate Target: ₹345.20
(As marked in the chart — could be a resistance from earlier highs.)
🛑 Stop Loss (SL)
Set below the right shoulder or neckline, depending on your risk appetite: Safe SL: Below right shoulder ~₹290. Aggressive SL: Below neckline ~₹295
⚖️ Risk-Reward Example
Entry: ₹304
SL: ₹290 (Risk = ₹14)
Target: ₹355 (Reward = ₹51)
Risk:Reward ≈ 1:3.6 ✅

NIFTY Smallcap 250 – Bullish Head & Shoulder PatternKey Highlights: Nifty Smallcap 250 Index
✅ Bullish Head & Shoulder Breakout
✅ Neckline at 15,000 – Critical Psychological Level
✅ Price Trading Above 20 EMA – Short-term Trend Turning Bullish
✅ RSI Gaining Strength – Momentum Supporting Upside Move
Chart Pattern Analysis:
The NIFTY Smallcap 250 has formed a classic bullish inverse Head & Shoulder pattern, signaling a potential trend reversal. Today, the price is breaking above the neckline at 15,000, which is a key psychological resistance level.
A decisive closing above this neckline with a strong bullish candle will further validate the breakout, indicating a potential upside continuation.
Technical Indicators:
📌 20 EMA Crossover: Price is now trading above the 20-day Exponential Moving Average (EMA), confirming a short-term bullish trend shift.
📌 RSI Momentum: The Relative Strength Index (RSI) is heading towards the bullish zone, showing increasing buying strength and momentum. A move above 60 could further fuel the rally.
📌 Volume Confirmation: A surge in trading volume will add strength to this breakout, confirming buyers’ interest in small-cap stocks.

Inverted Head & Shoulders: 3 Must-Know Variations for Traders!Not all Inverted Head & Shoulder patterns work the same way! Here’s a deep dive into 3 powerful variations that can help traders find strong trend reversals and breakouts in swing & momentum trading

TCS bearish or Bullish ??TCS retesting its long trend line. After retesting it may resume upward journey.
But at same time it is making Head and Shoulder pattern. It has beoken it. So in case of bearish h&s scenerio, stock can go to 3400 level.
At 3406 there is gap also.
Tell me weather TCS will retest trendline and will go to 4800 level or it will drop to 3400 level.

Tata Consumer Products LtdBullish HNS pattern formed at support level, looking good to buy.
Chart share here is for educational purpose only and not any buy and sell recommendation.

Bank India | Head & Shoulder Breakout | Swing TradeBank India | Head & Shoulder Breakout | Swing Trade
The provided information is for educational purposes only, not trading advice. There's a risk of being completely wrong.
I am not Sebi registered analyst. My studies are for educational purpose only.
Happy Trading!!
Bigfoot Academy
Disclaimer and Risk Warning.
The analysis and discussion provided on in.tradingview.com is intended for educational purposes only and should not be relied upon for trading decisions. Bigfoot Academy is not an investment adviser and the information provided here should not be taken as professional investment advice. We are not responsible for you profit or losses that you may incur. So Please Consult your financial advisor before trading or investing.

Chart says everything itself: Educational post
Please check all snaps shared here
Educational post
I am not Sebi registered analyst.
My studies are for educational purpose only.
Please Consult your financial advisor before trading or investing.
I am not responsible for any kinds of your profits and your losses.
Most investors treat trading as a hobby because they have a full-time job doing something else.
However, If you treat trading like a business, it will pay you like a business.
If you treat like a hobby, hobbies don't pay, they cost you...!
Hope this post is helpful to community
Thanks
RK💕
Disclaimer and Risk Warning.
The analysis and discussion provided on in.tradingview.com/u/RK_Charts/ is intended for educational purposes only and should not be relied upon for trading decisions. RK_Charts is not an investment adviser and the information provided here should not be taken as professional investment advice. Before buying or selling any investments, securities, or precious metals, it is recommended that you conduct your own due diligence. RK_Charts does not share in your profits and will not take responsibility for any losses you may incur. So Please Consult your financial advisor before trading or investing.

Head & Shoulders Alert: Jain Irrigation Systems (JISLJALEQS)
Entry: Above ₹84.36 🚦(Safe Traders Wait for a close above )
Stop Loss: ₹68.41 (SL: -19%) 🛑
Targets:Target 1: ₹106.52 🎯 (+26.2%)
Target 2: ₹136.84 🚀 (+62.2%)
Risk-Reward Ratio:T1: 1:1.38
T2: 1:3.27
Profit booking is subjective. Book profits as per your appetite.
📈 Technical Highlights:
Pattern: Forming a Head & Shoulders (Positional pick).
Volume: Picking up significantly 📊.
Candle: Closed below major resistance with a wide-range candle.
DMA Levels: Trading above 30DMA & 50DMA, showing strength.
Bounce: Taking strong support at 30 & 50DMA.
RSI: Bullish momentum ⚡.
⚠️ Key Risks:
Trading against the trend. If markets fall, the probability of this trade failing increases 🚨.
Quarterly Results: Around the corner 🗓️, so be cautious of sudden volatility.
💡 Risk Management:
Position Sizing: Essential due to a deep SL.
Proper risk management is key for survival in case the market turns against this trade!
📋 Disclaimer:
This is not investment advice. Always conduct your due diligence and maintain strict risk management when trading. 🚩

Positional Long : Aarti Industries
Aarti Industry has given a good correction of ~64% from its top due to weakness in its energy business, drop in Mono Methyl Aniline (MMA) margins ,and is trading near a important support area i.e 400 level.
Currently its following a descending channel pattern and has formed a double bottom pattern.
Earlier price has formed a Head & Shoulder pattern, & price descended ~25% which was due as per the H&S Pattern.
Given the headwinds looks like a good positional buy with a staggered accumulation approach in major dips.
⚡Note: This is just for analysis purpose, please do your own research before punching any orders.
🔍 For more technical analysis and trade setups, make sure to follow me on trading view.
🔗 Trading View: in.tradingview.com/u/DebasisT/

Kalyan jwellers Head and shoulders aka SHAMPOO patternupside breakout in kalyan jewellers of inverse head and shoulder pattern
trend continuation and strong growth expected with immediate targets upto head width of the pattern.

ANGELONE | LONG TERM | 54% ReturnCMP: 3,292.80
Target: 5030
Return: 54%
Time: 6-12 months
Watchout volume and retest in the breakout area (D/W/M)

BitCoin USDT Spot Chart H&S expectedBTC might form a Head and Shoulder pattern on 30 min TF. Time will tell if this pattern will be completed and broken down. Its too early to tell now. Its just an analysis for educational purpose. Not a buy or sell recommendation.

Silver Form H&S pattern.Silver form H&S pattern with neckline 88222. if sustain below this level it may test 79777 and 75075.

Indusbank | Trendline Breakout ⭕️ Swing Trading opportunity: Price Action Analysis Alert !!!⭕️
💡✍️Technical Reasons to trade or Strategy applied :-
✅Inverted Head & Shoulder Chart Pattern Bull Breakout
✅Breakout confirmed
✅Rise in Volume
✅Good 3 touches Trendline Breakout with volume
✅Clear uptrend with HH & HLs sequence
✅ Order block as potential Supports
✅Check out my TradingView profile to see how we analyze charts and execute trades.
🙋♀️🙋♂️If you have any questions about this stock, feel free to reach out to me.
📍📌Thank you for exploring our idea! We hope you found it valuable.
🙏FLLOW for more !
👍LIKE if useful !
✍️COMMENT Below your view

CHOLAMANDALAM FINANCEAfter the correction waves in the mark down stage of the price action, the accumulation phase is complete with a Head and Shoulder pattern. There is assurance in the base formation by way of a double bottom. The stock may not race fast enough but the trajectory seems to have turned bullish.

Perfect Time for a Long Entry.Natco Pharma has clearly turned it's way now, after a fall of more than 20% from it's ATH, is has shown some good reversal confirmations, first being it has take rejection form Fibonacci 0.5 level as well as From it's Important Support Zone, Second being formation of two Bullish Chart Pattern i.e. Inverted Head & Shoulders and Falling Wedge pattern and it has given breakout of these pattern too. There are higher probabilities of it going towards a New ATH.

Exideind | All Resistance Trendline Breakout ⭕️ Swing Trading opportunity: Price Action Analysis Alert !!!⭕️
💡✍️Technical Reasons to trade or Strategy applied :-
✅Inverted Head & Shoulder Chart Pattern Bull Breakout
✅Breakout confirmed
✅Rise in Volume
✅Good 3 touches Trendline Breakout with volume
✅Clear uptrend with HH & HLs sequence
✅ Order block as potential Target
✅Check out my TradingView profile to see how we analyze charts and execute trades.
🙋♀️🙋♂️If you have any questions about this stock, feel free to reach out to me.
📍📌Thank you for exploring our idea! We hope you found it valuable.
🙏FLLOW for more !
👍LIKE if useful !
✍️COMMENT Below your view !

Guficbio looks good for a swing.
Good for a swing trade. Levels are mentioned in the chart.
This is not a buy/Sell recommendation. Please do your due diligence before attempting a trade.

Nifty forming H&S pattern on weekly chart.Alarming sign on indexNifty forming H&S pattern on weekly. With the neckline 24900 if it closes below this level, it may come up to 24500-24100 in short time.

ETH FORMED HEAD AND SHOLDERS#Ethereum Update
AMEX:ETH is showing clear bearish signals as it reaches overbought levels. Price action indicates a potential Head and Shoulders pattern forming. If it breaks below the current support, the next target is around $2750. Keep an eye on this critical level!
