Union Bank of India: Long-Term Head & Shoulders PatternUnion Bank of India has delivered a decisive long-term breakout on the monthly timeframe after completing a classic Inverse Head & Shoulders pattern, marking a major structural shift in trend. The pattern has been in formation for several years, with a well-defined left shoulder, a deep head near the bottoming zone, and a higher right shoulder, clearly reflecting gradual accumulation after prolonged weakness.
The most important technical development is the clean breakout above the neckline resistance, which had capped price action for multiple years. This neckline breakout is supported by strong bullish candles, indicating conviction from long-term participants rather than short-term speculation. Such breakouts on higher timeframes often signal the beginning of a multi-year uptrend rather than a temporary rally.
From a projection perspective, the measured move derived from the head-to-neckline height suggests a primary upside target near the 240+ zone, followed by an extended target around 280+. If momentum sustains and the broader banking sector remains supportive, the structure also opens the door for a long-term projected target near 325+, aligning with the full pattern height projection shown on the chart.
Risk remains clearly defined in this setup. As long as the price holds above the neckline breakout zone, the bullish structure remains intact. Any sustained move back below this level would weaken the breakout thesis and shift the view back to consolidation. This makes the trade favorable from a risk–reward standpoint, as downside risk is limited relative to the potential upside.
Overall, Union Bank of India is transitioning from a prolonged basing phase into a new bullish cycle. Such high-timeframe pattern breakouts are often accompanied by volatility in the initial phase, but structurally they favor positional and long-term investors, especially when managed with disciplined risk control.
Headandhsoulders

ICICIBANK - Inverted Head & Shoulder suggests 1450ICICI Bank has completed a clean Inverted Head and Shoulders pattern on the 4H chart, signalling a possible trend reversal after the recent downtrend. The left shoulder formed near 1360 , the head at 1317 , and the right shoulder at 1354 . All three points reflect stronger structure and consistent buying interest on dips. The stock has now crossed the neckline around 1387–1390 , a zone where it faced repeated rejection earlier. This breakout shows that buyers have finally taken control.
If the price continues to hold above the neckline, momentum is likely to push it toward the projected target of 1440–1450 , which matches the “final destination” zone shown on your chart. The breakout would lose strength only if the price falls back below 1387 , but unless that happens, the pattern suggests the move still has room to extend higher.

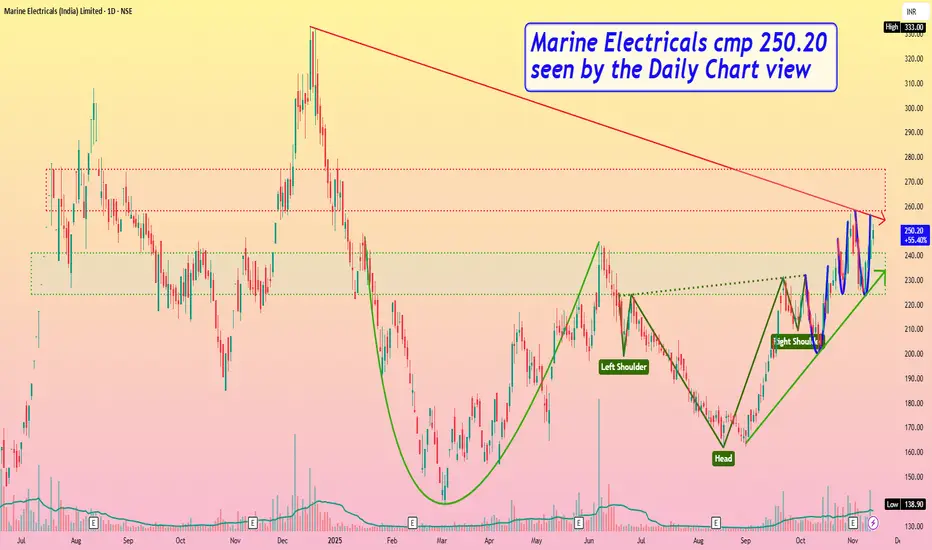
Marine Electricals cmp 250.20 by Daily Chart viewMarine Electricals cmp 250.20 by Daily Chart view
- Support Zone 224 to 241 Price Band
- Resistance Zone 258 to 275 Price Band
- Bullish Chart setup by Rounding Bottoms, pre and post Head & Shoulders
- Volumes seen spiking very heavily and well above the average traded quantity
- Positively trending Technical Indicators BB, EMA, MACD, RSI, SAR, SuperTrend, VWAP
- Breakout attempted above Falling Resistance Trendline and Rising Support Trendline sustained
- Fresh Breakout probable subject to Resistance Zone crossing and closure sustained above it for few days
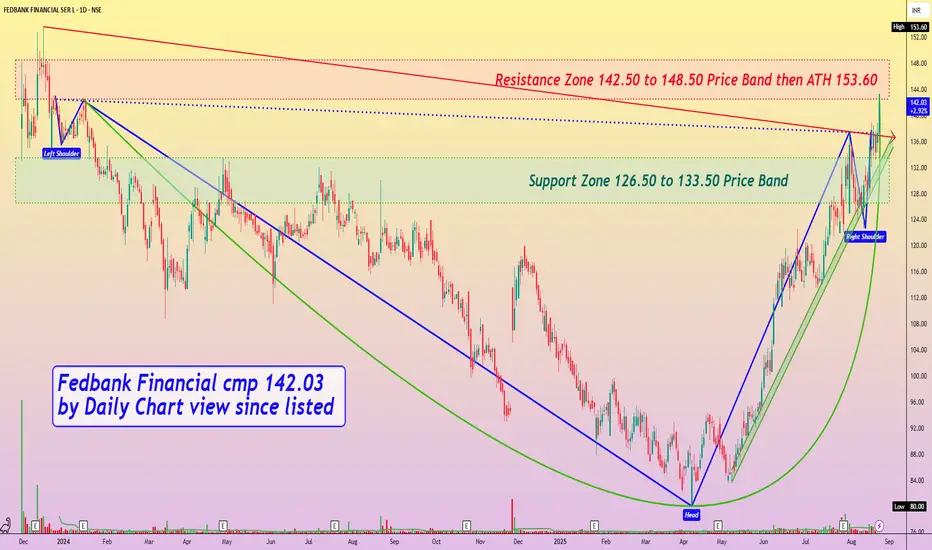
Fedbank Financial cmp 142.03 by Daily Chart view since listedFedbank Financial cmp 142.03 by Daily Chart view since listed
- Support Zone 126.50 to 133.50 Price Band
- Resistance Zone 142.50 to 148.50 Price Band then ATH 153.60
- Volumes seen to be in good close sync with the average traded quantity
- Rising Support Trendline Channel well respected by up-trending price momentum
- Falling Resistance Trendline Breakout seemingly might be retested prior to fresh uptrend
- Price testing retesting Support Zone over the last week for probable breakout beyond ATH 153.60
- Dual Bullish Technical patterns formed of Head & Shoulders and close to 18 month long Rounding Bottom
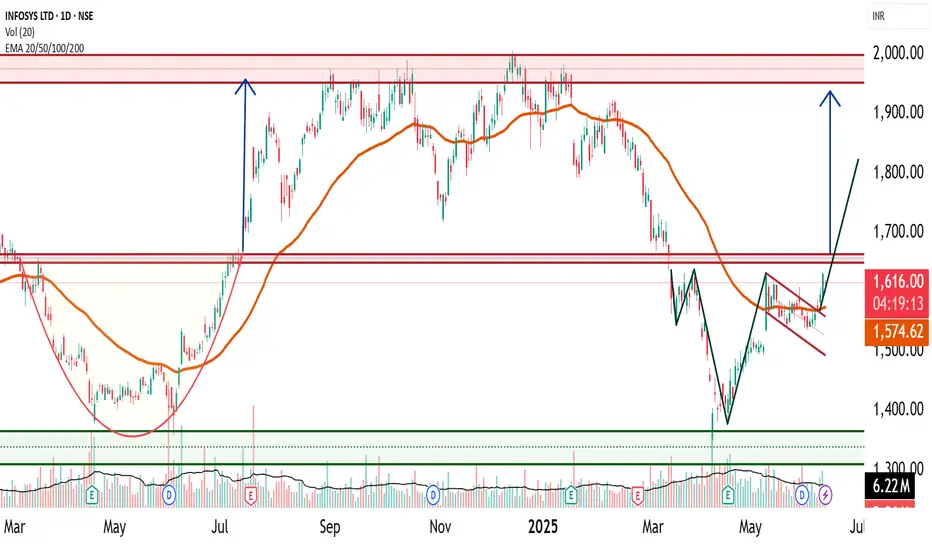
Infosys Technical Research- Flag and Head and shoulders🔍 1. Infosys Current Price Range and Key Levels
Since January 2021, Infosys has been trading in a broad range between ₹1300 and ₹2000, consolidating for over 4 years. Within this range, there are three key support and resistance levels to watch closely:
Support: ₹1300 (major floor)
Intermediate Resistance/Support Zone: ₹1600 – ₹1650
Strong Resistance: ₹2000 (upper bound)
📈 2. Bullish Flag Pattern: A Bullish Flag is a continuation pattern that forms after a strong upward price move "flagpole" , followed by a period of consolidation in a narrow downward or sideways channel "flag". It typically signals a pause before the uptrend resumes.
📊 2. Infosys Recent Technical Development
Infosys recently broke out of a bullish flag pattern and crossed above ₹1580 with a strong closing on higher volume, indicating renewed buying interest.
Price is currently trading above the 50-day Exponential Moving Average (EMA), confirming the continuation of the mid-term uptrend.
However, the zone around ₹1650 remains a strong and key resistance level to monitor closely.
🧩 3. Potential Bullish Head and Shoulders Pattern Above ₹1650
Should Infosys break decisively above ₹1650, it is likely to form another significant bullish pattern known as the Bullish Head and Shoulders (Inverse Head and Shoulders).
Bullish Head and Shoulders
This pattern signals a trend reversal from bearish to bullish and is considered highly reliable.
Trend: Appears after a downtrend or consolidation, signaling reversal
Touchpoints: Three lows – left shoulder, head (lowest point), and right shoulder, roughly at similar levels
Neckline: The resistance line connecting the highs between shoulders and head
Timeframe: Medium-term, often forming over weeks up to 6 months
Volume: Typically higher volume on left shoulder and head formation, volume dips on right shoulder, and surges on breakout
⚠️ 4. Key Concerns in Infosys Chart Pattern
Price-Volume Divergence: During the head formation, volume increased sharply as price fell — indicating strong selling pressure. However, volume was low when price approached the neckline — suggesting weak buying interest to confirm breakout. This divergence signals potential caution.
Resistance Zone: Price remains below the key resistance at ₹1650, which has acted as a ceiling multiple times. A decisive breakout is required to sustain further upside momentum.
⚠️ Disclaimer
This report is intended solely for educational and training purposes and does not constitute investment advice. Traders and investors should conduct their own research and consult financial advisors before making trading decisions.
QUESS Weekly Head and Shoulder's patternHi, Quess Corp has perfectly completed Head and Shoulder's pattern on weekly chart and has been consolidating after breaking out. This is trend reversal pattern and the target as per pattern comes to 1105 and before that it has resistance at 993 and support is 697. Please do like and comment. Thanks in advance.

BTC Forms Head and Shoulders Pattern Key Levels to WatchBitcoin has formed a head and shoulders pattern, signaling a potential trend reversal. To confirm this pattern, CRYPTOCAP:BTC needs to reclaim the $61,600 level. If successful, the target moves to $66,800, with the potential to reclaim liquidity around the $68,500 to $70,000 area. This setup indicates a possible bullish momentum for Bitcoin in the near term

Mahindra & Mahindra - Bullish Head and Shoulder Chart PatternMahindra & Mahindra has formed a bullish head and shoulder pattern along with rounding pattern, but the concern is that bullish pattern should formed in downside or downtrend.
But here pattern formed in uptrend.
Point to be noted that head is formed with morning star candlestick pattern.
Entry on closing basis above 2000
SL below 1890
Target 2200
RRR 1:2
Confidence Level is moderate but not high

PFIZERparallel channel started from Mar'99 and making top in Sept 21
now head and shoulder formation is complete
now a dead cat bounce and followed by bears

HEAD AND SHOULDER PATTERN BREAOUT IN NMDCStock gave Breakout of Head and Shoulders Price action pattern and retested the breakout zone and also break the previous high and showing some bullishness.
Entry - 168 to 169
Target 1 - 179
Target 2 - 197
This is not a buy or sell call, analysis is shared for educational purpose.

NMDC: 10 Year Inverted head and ShoulderNMDC is poised to breakout of a massive 10 year inverted head and shoulder pattern. High volumes and high RSI.

NMDC DOUBLE BOTTOM NMDC has been falling since more than a year and has now shown signs of bullish nature as the entire market sentiment improves.
NMDC has formed a beautiful double bottom which has been confirmed by the gap up today with good volume. The previous red candles has high volume but no price movement which is a good sign and shows lack of selling pressure.
NMDC weekly chart is also forming a inverted head and shoulders pattern
As the market breaks all time highs and seeks new levels, some stock have not contributed to the previous rally such as reliance and Infosys but these stocks went at very good levels currently. A stock like NMDC is showing a good double bottom and a beautiful risk to reward.
Target: Short term as of chart
Stop loss: Below recent low and support zone
Keep It Simple


Head & Shoulders in ICICIBANKICICIBANK stock is forming head and shoulders pattern on the 15 minutes time frame. This is coming after a broadening formation which is also a bearish pattern.
That's two bearish patterns back to back. Bearish trade can be initiated upon breakdown of the H&S trendline. Measured move target: 850.

TESLA Short, Head & Shoulder TOP!$TSLA aka Elon Musk's Tesla
CMP= $204.99
Attached: Weekly Price Chart as of 14th October, 2022
- Price has triggered a Head & Shoulder TOP Pattern Breakdown
- Tesla still has a PE of 74 which is Overvalued and Expensive compared to Peers and Unsustainable in a FED Tightening Environment
Elliot Wave Counts say that a Larger Degree 5 Wave Impulse in Wave 1 has completed from its 2019 Low and Now Price is in Larger Wave 2 down. The normal target for Wave 2 is considered as the 4th wave of lower degree. And in this case it comes to around $130 to $110 as the Target requirement
So Price can Half from here literally.
SUPER BEARISH, Perfect Short🐻🩸
Downside Targets🎯 are open to in order:
T1= 180
T2= 135
T3= 110
Ultimately Tesla may find Support at the $100 round figure mark but will it be the final bottom or just another bear market rally from there will be seen that time

Bullish breakout in NSE PSUBANK Index on weekly chartNSE's PSUBANK index (ticker: CNXPSUBANK) was trading in a long head and shoulders consolidation for two years from mid 2019 to mid 2021. The breakout from inverted H&S happened in Oct'21 after which the index began to consolidate in a bull flag type of formation till Aug'22.
The index broke out from this consolidation in Aug, gave a retracement back to the consolidation zone and has now finally broken out of this zone. We are bullish on the NSE PSUBANK index in the coming months with immediate target of 3400 followed by 4000-4200 as a major resistance zone as shown in the chart. Stop loss below Sep'22 low of 2856.

Bajaj Finance SHORT Trade, Head & Shoulders TOP!Attached: Hourly Chart
A Clear Cut Distribution Pattern is visible for Bajaj Finance. This Pattern is called the Head & Shoulders Top Pattern and is a Trend Reversal Pattern.
In this case, there is a BEARISH Implication
One can Short at CMP
Stop Loss above 7380
Downside Target open to 6900- 6800
Stay Safe
And Happy Trading!
If you like my work, then check out my profile and the other trade ideas that I have shared recently.
Any kind of support is appreciated :)


Sell on rise Oberoirlty
T- 650
SL : 840
Reason : Technically it has made Head and Shoulder structure on daily chart and fundamentally due to inflation and rate hike Realty sector expected to slowdown in near term.


How to take Head n Shoulder Pattern Trade
This is a Way to take trade with Head and Shoulder. Once completed pattern wait to retraced the market after that take trade as per candlestick pattern. Stop loss as per Candlestick pattern.
Feel free to share your feedback and queries.
If you want to know about your stock please mention in comment.
Note: This is not Paid only for Educational purpose.

Head and Shoulders - "Learn More Earn More" with usHead and Shoulders Definition:
A head and shoulders pattern is also a trend reversal formation.
It is formed by a peak (left shoulder), followed by a higher peak (head), and then another lower pea k (right shoulder).
A “Neckline” is drawn by connecting the lowest points of the two troughs. Neckline support does not need to be strictly horizontal.
. This illustrates that the upward trend is coming to an end.
. When a Head and Shoulders formation is seen in an uptrend , it signifies a major reversal .
. The pattern is confirmed once the price breaches the neckline support
In this example, we can easily see the head and shoulders pattern.
How to Trade the Head and Shoulders Pattern:
ENTRY:
we put an entry order below the neckline.
TARGET:
We can also calculate a target by measuring the high point of the head to the neckline.
This distance is approximately how far the price will move after it breaks the neckline.
