TMPV - Elliott Wave Structure Behind a Head & ShouldersUsing Elliott Wave principles , the advance in Tata Motors Passenger Vehicles can be interpreted as a completed 5-wave impulsive move , after which price has transitioned into a corrective and distributive phase . The emergence of a Head & Shoulder formation aligns well with this wave count, reinforcing the shift in structure . With price holding below the right-shoulder resistance , the neckline remains vulnerable , keeping the broader bias corrective unless a major resistance is decisively reclaimed .
Disclaimer:
This analysis is for educational purposes only and does not constitute investment advice. Please do your own research (DYOR) before making any trading decisions.
Head and Shoulders

Structural breakdown after a long uptrendBanknifty makes a Head & Shoulder pattern and confirms a clear breakdown below.
Expecting more selling to follow in coming months.
First target 57700.
Long term target is close to 54150. (Few months)

Gold May RejectGold may Reject from 4610-4620. SL will be 4630 Level. Target will be 4475 zone. As shown in the chart.

Container Corporation of India Ltd – Head & Shoulders in PlayOn the monthly chart, CONCOR is showing a Head & Shoulders formation. The neckline around ₹480–500 is the key level to watch.
A breakdown below the neckline could confirm bearish continuation.
A successful hold above it may simply lead to sideways consolidation instead of a full breakdown.
The neckline is the make-or-break zone for the stock in the coming months.
Disclaimer: This analysis is for educational purposes only and does not constitute investment advice. Please do your own research (DYOR) before making any trading decisions.

Union Bank of India: Long-Term Head & Shoulders PatternUnion Bank of India has delivered a decisive long-term breakout on the monthly timeframe after completing a classic Inverse Head & Shoulders pattern, marking a major structural shift in trend. The pattern has been in formation for several years, with a well-defined left shoulder, a deep head near the bottoming zone, and a higher right shoulder, clearly reflecting gradual accumulation after prolonged weakness.
The most important technical development is the clean breakout above the neckline resistance, which had capped price action for multiple years. This neckline breakout is supported by strong bullish candles, indicating conviction from long-term participants rather than short-term speculation. Such breakouts on higher timeframes often signal the beginning of a multi-year uptrend rather than a temporary rally.
From a projection perspective, the measured move derived from the head-to-neckline height suggests a primary upside target near the 240+ zone, followed by an extended target around 280+. If momentum sustains and the broader banking sector remains supportive, the structure also opens the door for a long-term projected target near 325+, aligning with the full pattern height projection shown on the chart.
Risk remains clearly defined in this setup. As long as the price holds above the neckline breakout zone, the bullish structure remains intact. Any sustained move back below this level would weaken the breakout thesis and shift the view back to consolidation. This makes the trade favorable from a risk–reward standpoint, as downside risk is limited relative to the potential upside.
Overall, Union Bank of India is transitioning from a prolonged basing phase into a new bullish cycle. Such high-timeframe pattern breakouts are often accompanied by volatility in the initial phase, but structurally they favor positional and long-term investors, especially when managed with disciplined risk control.

CAMS - Descending triangle + Head and Shoulders PatternA clear Head and Shoulders structure has formed over the recent months. The price has just breached the neckline support (horizontal dotted teal line) around the ₹720–₹730 zone.
The recent price action shows a breakdown below the neckline with a red candle, suggesting that the bearish momentum is gaining traction.
Also stock is trading below 200 EMA, which is a strong downward movement signal.
Traders should watch for a potential "retest" of the neckline before the continuation of the downward move.
Target: 630/-

USDCAD ON 2H Time frame Head and shoulder pattern.As you can see market is forming head and shoulder pattern if market breaks the neckline we can sell with LTF

TITAN Inverted Head & Shoulders | Bullish Breakout SetupTITAN has formed a well-structured Inverted Head & Shoulders pattern, signaling a potential bullish trend reversal.
🔹 Breakout confirmed above the neckline
🔹 Neckline tested again after breakout and successfully held as support
🔹 Retests indicate strong buyer presence and acceptance above resistance
🔹 Structure supports continuation towards higher levels
📌 Trade Setup:
Buy Above: immediately
Target (Profit): 🎯 4109
Stop Loss: ❌ 4020
📊 Bias: Bullish as long as price sustains above the neckline.
⚠️ Invalidation:
A decisive close below the neckline and SL level would weaken the bullish setup.
Not financial advice. Trade with proper risk management.

Yes Bank : Ready to reward you ~30% in a YearHi Friends,
Yes Bank looks promising now & ready for ~29% (Target ~30) upward journey.
I am anticipating the stock to start its upward journey.
Pattern : Beautiful inverse Head and shoulder is getting formed .
Entry point : Entry point is above YELLOW line.
Stoploss : Stoploss will be 10% below the YELLOW line
Timeline : ~01 Year
Targets, Stoploss & Entry are mentioned in the chart .
Please feel free to share your views regarding this chart & analysis .
Note : I am not a SEBI registered advisor . Please consider my analysis only for Education purpose .

Auropharma at crucial levelAs per the daily chart, the price is forming an inverted head and shoulder pattern. The price should sustain the zone 1250 - 1260 to move up. Today's movement shows, the bulls have the strength to give a movement.
If the price opens above 1230 and shows bullish strength, buy above 1236 with the stop loss of 1224 for the targets 1246, 1258, 1272 and 1286.
If the price has a pullback towards the 1200 zone and shows bullish strength, buy above 1206 with the stop loss of 1196 for the targets 1218, 1232, 1246, 1258, 1272 and 1286.
Always do your analysis before taking any trade.

Kalyan Jewellers – Elliott Wave analysis for breakout.Kalyan Jewellers – Elliott Wave Validation (Daily Chart, IST)
Big Picture Structure
• Primary trend: Bullish
• Current degree: Wave (5) in progress
• Wave (4): Completed near ₹440–445
• Market is now transitioning from early Wave (5) into impulsive expansion
________________________________________
Role of the Inverted Head & Shoulders (IH&S)
• IH&S has formed after Wave (4) → classic trend-resumption pattern
• This pattern is acting as:
o A reversal from correction
o A launchpad for Wave (5)
Key Pattern Levels
• Head: ~₹440–445 (Wave 4 low)
• Left Shoulder: ~₹495–505
• Right Shoulder: ~₹485–495
• Neckline: ~₹520–525
________________________________________
Breakout Condition (Critical Point)
If today’s candle closes 515 , it confirms breakout
More precisely:
• Daily close above ₹515 with volume
= Confirmed IH&S breakout
= Start of impulse inside Wave (5)
Projected Targets – Elliott-Compliant
Targets are valid Fibonacci expansions from Wave (4) low.
Reference Points
• Wave (4) low: ~₹445
• Breakout zone: ~₹525
🎯 Targets Explained
Target Basis
₹610 0.618 extension of Wave (5)
₹699 Equality with prior Wave (1) / mid expansion
₹799 1.618 extension → typical Wave (5) extreme
✔ All three targets are Elliott-legal and realistic
✔ ₹799 also aligns with previous Wave (3) high, which is common in Wave (5)

Bank of Maharashtra trade for 18-20% upside.**Bank of Maharashtra (Weekly Chart – NSE)**
The stock has **completed its Wave-4 corrective phase** and subsequently formed a **clear Inverse Head & Shoulders (iH&S) pattern**, signalling the start of a **fresh impulsive move (Wave-5)**.
**Technical Observations**
* Wave-4 correction has ended near ₹45–46, respecting Elliott Wave rules
* iH&S neckline breakout confirms trend reversal
* Momentum indicators (RSI & MACD) support bullish continuation
* Price is holding above the breakout zone with healthy structure
**Strategy**
* **Accumulation Zone:** ₹60 – ₹65
* **Upside Target:** ₹75 – ₹80
* **Potential Upside:** ~18–20% from current levels
As long as the price sustains above the accumulation range, the structure remains constructive for further upside in the ongoing **Wave-5**.
This setup favours **accumulate-on-dips** rather than chasing extended candles.
---

Equitas SFB (D): Strong Bullish Reversal (Turnaround Story)Timeframe: Daily | Scale: Linear
The stock has confirmed a major structural reversal, breaking out of a 4-month base (Inverted Head & Shoulders).
📈 1. The Chart Structure (Inverted H&S)
> The Pattern:
- Left Shoulder: Lows of ₹59.50 (May 2025).
- Head: The panic low of ₹50 (Sep 2025).
- Right Shoulder: The recent higher low at ₹57 (Dec 2025).
> The Neckline Breakout: The resistance at ₹64–₹65 was the "Line in the Sand." Today's close at ₹66.68 confirms the trend change.
- Significance: An Inverted H&S breakout after a 50% correction is a high-reliability "Trend Reversal" signal.
📊 2. Volume & Indicators
> Volume Spike: The 9.67 Million volume is an "Institutional Stamp." It confirms that big funds are accumulating at these valuations (Trading at ~1.3x Book Value).
> RSI: Rising in Daily & Weekly timeframes. The Daily RSI crossing 60 decisively indicates that momentum has shifted from "Bearish" to "Bullish."
🎯 3. Future Scenarios & Key Levels
The stock has entered a "Recovery Phase."
> 🐂 Bullish Targets (The Measurement):
- Target 1: ₹76.
- Target 2: ₹85.
> 🛡️ Support (The "Must Hold"):
- Immediate Support: ₹64 – ₹65 . The breakout zone must now act as a floor (Polarity Principle).
- Stop Loss: A close below ₹60 (Right Shoulder) would invalidate the pattern.
Conclusion
This is a Grade A Reversal Setup .
> Refinement: The combination of Fundamental Growth + Technical Reversal makes this highly convicting.

Inverse Head and Shoulder on AluminiumAluminium has given breakout above the neckline of inverse head and shoulder, suggesting prices should go up.

KOTAK BANK:Likely Huge Inverted Head &Shoulder BreakoutKOTAK BANK :Trading at around 2220
Trading above all its critical Moving Averages viz 10/20/50/100/200 DEMA
Formed Inverted H&S Pattern i weekly chart
As per the pattern equivalent to the depth of the Head &Shoulders if holds anove 2220-40 expect a 50-75 point move towards 2250/2275/2300(For educational purpose only)

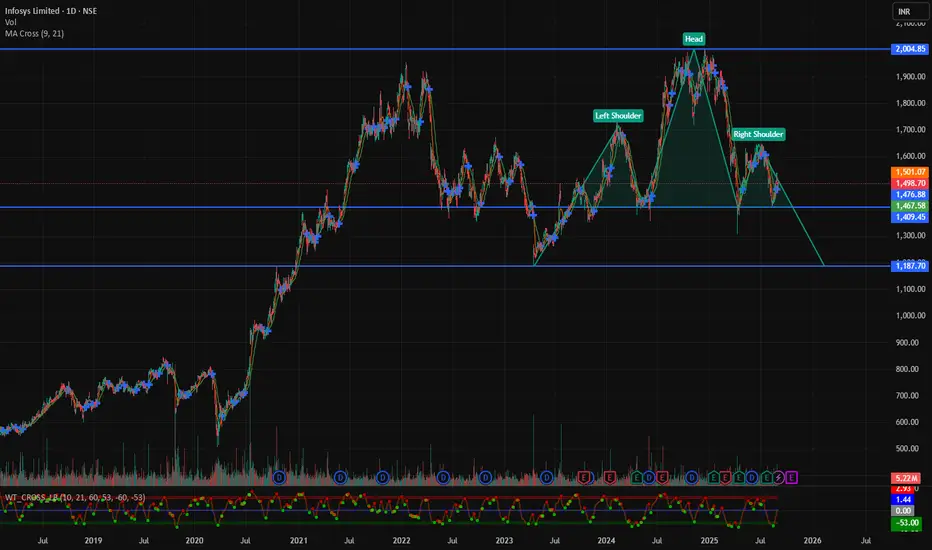
INFY showing head and shoulders pattern.
INFY might fall down to 1100 in spite of being fundamentally undervalued.
The stock might get carried away by weak nifty.
Crash of 25% possible.
Bajaj FinServ : Head and Shoulder Formationprices going below 2000 will make to fall for 1820 level
prices going above 2120 will take towards 2300 level (Head and shoulder failure scenario)

Nifty 50 Price Structure Analysis [18/12/2025: Thursday]Top-Down Nifty 50 Price Structure Analysis for 18th of December 2025. The day is Thursday.
(1) Monthly Time Frame:
Red marubozu plus piercing candle feature is observed. No bullish trade till the price starts to trade above 26000. Major support 25700. The view is indecision as trend (bullish or bearish) clarity is missing.
(2) Weekly Time Frame:
The trend for the past 3 weeks is down. But there is no clear trend. The market structure is broken. It is a confusing market. A major resistance zone is created by 3 levels: 26000, 25950, and 25900. Any up move should be doubted. Minor support is 25800. Major support is 25700. The view is indecision to bearish.
(3) Daily Time Frame:
Very confusing market. Market structure is formed in a lower lows and lower highs structure. There is bearish sentiment in the market. But very tough to build and trade on a directional view. Take no bullish trade unless the price starts to trade above the level 26000. Major support is 25700. The view is indecision to bearish.
(4) 30-Minute Time Frame:
The pennant pattern is still intact. It is the sign of major range-bound consolidation. Price staying inside the pennant means it's a no-trading scenario. We have to wait for either side to break down or break out. Since, head and shoulder (H&S) hypothesis is still intact, there is a higher probability of breakdown from the penant. However, there is an unfilled gap at level 26000. Price might go up to fill the gap and trap bulls. Any up move should be doubted. If level 25750 is decisively broken, then bearishness will deepen. The view is bearish.
Bullish Scenario Set-Up:
(i) Price sustains above the opening price.
(ii) Price breaks out of the pennant.
(iii) Price breaks all the resistances - 25900, 25950, 26000, and fills the pending gap.
(iv) Price develops a higher highs and lower lows structure above level 26000 for at least 1 day.
(v) There is a lower probability of a bullish scenario.
Bearish Scenario Set-Up:
(i) Price sustains below the opening price.
(ii) Price breaks down the pennant.
(iii) Price sustains below the level 25750 with a promise of breaking through the level 25700.
(iv) There is a higher probability of a bearish scenario.
No Trading Zone (NTZ): (26000 - 25750)
Events: SENSEX weekly expiry. No other high-impact event.
Summary of the Trading Plan (Hypothesis and Insights):
(i) Market sentiment is bearish until the price starts to trade above the level 26000. Every up move should be doubted. For a bullish trade, the price must form a strong bullish candle for at least 1 day above the level 26000.
(ii) Price staying with the pennant is a sign of major range-bound consolidation. Wait for either a breakout or a breakdown.
(iii) For a bearish trade, the price must break down the pennant. Next price must decisively trade below level 25750 with a promise of breaking down level 25700.
(iv) Bearish conviction is high as the head and shoulder (H&S) hypothesis is still active. Also, a downward move is the path of least resistance.
(v) No Trading Zone (NTZ): (26000 - 25750).
(vi) Trade only if either a bullish or bearish set-up is activated. If not, then don't trade. Remember, not trading is an extension of trading activity. Protect your resource.
NOTE:
"Mark your points. Trade your points. Price is God. Anything can happen in the markets. Therefore, trade what you see, not what you believe."
Happy Trading!

Nifty 50 Price Structure Analysis [17/12/2025: Wednesday]Top-Down Nifty 50 Price Structure Analysis for 17th of December 2025. The day is Wednesday.
(1) Monthly Time Frame:
Red piercing candle. Sign of weakness. There is also a sign of trend reversal. Every up move should be doubted. Major resistance is 26000. Minor support is 25800. Major support is 25700. The view is indecision to bearish.
(2) Weekly Time Frame:
It's a 3rd week red candle/ Body is red, plus there is sharp selling pressure from 26100 and 26000. Lower lows and lower highs structure is intact. Every up move should be doubted. Take no bullish trade till price sustains above level 26000 at least for 1 day. Sell on every rise is the demand of the present price structure. Very strong resistance is at 26000. Minor support is at 25800. Major support is at 25700. The view is bearish.
(3) Daily Time Frame:
From 1st December 2025, a lower lows and lower highs structure continues. Level 25900, a major support, is broken today. No,w 25900 will also act as a major resistance. No bullish trade till the price starts to trade above the level 26000. The present scenario demands to sell on every rise. Minor support is at level 25800, and major support is at level 25700. The view is bearish.
(4) 30-Minute Time Frame:
The complex correction continues. There is no steady trend. The market is broken. A complex head and shoulder (H&S) pattern is formed. Today, the market broke level 25900 (the neckline of the H&S) again. The Bulls lost hope. Thus, the H&S hypothesis is again activated. Major resistance is at 26000. Every up move should be doubted. Minor support is 25800. Major support is at level 25700. The view is bearish.
Bullish Scenario Set-Up:
(i) Price sustains above the opening price.
(ii) Price forms a higher highs and lower lows structure above the level 26000.
(iii) There is a lower probability of a bullish scenario.
Beairsh Scenario Set-Up:
(i) Price sustains below the opening price.
(ii) Price remains below the level 25900.
(iii) There is a higher probability of a bearish scenario.
No Trading Zone (NTZ): (26000 - 25850).
Events: No expiry on Wednesday. No high-impact event.
Summary of the Trading Plan (Hypothesis and Insights):
(i) The complex correction is on with the indication of bearish bias.
(ii) After breaking down 25900, the H&S hypothesis is again activated. It means the market is moving towards more bearishness.
(iii) Every up move should be doubted.
(iv) Major resistance zone (26000 - 25950). Take no bullish trade unless the price sustains above this zone.
(v) Look for bearish trades only.
(vi) Minor support is at 25800. Major support is at level 25700. There is a higher probability of the price reaching level 25700.
(vii) Trade only if there is either a bullish/bearish scenario. Else, don't trade. Remember, not trading is an extension of trading activity. Protect your resources.
NOTE:
"Mark your points. Trade your points. Price is God. Anything can happen in the markets. Therefore, trade what you see, not what you believe."
Happy Trading!

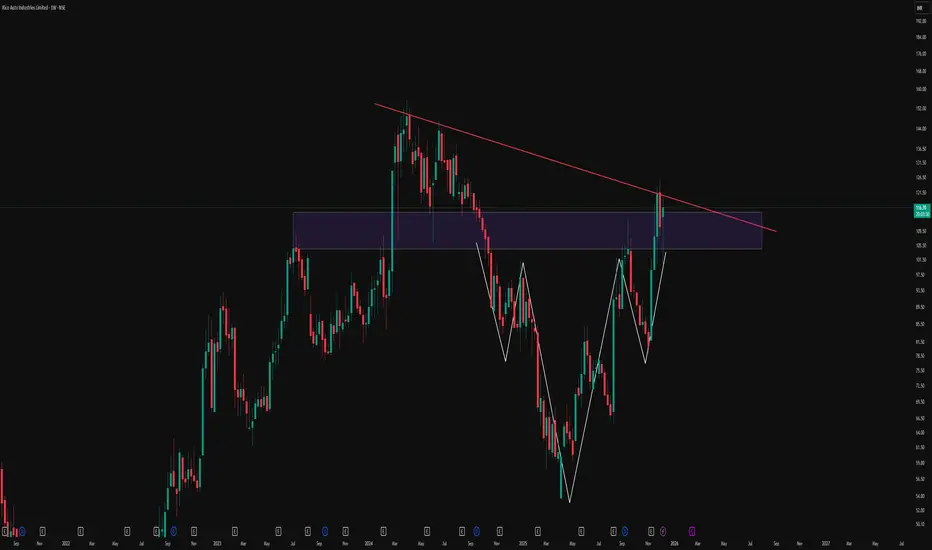
Reclaiming The Breakdown: Descending Triangle To Inverse HnSThis weekly chart of Rico Auto illustrates how structure can evolve over time and why rigid bias around a single pattern can be misleading. Price initially respected a clear descending trendline, forming a classic descending triangle and eventually breaking down below the support zone. Instead of continuing in a straight-line downtrend, the market absorbed that move and began to build a broader basing structure.
Over the following swings, price developed an inverted head and shoulders formation, highlighted here with the white structure, right inside and just below the prior breakdown area. As the pattern matured, price not only reclaimed the prior horizontal zone but also pushed back toward the original red counter-trendline that once acted as dynamic resistance. The same trendline that confirmed the initial triangle breakdown is now being revisited, showing how former breakdown structures can later turn into key decision zones rather than one-way signals.
This chart is shared purely to study how multiple patterns can co-exist and morph on higher timeframes:
-A descending triangle that initially breaks to the downside
-A subsequent inverse head and shoulders basing pattern
-A later reclaim of the old breakdown area and retest of the descending trendline
Disclaimer
This post is for educational and illustrative purposes only and is not investment, trading, or financial advice. Please do your own research and consult a registered financial professional before making any trading or investment decisions.
Inverse head and shoulder formed in reddington1. Inverse head and shoulder formation on Support levels showing buyers will take control from here
2. With minimum downside one can watch for long upside movement shown as target zone on charts
3. The strong movement has shown after result which tells us if movement continues then target may come soon
4. SL is strict as if move fails then not giving chance to get trapped

Nifty - Head and ShouldersNifty formed a Head&Shoulder patter with a 26320 and low of 25750.
A break and decisive close below 25750 should see a sign of more selling to come.

Nifty 50 Price Structure Analysis [10/12/2025: Wednesday]Top-Down Nifty 50 Price Structure Analysis for 10th of December 2025. The day is Wednesday.
(1) Monthly Time Frame:
Red piercing candle. Sign of indecision and trend exhaustion. Major resistance is at level 26000. Major support is at level 25700. The view is indecision to bearish.
(2) Weekly Time Frame:
Red marubozu with weak lower wick. The previous week's candle is also a red hanging man. Today's price gave a breakdown below 3 weeks of consolidation. Signs of trend reversal and previous trend exhaustion. The zone of 25950 - 25900 is a major resistance. The zone of 25750 - 25700 is a major support. The view is bearish.
(3) Daily Time Frame:
Today's candle is kind of a red spinning top or long-legged doji with a small body. The candle shows a breakdown below the level 25900. The day is highly indecisive with a bearish bias. The zone of 25950 - 25900 is a major resistance. The zone of 25750 - 25700 is a major support. The view is bearish.
(4) 30-Minute Time Frame:
Price showed the neck breakdown of the classical head & shoulder (H&S) pattern. The zone 25950 - 25900 is a major resistance. The zone of 25750 - 25700 is a major support. The gap in the zone of 25750 - 25700 still remains unfilled. Today's price broke level 25900 and again got rejected from the same level. Additionally, price strategically expired below the level 25900 but above the level 25800. The price structure of lower highs and lower lows is intact. Thus, the institutional bias is negative. Every up move should be doubted. The view is bearish.
Events:
No expiries on Wednesday. However, the FED interest rate decision is on 11 December (the day after). Expecting high volatility.
Bullish Scenario Set-Up:
(i) Price sustains above the opening price.
(ii) Price starts to build a higher highs and lower lows price structure above the level 26000 (which is a distant level).
(iii) Every up move till the upper breach of level 26000 should be doubted.
Bearish Scenario Set-Up:
(i) Price sustains below the opening price.
(ii) Price starts to trade below the level 25800.
(iii) If the price sustains below the level 25800, there is a higher chance of the price breaking down the level 25700.
No Trading Zone (NTZ): 25900 - 25800.
Hypothesis and Insights from the Trading Plan:
(i) Take bearish trades only as institutional bias is bearish.
(ii) Any up move should be doubted. Bulls are weak.
(iii) The only indication of bullish trades will initiate when the price starts to trade above the level 26000 (which is a distant level). The chances are very low.
(iv) Strong resistance zone is (25950 - 25900).
(v) Minor support zone is (25750 - 25700).
(vi) The neckline of the H&S pattern is broken, confirming the initiation of the bearish phase of at least 400 points (considering the previous range of consolidation).
(vii) If level 25700 is broken, then a free fall is inevitable.
(viii) No Trading Zone (NTZ): (25900 - 25800).
(ix) Trade only when either bullish or bearish conditions are fulfilled. Otherwise, don't trade. Protect your resources.
NOTE:
"Mark your points. Trade your points. Price is God. Anything can happen. Therefore, trade what you see, not what you believe."
Happy Trading!
