IRB trendline breakout on support level1. trendline breakout on support level
2. Inverse head and shoulder pattern on support level
3. good for swing upside movement
Head and Shoulders

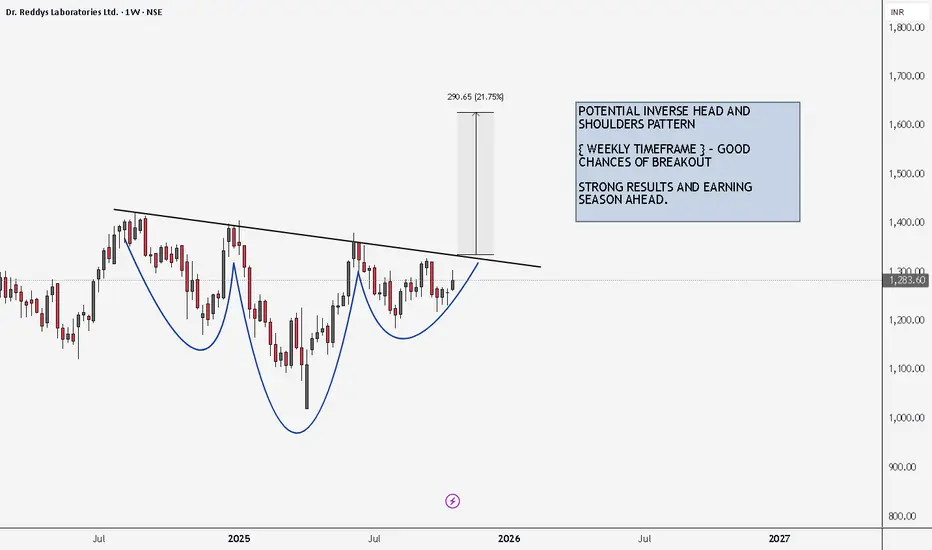
DRREDDY BREAKOUT CHART PATTERNPOTENTIAL INVERSE HEAD AND SHOULDERS PATTERN IN MAKING
{ WEEKLY TIMEFRAME } - GOOD CHANCES OF BREAKOUT
STRONG RESULTS AND EARNING SEASON AHEAD.
HOW TO TAKE POSITIONS IN THIS -
ENTRY LEVELS - 1 DAY CANDLE CLOSIGN ABOVE 1350
STOP LOSS LEVELS - AROUND 1150
TARGET 1 - 1500
TARGET 2 - 1650
TARGET 3 - 1750
Follow Levels Strictly and take positions at your own risk.
This is not an advice to buy or sell.
HAPPY TRADING
#MEDIUM TERM SWING TRADE
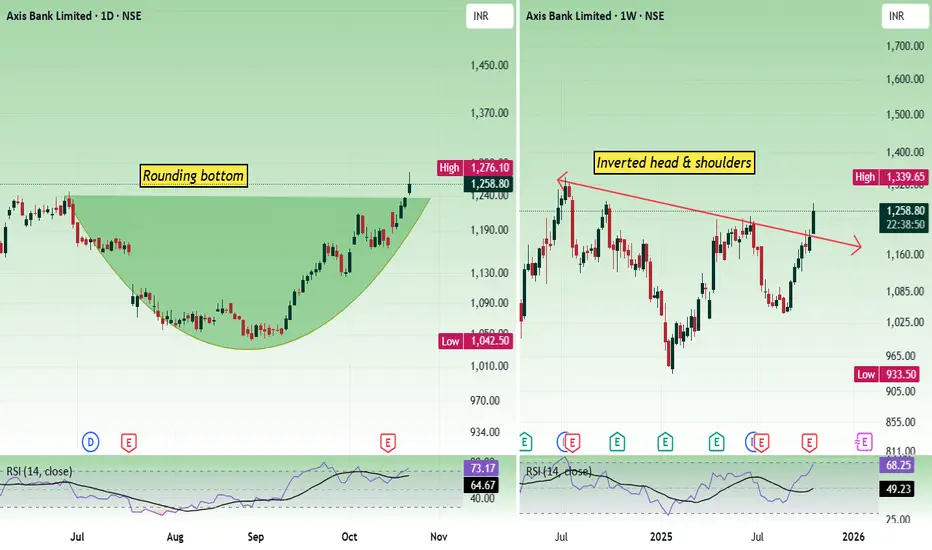
Axis bank - Multi time frame analysisIn the daily time frame, the price has formed a rounding bottom pattern. In the weekly time frame, the price has formed an inverted head and shoulders pattern. Both are bullish patterns.
As long as the price is sustained above 1200, bulls have the chance to move the price up.
Price can bounce from the level 1230 - 1245.
If price shows bearish strength from the current levels and falls down, buy above 1240 with the stop loss of 1222 for the targets 1258, 1276, 1294 and 1312.
If the price opens flat and shows bullish strength, buy above 1260 with the stop loss of 1244 for the targets 1274, 1288, 1304 and 1318.
Always do your analysis before taking any trade.
#MuhuratPick | #Kalamandir: Inverse Head & Shoulders in Play✨ #MuhuratPick 🪔
Celebrate this Diwali with a stock that could bring you festive returns!
CMP: 175
🔽 Supports: 163 - 164 / 152
🔼 Resistances: 193 - 202 / 241
❌ Invalidation Level: 149.50 (Weekly Close Below)
✴️ Breakout Point: Weekly close above the neckline (Pink dotted line)
🎯 Pattern Target: 290+ (+66% from CMP)
📈 All-Time High: 312
🚀 Can Go Big in the Long-Term
#InverseHeadAndShoulders | #ChartPatterns | #DiwaliPick | #Investing | #MuhuratTrading | #LongTerm | #PriceAction
📌 Disclaimer: This analysis is shared for educational purposes only. It is not a buy/sell recommendation. Please do your own research before making any trading decisions.

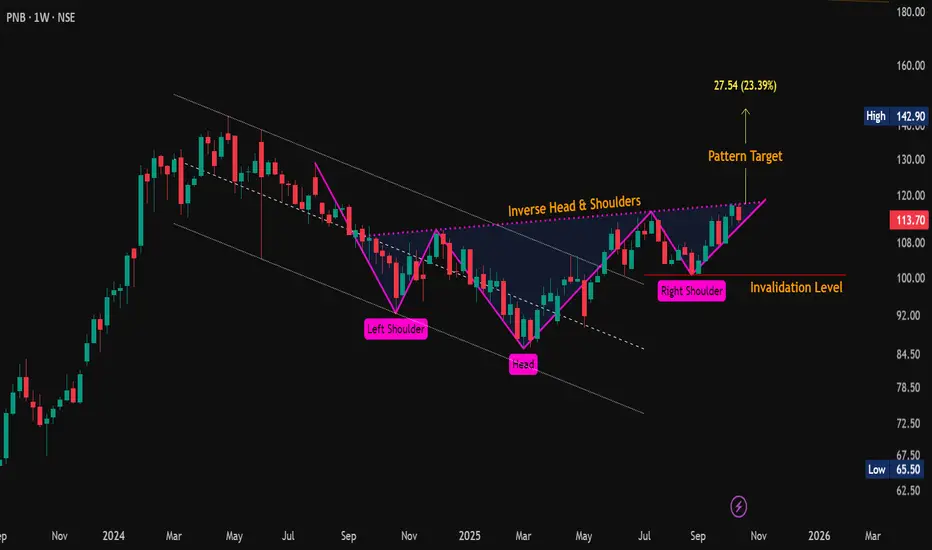
#PNB | Inverse Head & Shoulders Bullish SetupCMP: 113.70
🔼 Key Resistance Levels: 118 / 120 / 143
🔽 Key Support Levels: 113.30 - 110.50 / 107.30
❌ Invalidation Level: 100.60 (Weekly Close Below)
✴️ Breakout Point: Weekly close above the neckline (Pink dotted line) 👀
🎯 Pattern Target: 145 (+27% from CMP)
#PNB | #InverseHeadAndShoulders | #ChartPatterns | #PriceAction | #SwingTrading
📌 Disclaimer: This analysis is shared for educational purposes only. It is not a buy/sell recommendation. Please do your own research before making any trading decisions.
Cup and Handle & Inverse Head and Shoulder in Adani Ports.The Stock Had Formed Cup And Handle & Inverse Head and Shoulder. It seems to breaks out of the Neckline, it may hit the IHNS target of 1662 approximately. And than Target of Cup & Handle. Lets see how it unfolds .Rest targets will be updated as chart unfolds. All Targets mention are Approximate. Good luck. TY .
ITS JUST PURELY FOR LEARNING AND EDUCATIONAL PURPOSE. Please Consult your financial advisor before trading or investing. I am not responsible for any kinds of your profits and your losses. THANK YOU.. JMK

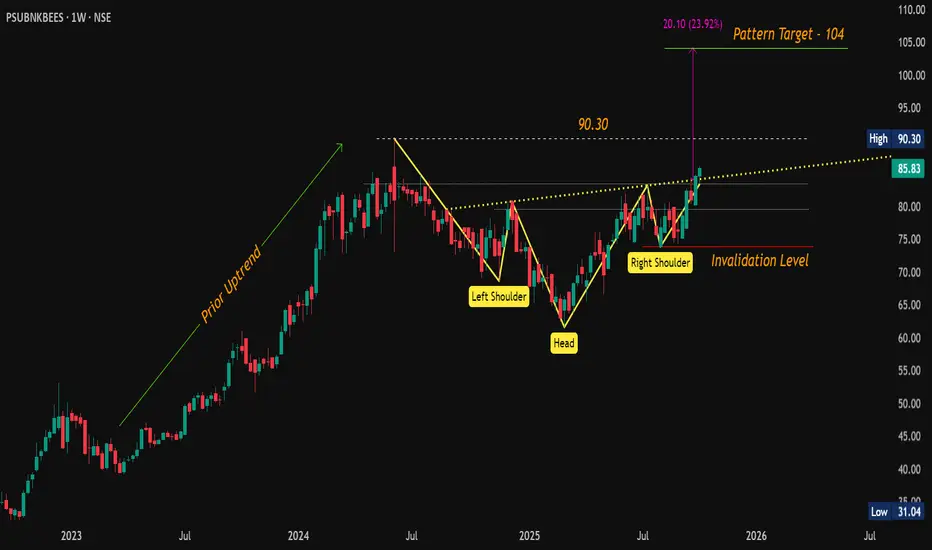
Missed the PSU Bank Rally? #PSUBNKBEES Still Has 24% Upside!CMP: 85.83
PSUBNKBEES has confirmed a classic Inverse Head & Shoulders breakout on the weekly chart , with two consecutive weekly closes above the neckline , a strong technical validation of the pattern.
🔹 Key Levels:
📌 Breakout Level: 84
🔽 Support Zone: 83.45 – 79.50
🔼 Overhead Resistance: 90.30
🎯 Pattern Target: 104 ( ~24% upside from breakout)
This ETF gives broad exposure to PSU banks , making it a lower-risk, sector-wide play for positional investors.
💡 If you are unsure which PSU Bank stock to choose, PSU Bank Bees offers a diversified, stress-free way to capture 20 -30% upside . Ride the trend, avoid the noise.
#ETF | #CNXPSUBANK | #PSUBanks | #InverseHeadAndShoulders | #ChartPatterns
📌 Disclaimer: This analysis is shared for educational purposes only. It is not a buy/sell recommendation. Please do your own research before making any trading decisions.
PNB (W) - Historic Crossroads, 15-Year Trendline Breakout LoomsPunjab National Bank (PNB) is currently positioned at one of its most significant technical junctures in over a decade. A classic bullish reversal pattern is now challenging a formidable, long-term resistance, setting the stage for a potentially explosive move.
The Bullish Setup: An Inverted Head & Shoulders
After reversing its downtrend in February 2025, the stock has meticulously formed a large Inverted Head and Shoulders pattern . This is a well-regarded bullish reversal pattern that typically signals the beginning of a sustained uptrend upon a successful breakout.
The Critical Resistance Confluence
What makes this setup particularly compelling is the location of the pattern's neckline. A breakout requires the stock to overcome a confluence of two powerful resistance levels simultaneously:
1. A 15-Year Resistance Trendline: A major, long-term descending trendline that has been in place since November 2010. Breaking this would be a historically significant event.
2. A Short-Term Horizontal Resistance: A more recent horizontal price ceiling that aligns perfectly with the long-term trendline.
This alignment of a classic reversal pattern with a multi-decade resistance makes the current price level a critical battleground between buyers and sellers.
Supporting this potential breakout, momentum indicators are strong. The short-term EMAs are in a positive crossover and the RSI is rising on both the Monthly and Weekly timeframes. Furthermore, a gradual increase in volume recently suggests growing buyer interest.
Outlook and Key Levels
The outcome depends entirely on whether this critical resistance zone can be breached.
- Bullish Breakout Scenario: A decisive close above the neckline and the dual trendlines, especially on high volume, would confirm the breakout. The measured target of the pattern projects a potential move towards the ₹138 level.
- Rejection Scenario: If the stock fails to overcome this heavy resistance, a rejection could send it back to test support near the ₹100 level, which roughly corresponds to the right shoulder of the pattern.
The key signal to watch for is a high-volume close above the neckline. Until that occurs, this historic resistance remains the primary obstacle.

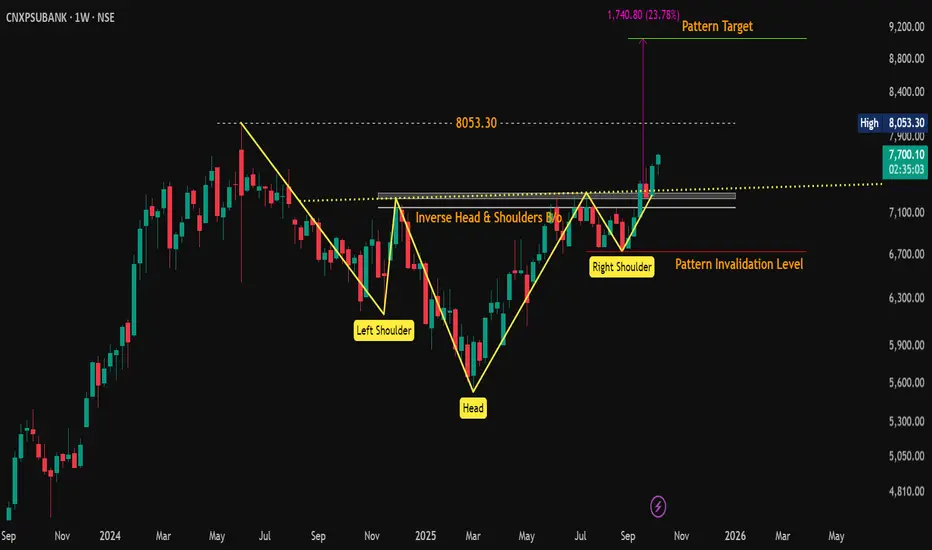
#CNXPSUBANK | Breakout Alert – Inverse Head & Shoulders in Play!CMP: 7,698
PSU BANK index has confirmed a classic Inverse Head & Shoulders breakout on the weekly chart, signaling a strong bullish reversal !
🔹 Neckline Breakout: Weekly close confirmed above 7,324
🔹 Overhead Resistance: 8,053
🔹 Support Zones:
▫️ 7,305 – 7,248
▫️ 7,163 – 7,025
🔹 Pattern Target: 9,000+ (1,740 pts move → +23% upside )
🔹 Invalidation Level: Below 6,730 WCB (Weekly Closing Basis)
✅ Pattern indicates a powerful trend shift — bulls are stepping up aggressively! A clean breakout, ride the trend higher.
#CNXPSUBANK | #TechnicalAnalysis | #InverseHeadAndShoulders | #ChartPatterns
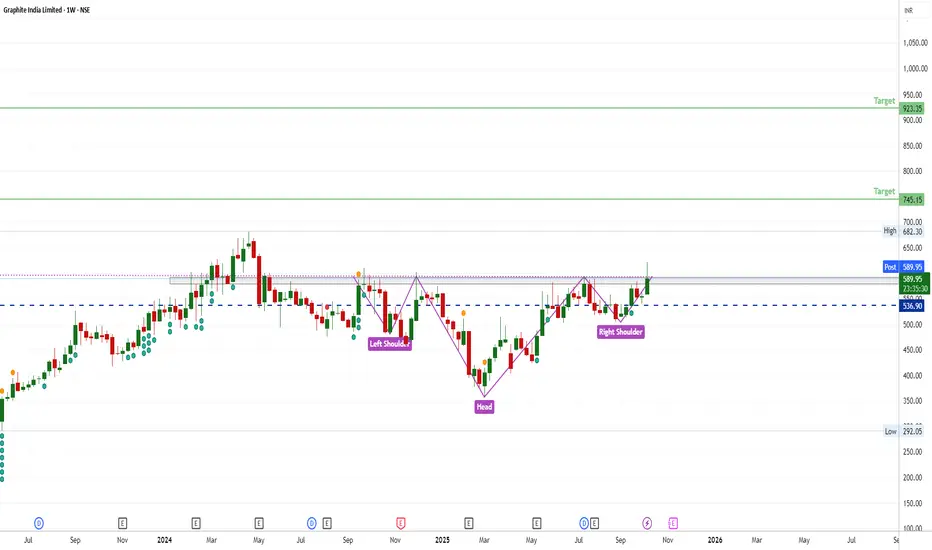
Long time Breakout Head and Shoulder🧩 Pattern Overview
Left Shoulder: Formed when price fell from around ₹620 to ₹500, then bounced back.
Head: A deeper decline down to around ₹420 before recovering — marking the lowest point of the pattern.
Right Shoulder: A smaller dip to around ₹500 before price rose again.
Neckline: The resistance zone connecting the peaks between the shoulders (around ₹590–₹600).
📈 Current Situation
The price has just broken above the neckline (~₹590) — this confirms a bullish breakout of the inverse H&S pattern.
The breakout candle shows strong buying interest.
🎯 Target Projections
Target 1: ₹745 — conservative, measured from the neckline to head distance projected upward.
Target 2: ₹923 — extended target if momentum sustains.
🧠 Interpretation
The breakout suggests a shift from bearish to bullish trend.
Ideally, watch for a retest of neckline (₹590 zone). If it holds and price bounces, it strengthens the move.
Volume confirmation is key — strong volume on breakout adds reliability.
YES BANK BY KRS Charts2nd Sept 2025 / 10:01 AM
Why Yes Bank ?
1. last few years YES BANK is making HH & HLs in Monthly & Weekly TFs . It has potential technically, but will check our patience.
2. Above Chart it fills up all the FVGs - Fair Value Gaps and bounced back in Month of April. As we can see in Chart mentioned recently also same FVG reversal is visible.
3. Also Potential of Reversal chart pattern at bottom of trend is also visible.🤞
4. Less than 2 Rs Risk and Almost 5 Rs Reward is making this trade Safe 👍
5. Point to be noted 20.25 Rs is nearest Resistance and Pattern Target of 28 Rs unlock After breakout of neckline at 22 Rs.

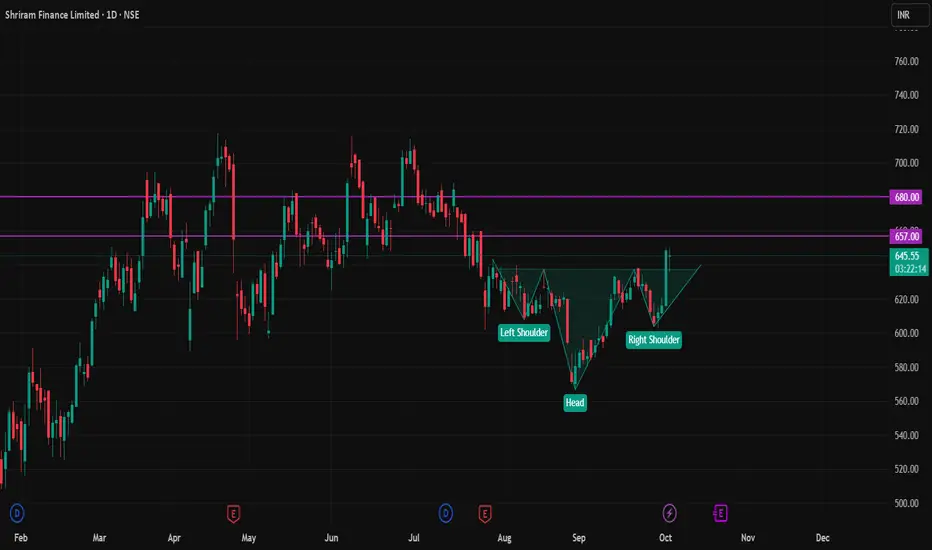
SHRIRAMFIN NSE:SHRIRAMFIN Stock is formed inverted head and shoulders pattern now its taking a retracement level.
Buy above 638 Rupees,
Target 1 is 655 Rupees,
Target 2 is 670 to 680 Rupees,
Stoploss below 600 Rupees (one day candle closed)
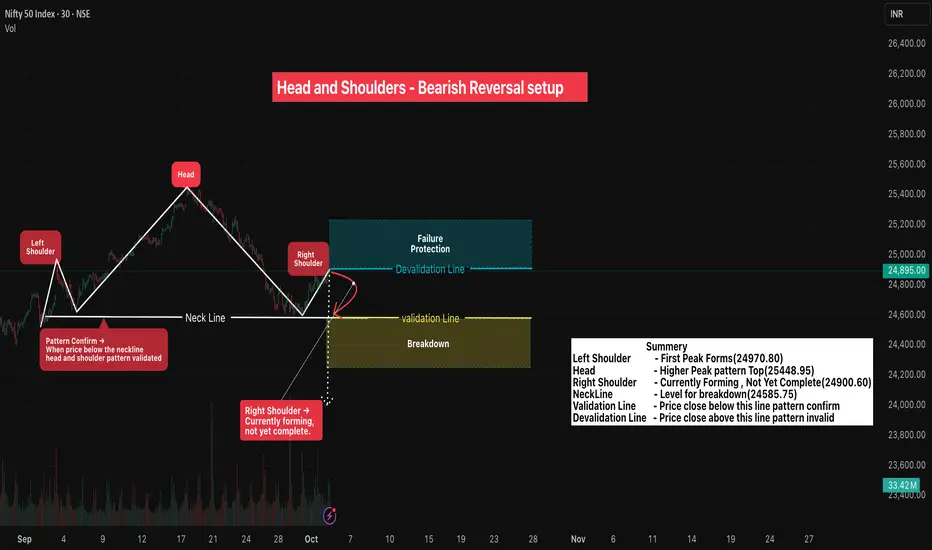
Head and Shoulders - Bearish Reversal Setup🔎Overview
The Head and Shoulders Pattern is a classic bearish reversal formation that signals a potential change in trend from uptrend to downtrend .
It is formed by three peaks:
- Left Shoulder → Price rises, forms a peak, then retraces.
- Head → Price moves higher than the left shoulder, creating the tallest peak, then falls back.
- Right Shoulder → Price rises again but fails to surpass the head, showing loss of momentum.
- Neckline → A line drawn through the two troughs between the shoulders and the head. A breakdown below the neckline confirms bearish sentiment.
This pattern reflects weakening buying pressure and strengthening selling interest, often appearing at the end of strong rallies.
____________________________________________________________
📌 How to Use
• ✅ Pattern Confirmed → When candle closes below the Validation Line
• ❌ Pattern Invalid → If candle closes above the Devalidation Line (Failure Protection).
• Protects against false signals & ensures structured risk management.
____________________________________________________________
📊 Chart Explanation
• Symbol → NSE:NIFTY
• Timeframe → 30m
• Left Shoulder Peak - 24970.30
• Head (Highest Peak) - 25448.95
• Right Shoulder Peak - 24900.80
• Neckline → Drawn by connecting the two troughs between shoulders and head.
• Validation Level → 24,585.75 → Close below = Pattern Confirmed .
• Devalidation Level → 24,910.65 → Close above = Pattern Invalid.
____________________________________________________________
👀 Observations
- The right shoulder often appears weaker, highlighting reduced buyer confidence.
- Once the neckline is tested multiple times, probability of a breakdown increases.
- Volume generally decreases during formation and expands during breakdown, strengthening confirmation.
- This setup helps traders anticipate major reversals rather than chasing late entries.
- Head and Shoulders is widely followed, making it self-fulfilling as many traders act on the same signal.
____________________________________________________________
💡 Why It Matters
Head & Shoulders is one of the most reliable reversal patterns, giving clear validation/devalidation levels for structured risk management. It helps avoid false breakouts and provides traders with predefined stop-loss and target zones.
____________________________________________________________
✅ Conclusion
Breakdown below the Validation Line confirms bearish reversal bias. Combine this with broader market context, volume confirmation, and disciplined position sizing for effective trading decisions.
____________________________________________________________
⚠️ Disclaimer
📘 For educational purposes only.
🙅 Not SEBI registered.
❌ Not a buy/sell recommendation.
🧠 Purely a learning resource.
📊 Not Financial Advice.
BANKNIFTY: A CASE STUDY ON POSSIBLE INVERTED H&S BREAK OUT!!!• BN have formed a inverted head and shoulder pattern.
• A strong base has been formed with solid volume
• Possibility of a breakout is likely on next TRADING SESSION.
• US – INDIA tariff settlement might cause violent up move.
• Go long once and hour candle closed above the neckline.
• Levels and stoploss are marked in the chart.
• Position sizing and money management is the key to trading success. Hence trade with psychology.
• Education purpose only. Happy trading.

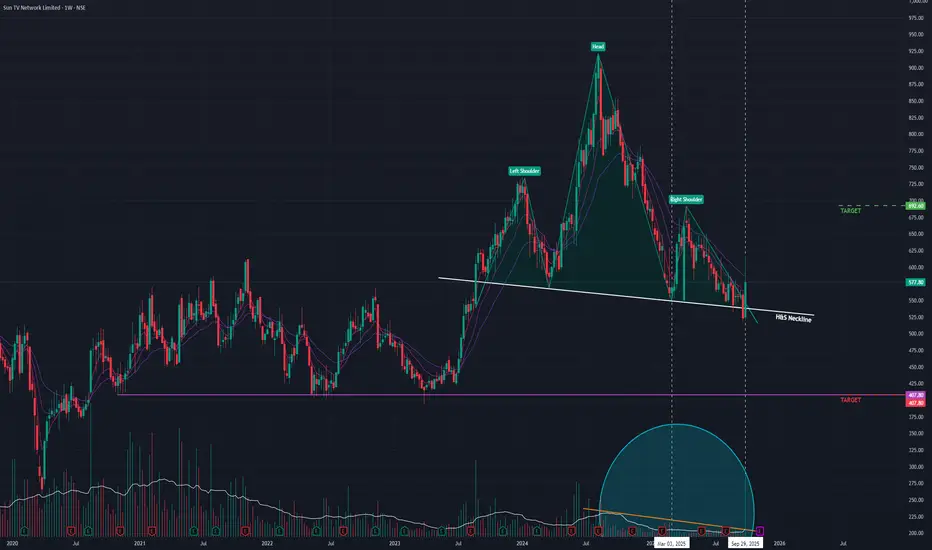
Sun TV (W) - Forms a Bearish Head & Shoulders PatternSun TV has formed a classic Head and Shoulders pattern , a well-known technical formation that typically signals a bearish trend reversal. The stock is currently trading near the critical "neckline" support of this pattern. A decisive break below this level would confirm the pattern and could signal the start of a significant downtrend.
Supporting Bearish Indicators 📉
The bearish outlook is further supported by volume trends:
- Declining Volume: The average trading volume has been decreasing, which generally indicates a lack of buying interest and conviction in the current price levels. While there have been occasional volume spikes, the overall trend is weak.
Outlook and Key Levels
The price action in the coming weeks will be crucial. The key event to watch for is a breakdown below the pattern's neckline.
- Bearish Case: A confirmed breakdown below the neckline would validate the Head and Shoulders pattern. In this scenario, the stock could enter a bearish phase with a potential downside price target near the ₹407 level.
- Bullish Reversal: Conversely, if the neckline holds as strong support and the stock reverses its current trajectory, a move back towards the ₹692 resistance level could be possible.
MetLife, Inc #NYSE #EQUITIES $METMetlife, Inc.
Classical Inverse Head & Shoulder breakout.
Initiating fresh longs here

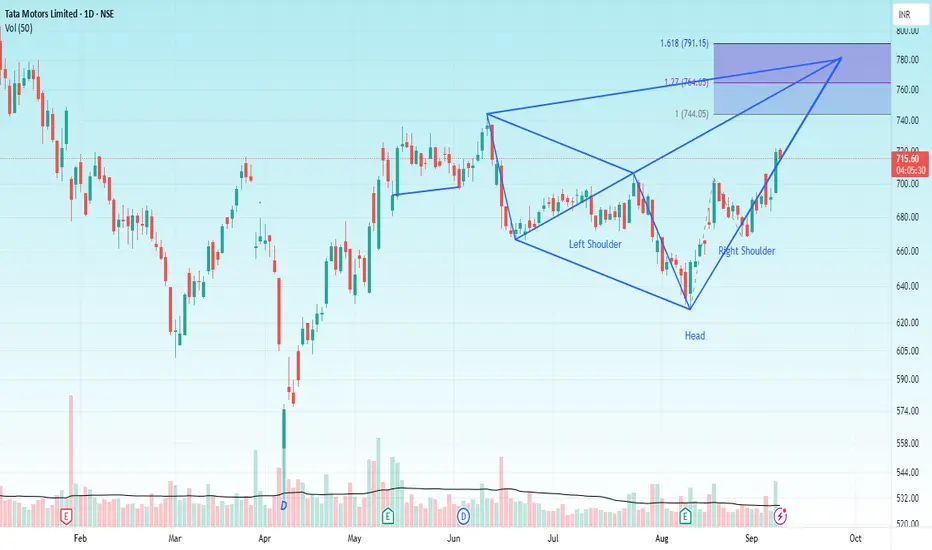
TATA MOTORS Hello & welcome to this analysis
The stock in daily time frame has given a double breakout
Inverse Head & Shoulder
Bullish Harmonic Seahorse
The upside levels as per IHS are 740 & 790 while the Seahorse pattern is indicating 775.
Both patterns have strong support at 690-700 and both would be considered invalid below 665
All the best
HINDCOPPER H&S BREAKOUTHindcopper breaking H&S pattern weekly
huge volume this week with bullish rsi above 60
target1 375 target2 416
trading above all key ema
NO BUY/SELL RECOMENDATION


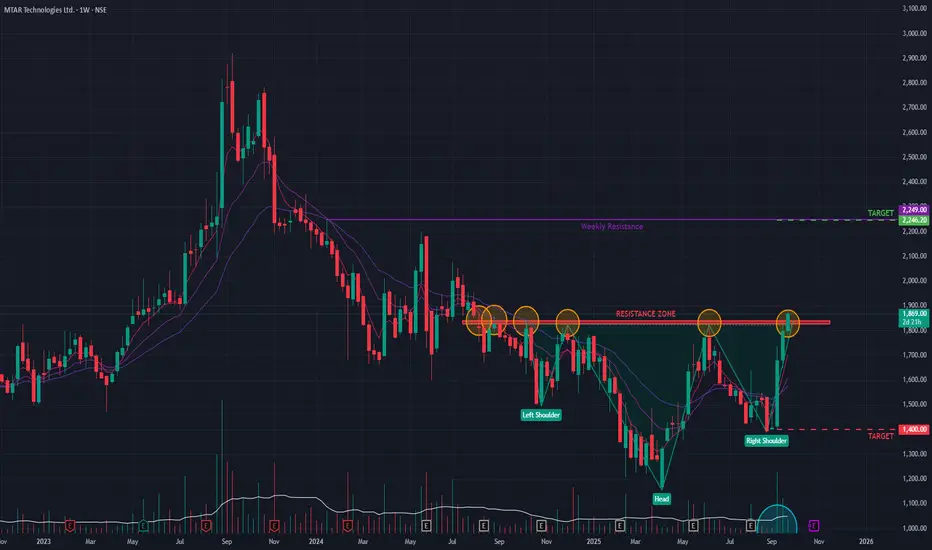
MTAR Tech (W) - Signals Bullish Reversal with Pattern BreakoutMTAR Tech has shown a significant sign of a potential long-term trend reversal. The stock, which has been in a prolonged downtrend since its All-Time High in September 2023, has decisively broken out of an Inverse Head & Shoulders pattern on the weekly chart today.
This classic bullish reversal pattern was confirmed by a strong upward move that breached the neckline, supported by decent trading volume .
Multi-Timeframe Confirmation 👍
The bullish thesis is strongly supported by momentum indicators across all major timeframes:
- Broad Momentum: The Relative Strength Index (RSI) is in a bullish crossover state on the monthly, weekly, and daily charts , indicating synchronized positive momentum.
- Volume Trend: The general trend of building volume suggests increasing buyer participation and conviction in the upward move.
Future Outlook and Key Levels
The breakout from this major reversal pattern suggests the downtrend that began in mid-2023 may be over. The price action in the coming days will be crucial for confirmation.
- Bullish Case 📈: If the breakout momentum is sustained, the stock could be on a path toward the next major resistance level near ₹2,245 .
- Bearish Case 📉: However, if the breakout fails to hold and momentum wanes, the stock could pull back to test support around the ₹1,400 level.
Cochinship AnalysisCochin Shipyard Limited (COCHINSHIP) Bullish Bet
The chart presented indicates the formation of an Inverse Head and Shoulders pattern, which is considered a bullish reversal pattern.
Left Shoulder: Formed around early August 2025.
Head: Formed during mid-August 2025 at a lower price level.
Right Shoulder: Formed towards late August 2025.
Neckline: Around the ₹1,750–1,765 range.
This suggests a potential trend reversal from bearish to bullish.
Current Price (CMP): ~₹1,745.70
Neckline Resistance: ~₹1,765
Breakout Target (based on pattern projection): ₹1844 / 1918 / 1992 / 2097+++
Support Levels:
Immediate Support: ₹1,700
Strong Support: ₹1,650
1. Trendline Break: The long-term downward trendline appears to be broken, indicating reduced selling pressure.
2. Volume Confirmation (not visible in chart): Ideally, a breakout above neckline with strong volumes will confirm the bullish reversal.
3. Potential Upside: If price sustains above neckline (~₹1,765), the stock may aim for ₹2,000–2,220 in the short to medium term.

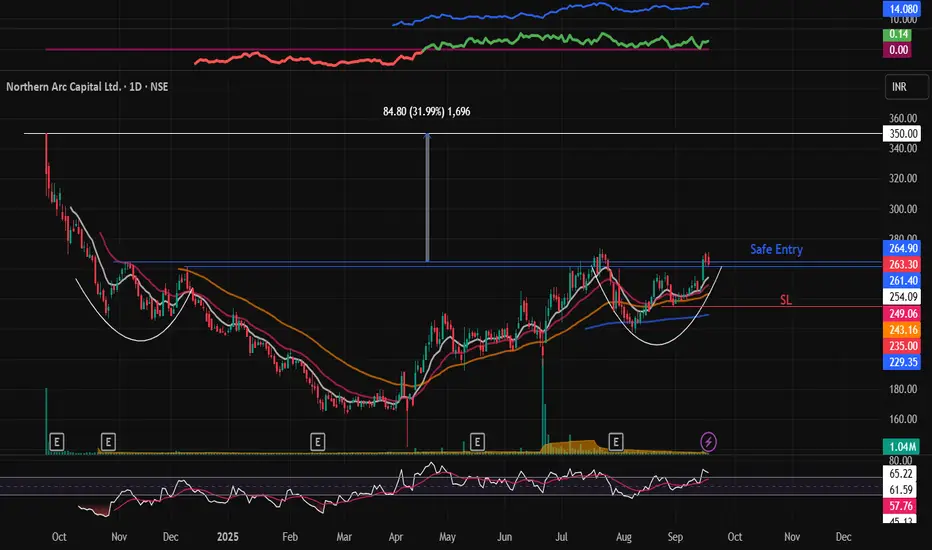
NORTHARC : Swing pick#NORTHARC #patterntrading #chartpattern #inverseheadandshoulder #breakoutstock #swingtrade #trendingstock
NORTHARC :
>> Low PE Stock
>> Chart pattern Trading
>> Inverse Head & Shoulder pattern
>> Volumes Building up
>> Stock showing strength
Swing Traders can lock profit at 10% and keep Trailing
Please Boost, comment and follow us for more Learnings.
Disc : Charts shared are for learning purpose only, not a Trade recommendation. Do your own research and consult your financial advisor before taking any position.