Sun Pharma: A Bullish OutlookHello Friends,
Welcome to RK_Chaarts,
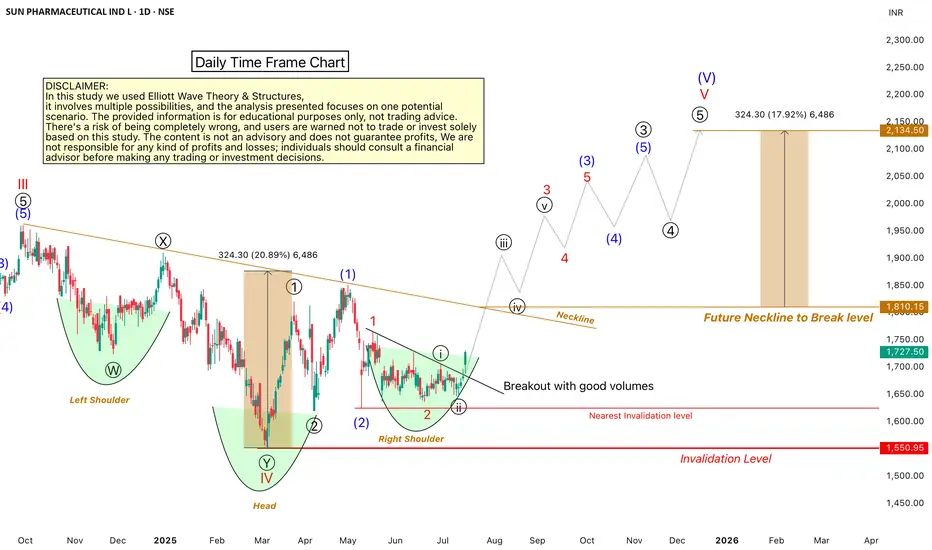
Let's analyze the Sun Pharmaceuticals chart using technical analysis, specifically the Elliott Wave Theory. According to this theory, the September 2024 top marked the end of Wave III cycle degree in red, and the March 2025 bottom marked the end of Wave IV cycle degree in red Now, Wave V of cycle degree in red has begun, which will move upward.
Within Wave V, we should have five sub-divisions of Primary degree in black, with Wave ((1)) & Wave ((2)) already completed. Wave ((3)) has started, with five further sub-divisions of one lower degree intermediate degree, We've marked these in blue, with Wave (1) and Wave (2) completed, and Wave (3) started. Within Wave (3), we have minor degree waves in red, with Wave 1 and Wave 2 completed, and Wave 3 breaking out today with good intensity of volumes.
We can see that the wave counts are super bullish, and so is the RSI, which is above 60. The MACD is also positive, and the price is above the 50-day and 200-day EMAs on the daily and weekly time frames. There's no moving average hurdle, which is another super bullish sign.
We can also see a higher high and higher low formation, which is a bullish sign according to Dow Theory. Additionally, an inverted head and shoulders pattern is forming, with the right shoulder being made. When it breaks out above the neckline, it will give us a target, which aligns with the Elliott Wave Target projection.
All these indicators – technical analysis, price action, and Elliott Wave – point to a bullish trend. However, there's an invalidation level at 1550; if the price falls below this level, our wave counts will be invalidated.
We're projecting targets between 2000-2200 based on Elliott Wave theory projections. Please note that this analysis is for educational purposes only and should not be considered as investment advice.
This post is shared purely for educational purpose & it’s Not a trading advice.
I am not Sebi registered analyst.
My studies are for educational purpose only.
Please Consult your financial advisor before trading or investing.
I am not responsible for any kinds of your profits and your losses.
Most investors treat trading as a hobby because they have a full-time job doing something else.
However, If you treat trading like a business, it will pay you like a business.
If you treat like a hobby, hobbies don't pay, they cost you...!
Hope this post is helpful to community
Thanks
RK💕
Disclaimer and Risk Warning.
The analysis and discussion provided on in.tradingview.com is intended for educational purposes only and should not be relied upon for trading decisions. RK_Chaarts is not an investment adviser and the information provided here should not be taken as professional investment advice. Before buying or selling any investments, securities, or precious metals, it is recommended that you conduct your own due diligence. RK_Chaarts does not share in your profits and will not take responsibility for any losses you may incur. So Please Consult your financial advisor before trading or investing.
Head and Shoulders
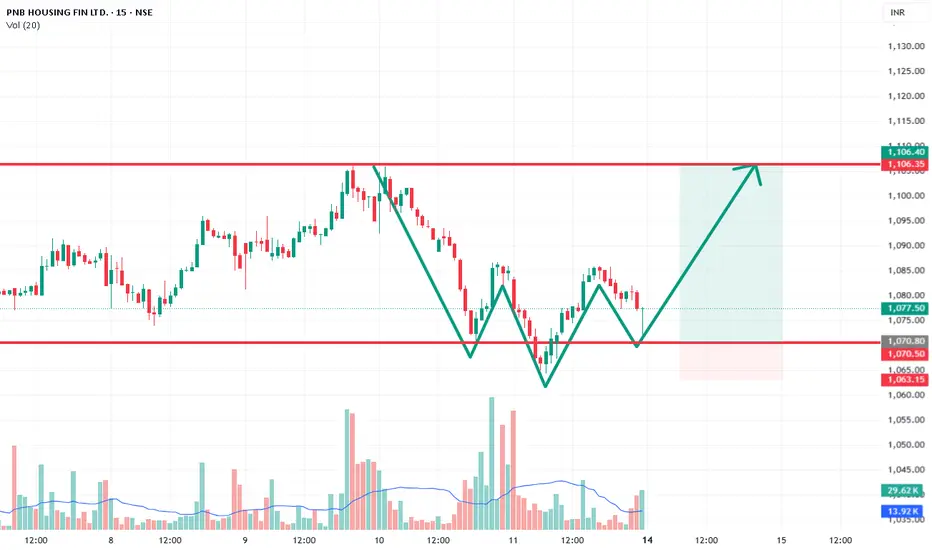
Intraday : PNBHOUSING for 3.3% UpsidePNBHOUSING
Inverse head & shoulder pattern should be perform in this counter with 15 min time frame.
Take entry near 1070
Target 1106
Strong SL : 1063
Target will be 3.3% and SL will be only 0.7% so it will be best deal.
dont forget to watch on Monday morning.
EURUSD SELL IDEA FOR DAY TRADINGHere We Could Sell On Trendling and Immediate resistance basis for EURUSD to gain 1:2 RR Ratio

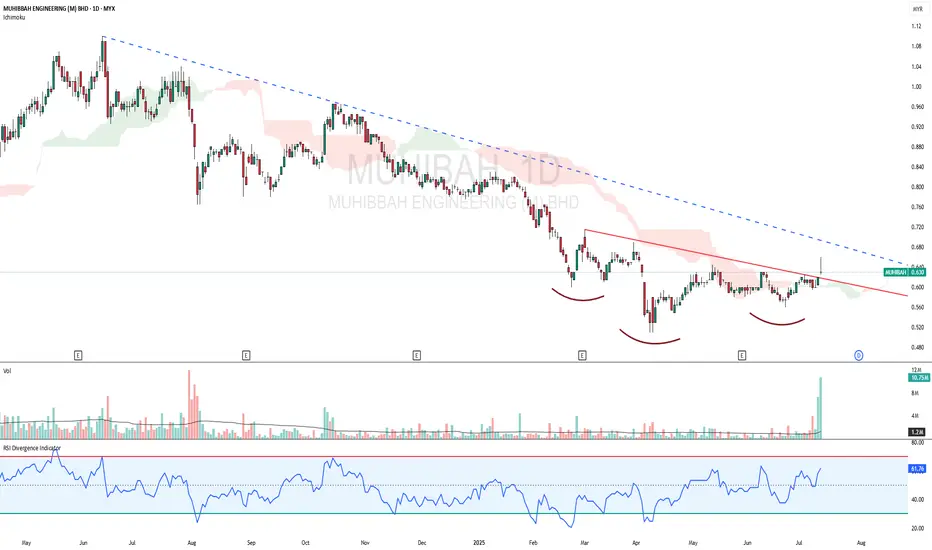
MUHIBAH - Downward slopping INVERTED HEAD & SHOULDERSMUHIBAH - CURRENT PRICE : RM0.630
On 11 July 2025 the stock made a small gap up and closed above minor down trendline. Eventhough it closed as a doji candle, it is viewed as BULLISH as the price broke out inverted head and shoulders NECKLINE RESISTANCE with high trading volume. There is a higher low recently which is usually occurs in this chart pattern - indicating possible bottom have reached. Nearest target will be RM0.680 and RM0.720 while support will be RM0.595. Take note that the first target of RM0.680 also approximately near the major down trendline.
ENTRY PRICE : RM0.625 - RM0.630
TARGET : RM0.680 (+7.94%) and RM0.720 (+14.29%)
SUPPORT : RM0.595 (-5.56%)
XAUUSD Long Idea – Inverse Head & Shoulders ReversalTechnical Overview:
I’m observing a clean Inverse Head & Shoulders pattern forming on the 4-hour chart:
✅ Left Shoulder: Formed around 3,270
✅ Head: Rejection and reversal near 3,190
✅ Right Shoulder: Higher low around 3,300
✅ Neckline: Approx. 3,350 zone
Price has broken above the neckline area and is currently retesting it as support, which strengthens the bullish case.
Trade Plan:
🔹 Entry: Current zone near 3,340–3,350 retest
🔹 Targets:
🎯 TP1: ~3,400 (recent structural high)
🎯 TP2: ~3,450–3,460 (major resistance block)
🔹 Stop Loss:
Below the right shoulder area at ~3,290 for risk containment
Rationale:
1. Inverse Head & Shoulders is a classic bullish reversal pattern
2. Break and retest of neckline suggests buyers stepping in
3. Momentum shift confirmed by higher low structure
Potential Path:
I expect price to bounce from the neckline retest and push towards the 3,400 psychological level. If momentum persists, continuation to the 3,450 resistance block is likely.
📊 Risk to Reward Estimate:
Approx. 1:2 to 1:3 depending on target selection
📝 Note:
This analysis is for educational purposes—always manage your risk and validate entries with your own confirmations.

SilverSilver ( OANDA:XAGUSD ) – Bearish Head & Shoulders Forming on 4H Chart
Silver is currently trading at $35.95/oz and forming a Head and Shoulders pattern on the 4-hour chart — a classic bearish reversal setup. The right shoulder is still in formation, with the neckline support around $35.26.
🔍 Key Levels to Watch:
Neckline: $35.26
Breakdown Target: $33.24
Pattern Type: Bearish Head & Shoulders
⚠️ A decisive break below the neckline could trigger a short-term correction toward $33.24. Until then, price action near the neckline should be watched closely for confirmation.
📉 Short bias on breakdown. Wait for confirmation before entry.

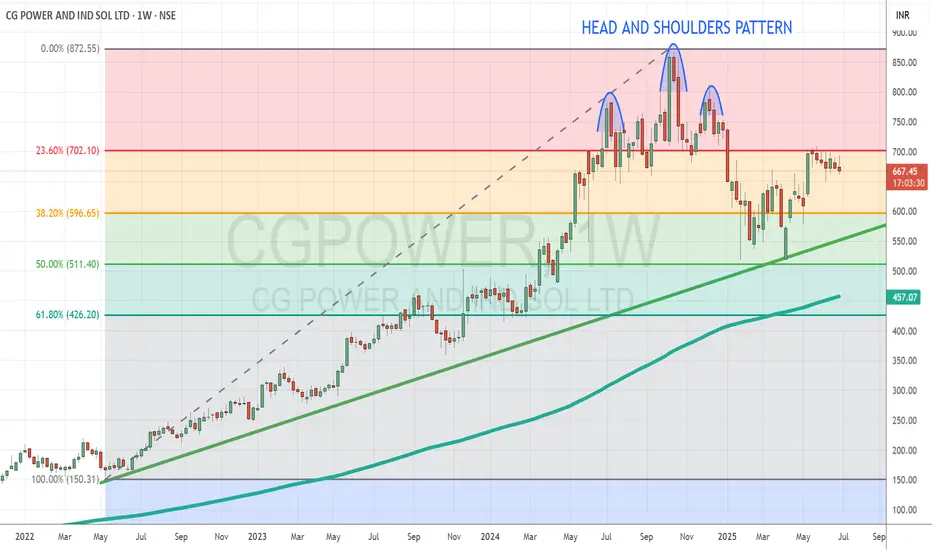
CG Power Rebounds After First Major Correction Supported by StroTopic Statement:
CG Power has made its first significant correction and is now set on a recovery path in line with the broader market rally.
Key Points:
* The stock respected a major trendline, receiving strong support during its recent correction
* It found repeated and substantial support at the 50% Fibonacci retracement level, reinforcing its base
* The correction was signaled by a head and shoulders pattern clearly marked on the chart, leading to the recent pullback before the recovery began
* The stock price is very expensive as it is mostly overextended above the 200 day exponential moving average
APOLLOHOSP Soon to ATH??!!!Yessss!!!!!
Chart patterns looks prudent for the above titled opinion
Rounding bottom....with a Inverted H&S pattern awaiting a Breakout!!!!!!
Expecting a Breakout by this week or next.
We can make our entry after the breakout solid candle....
Just add it to your watchlist and keep an eye on it!!!!
will update once the breakout happens!!!!!
just my opinion....not an advice nor tip....
Thank you!!!!!!

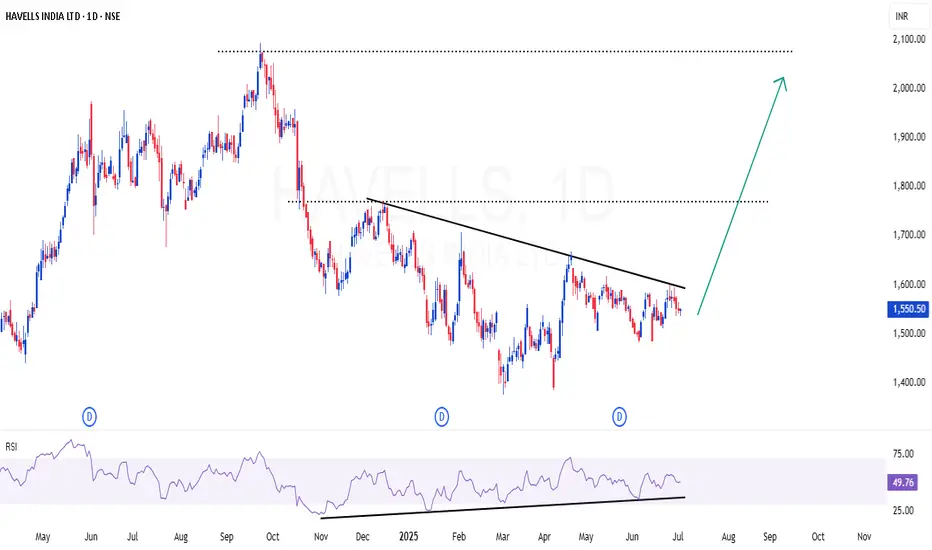
HAVELLS | Pleasant set up - INHS & RSI divergenceHAVELLS | Pleasant set up - INHS & RSI divergence
Strong RSI divergence in daily time frame
Inverted Head & Shoulder setup also in visual
A small dip may be possible for 8-10% in this stock , as market (NIFTY) is over heated. But we can consider that as opportunity to scale up the position
CMP : 1550 (Dip : 1480)
Head And Shoulder in Formation. Will it succeed?Gold is trading near the Support of 3250 3300
With a head and shoulder in formation.
Will it complete and give break on the downside remains to be seen.
If it does, 3050 could be tested.
Failure could lead to rally again, towards ATH and 3600

Gold Still Above Support Zone 3300Bears have Some reason to worry.
Rightly so, since we are Hovering around Right Shoulder
If Bears Fail to capitalise on this opportunity to Enter Shorts again..
We could well be Looking at ATH Aiming 3600 3700
Rationale
Taking Support at 20 50 DEMA
Weekly support at 3300
Prolonged Consolidation has allowed RSI and MACD to cool down and Yet Trade in Bullish Territory

Long Axis Bank - target 1500Axis bank is forming inverted head and shoulder pattern. If it continues to form this pattern
then following are the target
Target 1 - 1218
Target 2 - 1339
Target 3 - 1500
Medium term view

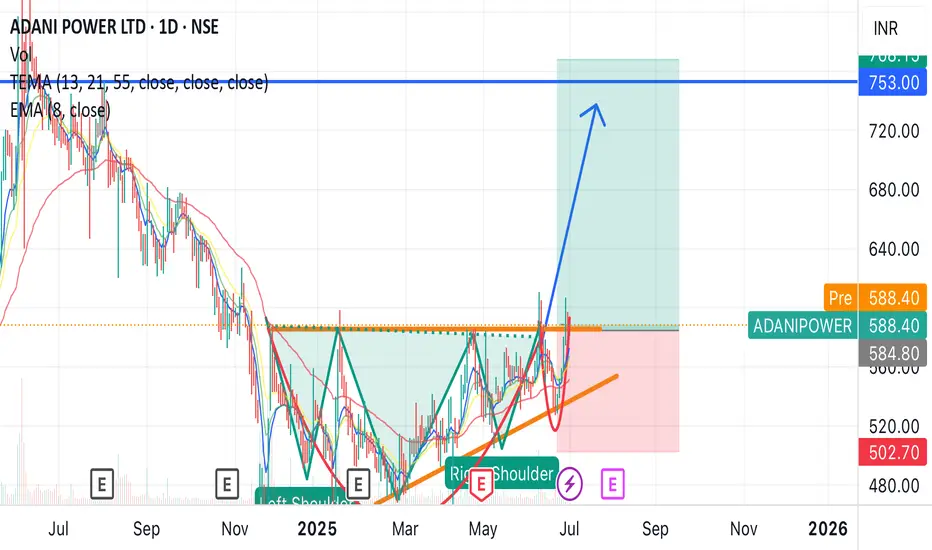
Adani power breakout anytime Adani power price hover just above resistance can give breakout anytime, earlier it was showing head and shoulder pattern and now changed into cup and handle pattern, also the support is also moving up.
Can expect a breakout anytime.
Entry around - 600
Target - 750
Duration 1-2 month
Head and shoulder into cup and handle patternHudco turning head and shoulder pattern into cup and handle pattern price is near resistance and break anytime. This is a short term trade
Buy around - 230-240
Target - 340
Duration - 2-3 months

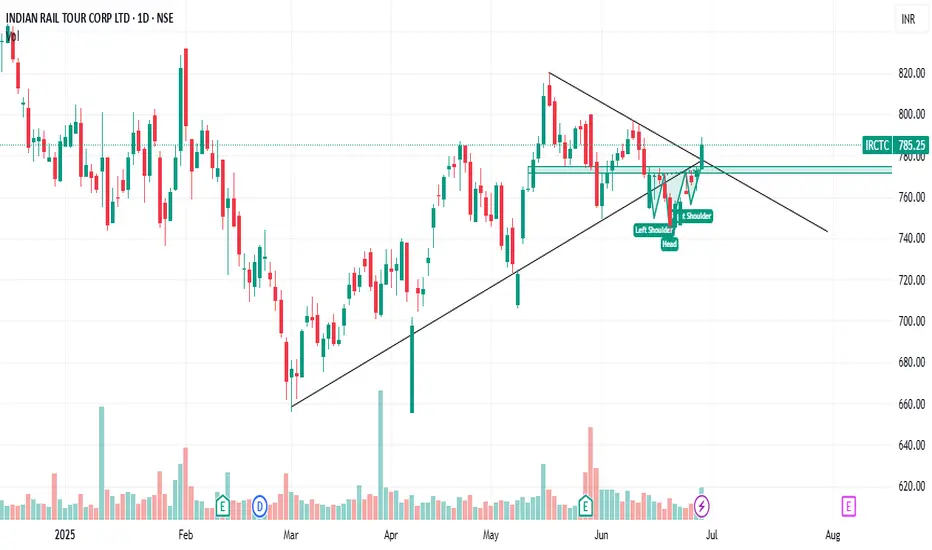
Uptrend with Inverted H&S of NSE:IRCTC
Buy at 791
SL-762
Target 820
Strategy : on uptrend the script has shown the breakout of Inverted H&S with the increasing volumes.
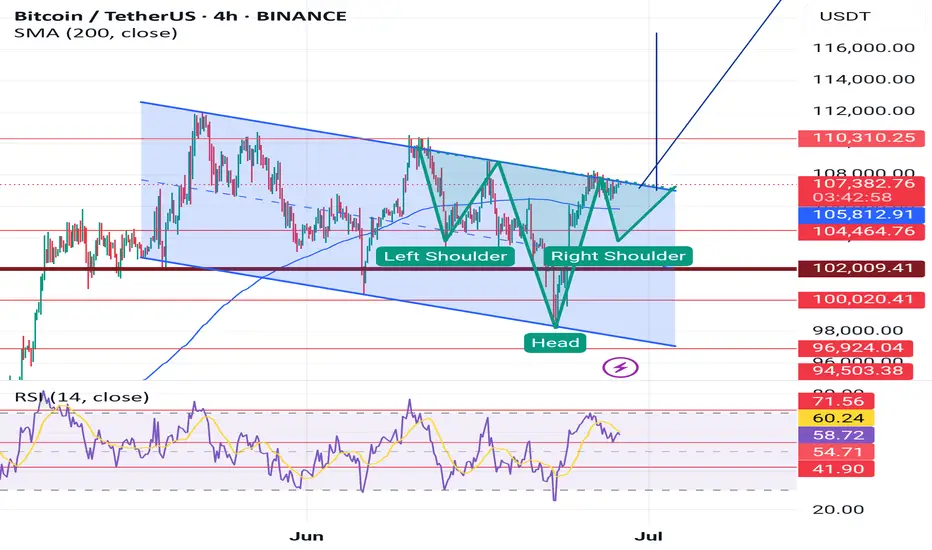
BTCUSDT creates another head and shoulder pattern BTC is creating inverse head and shoulder pattern in daily time frame as well as in 4H time frame, currently BTC is creating Bullish flag pattern in larger time frame and in that Bullish flag it's likely to create inverse head and shoulder pattern, however in both scenarios it's look Bullish with target of 1,17,000$ for inverse head and shoulder pattern, And 1,45,000$ for Bullish flag pattern, And in daily head and shoulder pattern target is 1,50,000$. It can come to retest 1,03,000$ to 1,04,000$ for LIQUIDITY purposes and to complete Right shoulder.
Boond Boond mein poshan!Bajaj Consumer Care Ltd
Risk to reward ratio looks good. Strong support 150. Made proper inverse head and shoulder pattern.
About
Bajaj Consumer Care is engaged in the business of cosmetics, toiletries and other personal care products. The Company has presence in both domestic and international markets.(Source : 201903 Annual Report Page No: 98)
Key Points
Product Portfolio
a) Hair Care Products
The segment is led by its flagship product, Bajaj Almond Drops Hair Oil (ADHO) — a premium, non-sticky oil that commands strong brand recognition. The Almond Drops brand has diversified into shampoos, conditioners, serums, and a cooling variant. The other products include Ayurvedic and functional oils like Brahmi Amla, Amla Aloe Vera, Sarson Amla, and Coco Onion. Their 100% Pure Coconut Oil has shown notable growth (19% in FY25), capturing a 2% all-India market share, with 6–10% shares in key states.
b)Skin Care Products
Bajaj extended its Almond Drops equity into personal care with products like Almond Drops Lotion, Soap, and Serum. It also offers the Nomarks range — known for its anti-marks positioning — including creams, face washes, and soaps, targeting consumers with skin blemish concerns.
c) Digital First & Premium Brands
The segment caters to evolving, health-conscious consumers. The Bajaj 100% Pure Series features chemical-free, cold-pressed oils like Castor, Olive, Jojoba, and Virgin Coconut, sold primarily online. Natyv Soul, a premium brand, sources exotic ingredients globally — offering Argan Oil products, enriched hair oils (with Marula, Rosehip, Apple Seed), and specialized serums and masks using ingredients from Peru, Brazil, and France.
Source: Screener.in
Leadership Changes at the Top:
The surge followed an exchange filing announcing key management changes by Bajaj Consumer:
Naveen Pandey has been appointed Managing Director with effect from July 1, 2025, subject to the approval of the members at the ensuing 19th Annual General Meeting. He succeeds Jaideep Nandi, whose tenure concludes on June 30.
Mr. Pandey previously served as Managing Director at Marico Bangladesh Ltd from 2016-2018, and currently as CEO of Unibic Foods India Pvt Ltd.
He brings over 20 years of experience across sales, strategic planning, and category innovation in the FMCG space.
The company also appointed Aakash Gupta as Head - Finance, replacing Richard D’Souza on the same date.
What Investors Need to Know:
The sharp rise in share price appears to be driven more by sentiment than by any change in business fundamentals.
While Naveen Pandey brings strong FMCG experience from companies like Marico and Unibic, there is no clarity yet on his specific plans or priorities for Bajaj Consumer. The company has not outlined any new strategy or directional change since his appointment.
For now, the stock seems to be reacting to the potential for leadership-driven change, not actual financial improvement. Investors may wait to see if the new MD introduces initiatives that can improve growth, expand margins, or revive demand in core categories.
Until real performance indicators emerge, this remains a speculative re-rating.
Conclusion:
The 20% jump in Bajaj Consumer’s share price was triggered by a leadership change, not by a shift in fundamentals. While the new MD brings relevant FMCG experience, the company’s recent performance remains weak, with declining profit and muted revenue growth. There’s been no strategic update or operational shift yet. For now, the rally looks like a sentiment-driven move. Whether it sustains will depend on what direction the new leadership takes and how soon the business sees a pickup. Until then, the core story remains unchanged.
Source: Indmoney.com
📝 Chart Purpose & Disclaimer:
This chart is shared purely for educational and personal tracking purposes. I use this space to record my views and improve decision-making over time.
Investment Style:
All stocks posted are for long-term investment or minimum positional trades only. No intraday or speculative trades are intended.
⚠️ Disclaimer:
I am not a SEBI registered advisor. These are not buy/sell recommendations. Please consult a qualified financial advisor before taking any investment decision. I do not take responsibility for any profit or loss incurred based on this content.

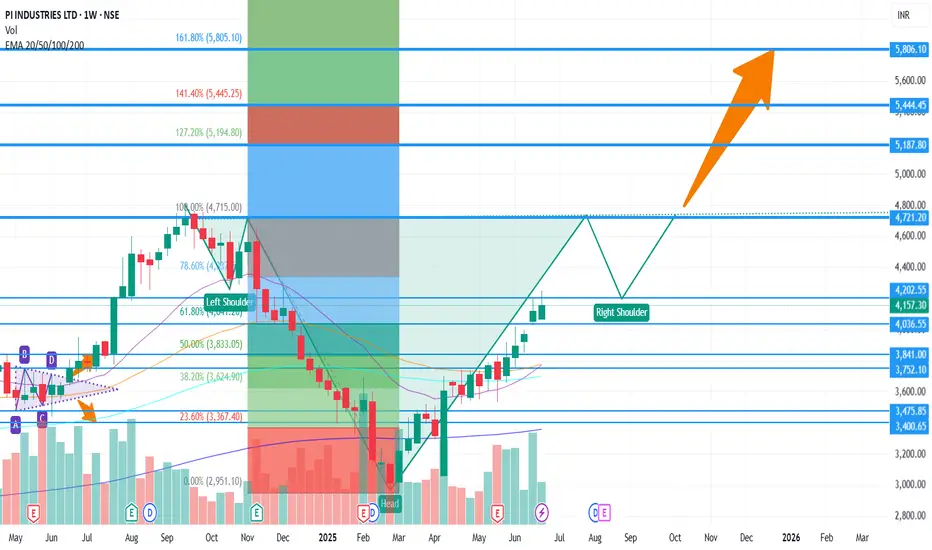
Long PIIND - Target 5800PIIND on weekly chart is forming Inverted Head and Shoulders Pattern.
The stop loss is low of the Head.
Target 1 - 4800
Target 2 - 5300
Target 3 - 5800
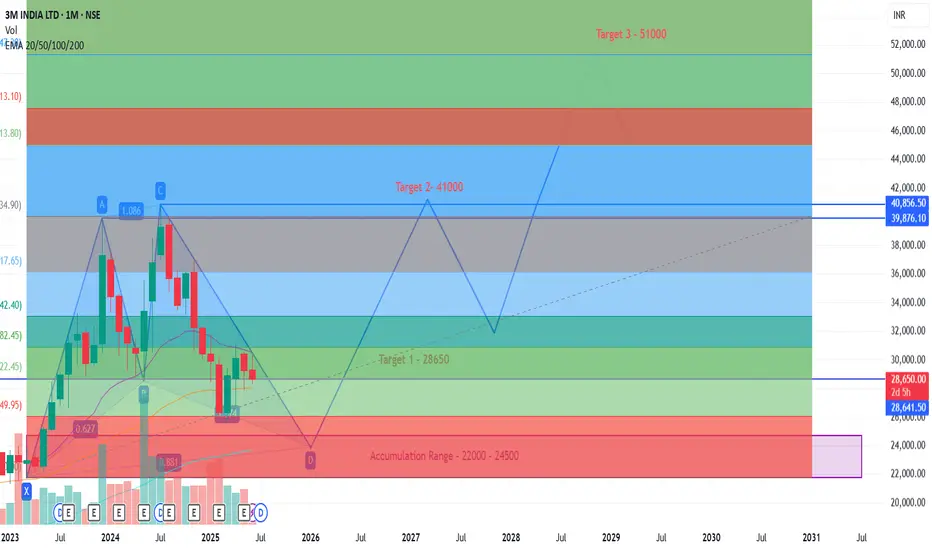
3MIndia Accumulate Range - 24500 - 22000 - Target - 51000View is Long term and patience is the KEY.
3M India is bearish currently on Monthly chart and seems will be bearish till end of year. Currently making a harmonic pattern. Will turn bullish my start of 2026.
Accumulation Range - 21000 to 24500
Long term Final Target - 51000+
Intermediate targets marked on the chart.
SECTOR WATCH NIFTY ITBig Breakout on the watch
Inverse head and shoulder pattern on NIFTY IT chart.
Pattern is already activated and can accumulate IT stocks.
CMP 38600 TARGET OF 45000 with SL of right shoulder 36700
#harmonic
#sector analysis
#headandshoulder
#breakout
#trading

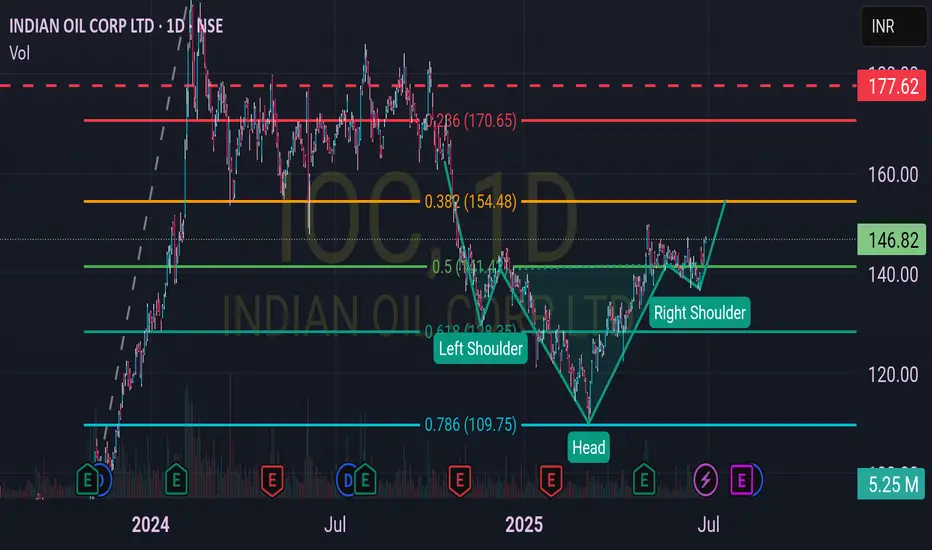
IOC - Fascinated by the Fibonacci!
Unveil the mesmerizing journey of Indian Oil Corp Ltd (IOC) on this captivating chart!
Behold the Fibonacci levels, meticulously drawn two months ago, revealing a fascinating truth.
Witness the price action align flawlessly with these golden ratios, a trader's dream come true.
Marvel at the emerging head and shoulder pattern, hinting at a potential trend reversal.
Anticipate an exhilarating uptrend as the pattern nears completion, sparking excitement.
Strategize with a trailing stop from entry, safeguarding your gains with precision.
Embrace proper risk management to navigate this thrilling market adventure.
The 0.618 level at ₹154.48 and 0.786 at ₹109.75 have held strong, guiding the price.
The current price of ₹146.73 teases a breakout, aligning with the right shoulder.
Prepare for an upward surge, blending Fibonacci magic with pattern perfection!
BPCL Gains Momentum After Key Support, Faces Resistance AheadTopic Statement:
BPCL has made a strong upward move in the recent rally, though key resistance levels and chart patterns suggest caution.
Key Points:
* A head and shoulders candlestick pattern is visible, indicating potential reversal signals to watch
* The stock took heavy support at the 50% Fibonacci retracement level, where it also briefly dipped below the 180-day EMA
* Price is currently facing resistance at the 23.6% Fibonacci level near 317, which may act as a short-term cap on further gains

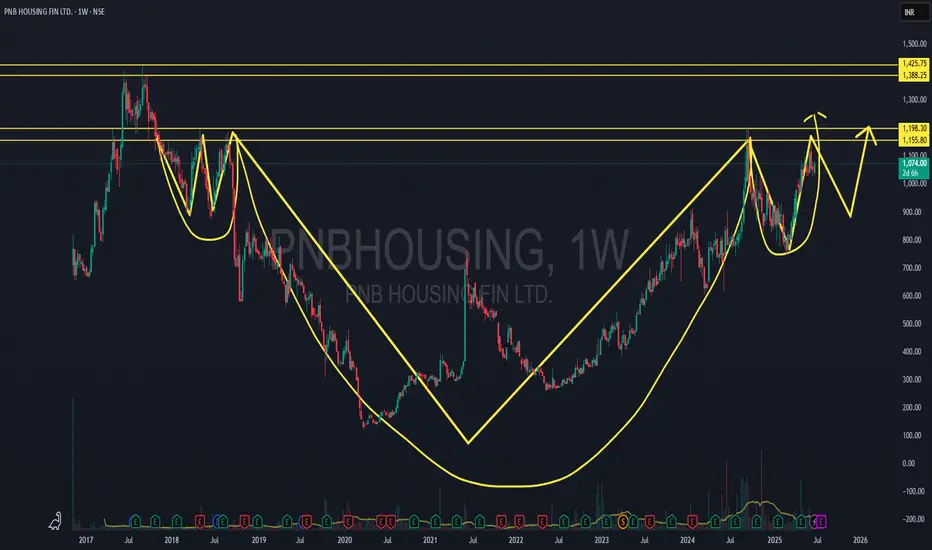
CUP in Making & H&S in PNB HOUSING FinanceGood to go Long as PNB in Making of CUP &
ready for give Breakout of Inverse H&S pattern
Safe Traders Enter after one Pattern Conformation @ 1200 on Daily Closing with Big Bull candle
CUP Pattern Breakout at 1430-1450 Range..