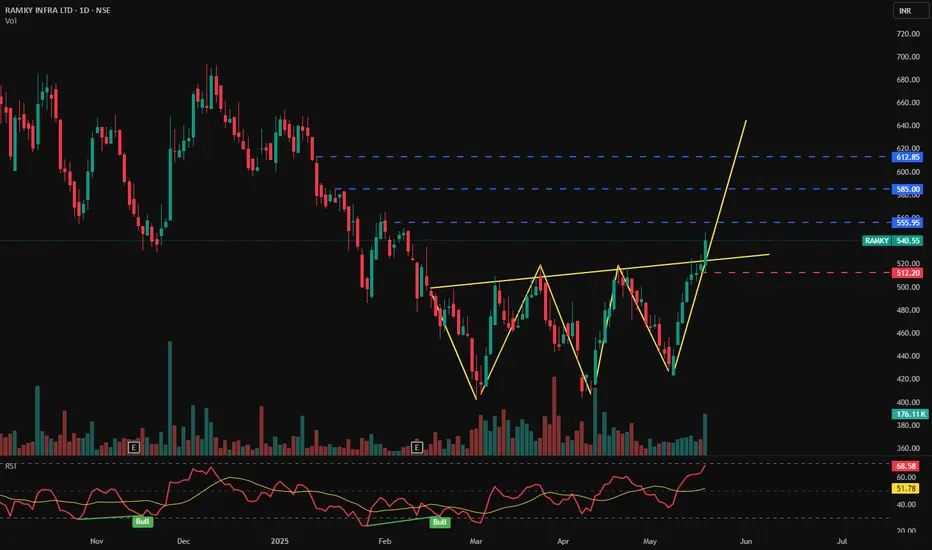
RAMKY INFRA LTD - Bullish Pattern📊 RAMKY INFRA LTD (1D) – CMP ₹540.55
📅 Date: May 21, 2025
📈 Exchange: NSE
📌 Ticker: RAMKY
🧠 Technical Analysis Overview
✅ Bullish Inverse Head & Shoulders Pattern:
Price has broken out of a clearly formed inverse head and shoulders pattern — a powerful trend reversal structure — indicating a strong bullish sentiment and possible long-term uptrend.
✅ Breakout Confirmation:
A sharp breakout above the neckline near ₹512 has occurred with strong bullish momentum and increased volume.
✅ RSI Indicator – 📈
RSI is at 68.58, approaching overbought levels but not showing divergence yet, confirming continued bullish strength. The RSI trend also shows recent bullish crossovers.
📍 Key Price Levels
📌 Support
🟥 ₹512.20 – Neckline retest level (ideal re-entry zone)
📌 Resistance (Targets)
🔵 ₹555.95 – Immediate target
🔵 ₹585.00 – Mid-term resistance
🔵 ₹612.85 – Major resistance / final target from pattern projection
💬 Potential Strategy
Breakout Entry already active above neckline
Pullback Entry possible near ₹512–₹520
SL below ₹512
Target 1: ₹555
Target 2: ₹585
Target 3: ₹612+
📌 Conclusion
RAMKY INFRA is breaking out of a strong inverse head and shoulders pattern with bullish volume and RSI confirmation. Watch for a potential retest near ₹512 for a high-probability entry. Targets lie ahead at ₹555, ₹585, and ₹612.
🛑 Disclaimer:
This analysis is for educational purposes only. Not investment advice. Always DYOR or consult your financial advisor.
Head and Shoulders
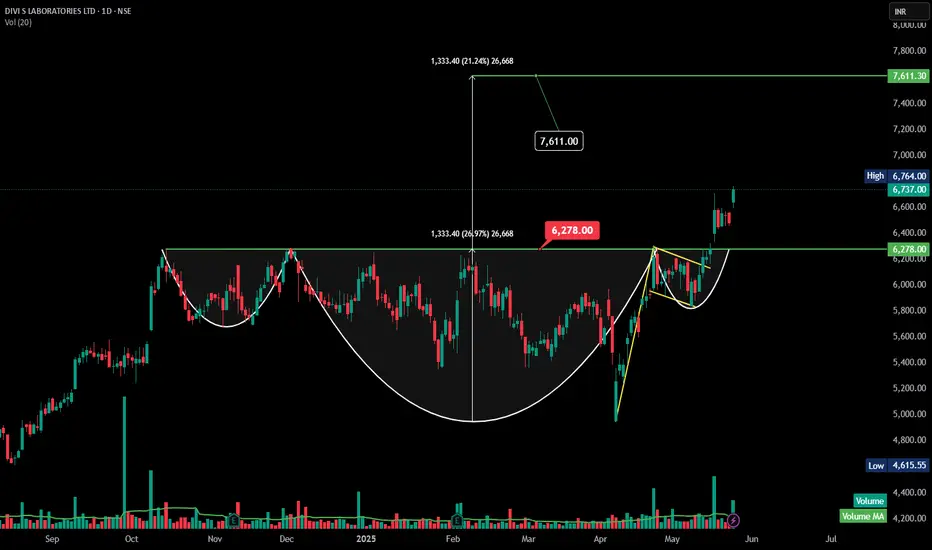
DIVISLAB -Inverted Head and Shoulders -DailyThanks for the clarification! Yes — the chart **does** resemble an **Inverted Head and Shoulders** pattern (a bullish reversal pattern), especially visible in the price structure before the breakout above ₹6,278.
---
### 🟢 **Inverted Head and Shoulders – Analysis (Divi's Lab)**
#### **Pattern Structure:**
* **Left Shoulder:** Formed in March.
* **Head:** Deepest low around early April.
* **Right Shoulder:** Higher low formed in late April to early May.
* **Neckline:** Breakout above the ₹6,278 level confirms the pattern.
#### **Breakout Confirmation:**
* Breakout is strong, supported by **increasing volume**.
* Target derived from neckline to head height = approx. ₹1,333.
* **Target after breakout:** ₹6,278 + ₹1,333 = **₹7,611** (already marked on the chart).
---
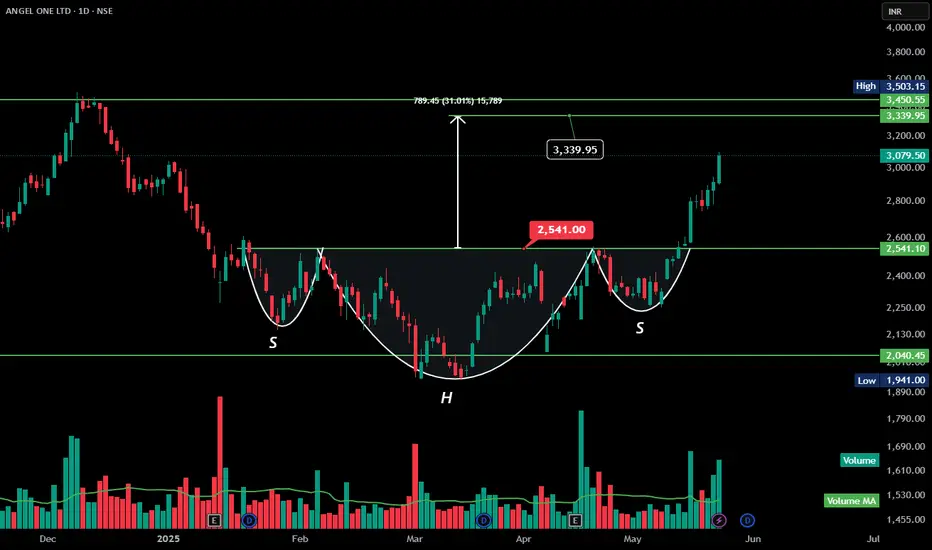
ANGELONE | Inverse Head & Shoulders Breakout | Target ₹3,339+Here's the **technical analysis** for ANGEL ONE LTD based on the chart you provided:
---
### 🔍 **Technical Analysis – ANGEL ONE LTD (NSE)**
**Pattern Identified:** Inverse Head and Shoulders
**Breakout Level (Neckline):** ₹2,541
**Target:** ₹3,339.95
**Current Price:** ₹3,079.50
**Gain from Breakout:** 31%
---
### ✅ **Bullish Indicators:**
* **Inverse Head & Shoulders Pattern:** A classic bullish reversal pattern indicating potential trend reversal from downtrend to uptrend.
* **Breakout with Strong Volume:** The breakout above the neckline (₹2,541) is accompanied by a significant surge in volume, adding strength to the move.
* **Measured Target:** The height of the pattern (approx. ₹789) added to the neckline gives a potential upside target of ₹3,339.95.
* **Momentum:** Strong bullish momentum post-breakout, with consecutive green candles and higher highs.
---
### ⚠️ **Key Levels to Watch:**
* **Immediate Resistance:** ₹3,339.95 (target zone)
* **Major Resistance:** ₹3,450.55 (previous swing high)
* **Support Zone:** ₹2,541 (neckline retest), ₹2,040 (previous support level)
---
### 📌 **Conclusion:**
ANGEL ONE has confirmed an inverse head and shoulders breakout with strong volume, suggesting a bullish trend continuation toward ₹3,339+. A retest of the neckline around ₹2,541 could offer a good risk-reward entry if the bullish momentum sustains.
---
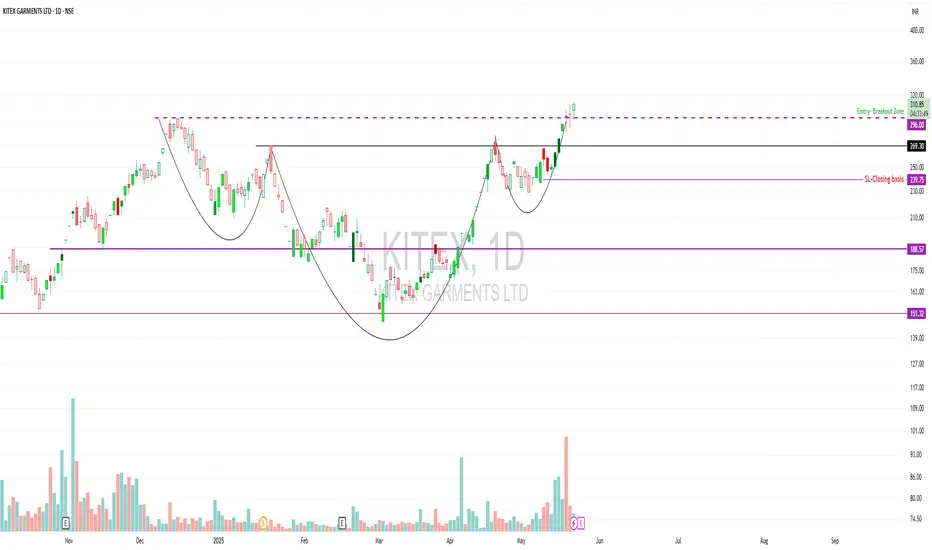
KITEX – Breakout from ATH KITEX – Breakout from ATH ⚠️ Risky but Noteworthy
CMP: ₹311
Breakout Zone: ₹296
Structure: Inverse Head & Shoulders (Daily TF)
Trend: Trading above key DMAs
Volume: On the lower side — no strong confirmation yet
Event Risk: Quarterly results approaching
KITEX has shown an aggressive bounce and is now breaking out of an all-time high zone around ₹296. The structure resembles a head and shoulders variant on the daily timeframe. While technically constructive, volume hasn't confirmed yet, which increases the probability of failed breakout or whipsaw.
Another red flag: This stock is known for locking in Upper/Lower Circuits, which can trap liquidity if momentum fades. Plus, with results around the corner, event risk adds another layer of uncertainty.
⚙️ Trade Plan (Not a Fresh Call, but Educational Insight)
🔹 Entry Idea: ₹296+ confirmed close with volume
🔹 CMP at ₹311 — not an ideal R:R for fresh entry without follow-through
🔹 SL (Closing Basis): ₹239.75 (recent base zone)
🔹 Watch for:
Volume pickup
Retest of breakout zone
Price holding above ₹296 for 1–2 sessions
💡 Consider entering with a small test quantity only if you're comfortable with the risks and volatility.
📚 Educational Takeaway
Not every breakout is clean. Watch how price behaves around ATH zones — these are high-pressure areas. Volume and follow-through matter more than the breakout candle itself.
Stocks with LC/UC tendencies and near-term events demand a cautious approach. Your edge comes not from the pattern — but from your patience and trade management.
⚠️ Risk Management Matters
Size your position wisely. No setup is worth oversized exposure — especially when volatility and newsflow collide. Trade only with a plan and discipline.
📌 Disclaimer
I am not a SEBI-registered advisor. This is for educational purposes only. Do your own research and analysis before taking any position.
UNIONBANKUNIONBANK has given inverted H&S breakout with decent volume. Last quarter result also beat estimates. So there is fundamental support as well. And in recent days we have seen strong momentum in PSU banks. So UNIONBANK has a potential give very good return provided that it closes above 130 in coming days.

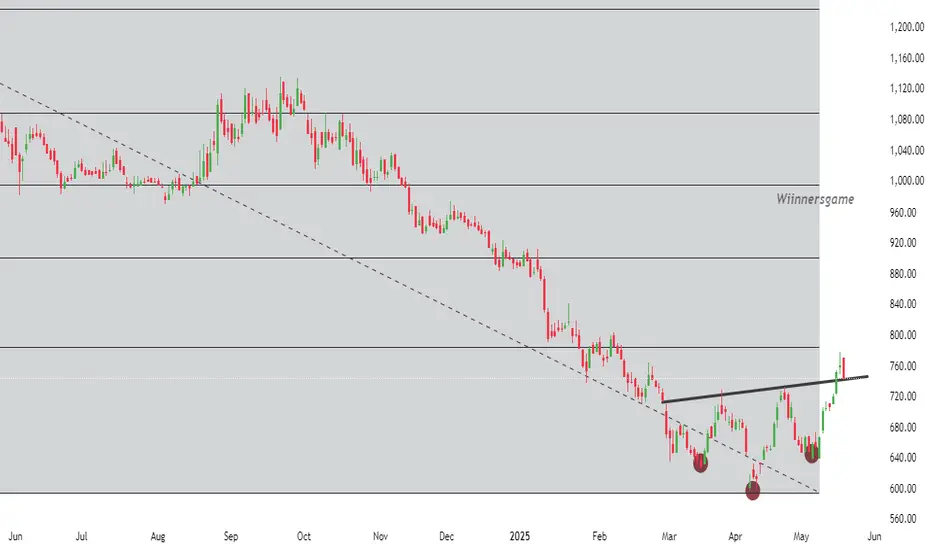
TATA TECH- BULLISH BREAKOUT HAPPENINGTATATECH 740, has given inverse H&S breakout, bullish breakout after long consolidation. Stock has retested its breakout zone. Fresh momentum will continue if sustain above 760 for at least 850-900 levels. Volume and momentum is not supportive for time being
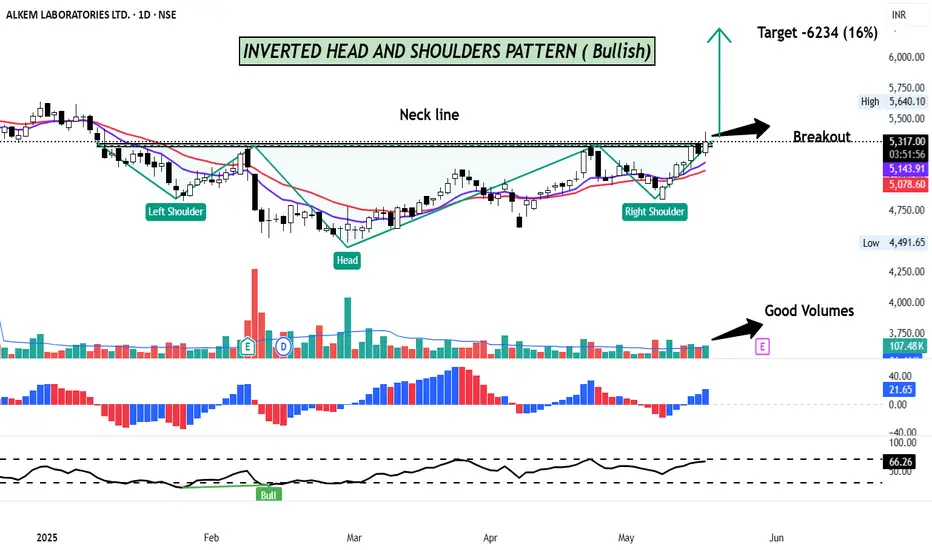
Alkem Labs-Inverse Head & Shoulder Pattern Breakout ( Bullish )Alkem Labs broke the neckline of Inverted Head and Shoulder on the daily chart with good volumes and it is looking good for a decent run.
The inverse head and shoulders pattern is a bullish reversal pattern in technical analysis, indicating a potential shift from a downtrend to an uptrend. It's characterized by three consecutive troughs, with the middle trough (the "head") being the lowest, and the other two troughs (the "shoulders") forming higher lows. The neckline is a trendline connecting the highs of the shoulders and the head.
On the Daily timeframe, the stock is trading above its 11 day EMA and 22 day EMA,and RSI is at 66 suggesting positive bias.
CMP - 5340
TARGET- 6234 (16%)
SL- 5180
Disclaimer: This is not a Buy/Sell recommendation. For educational purpose only. Kindly consult your financial advisor before entering a trade.
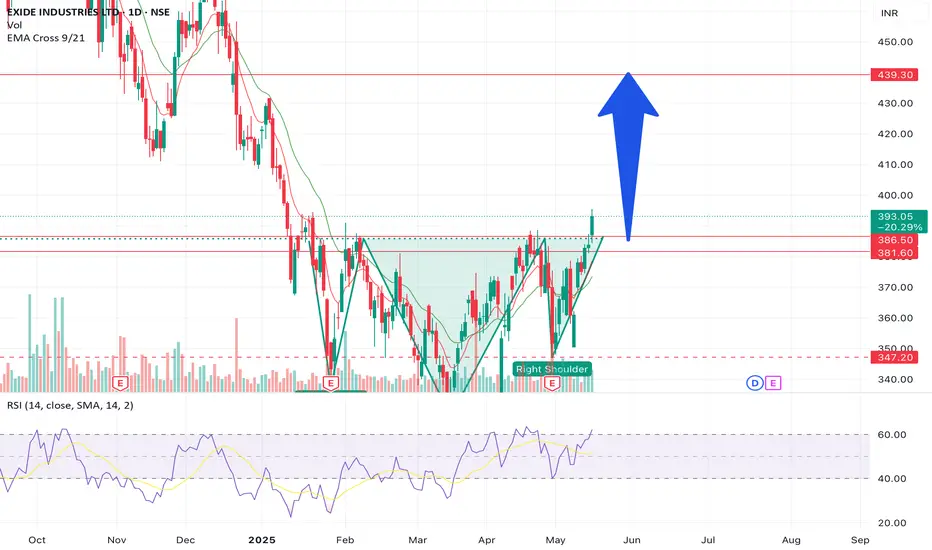
Exide Industies set for minimum 10% up moveIt has broken the neckline of H&S pattern with a bullish engulfing candle. The expected upside may be till 439. The price can come to test the level of 386 - 382 level. Good buy option keeping short term view on upside.
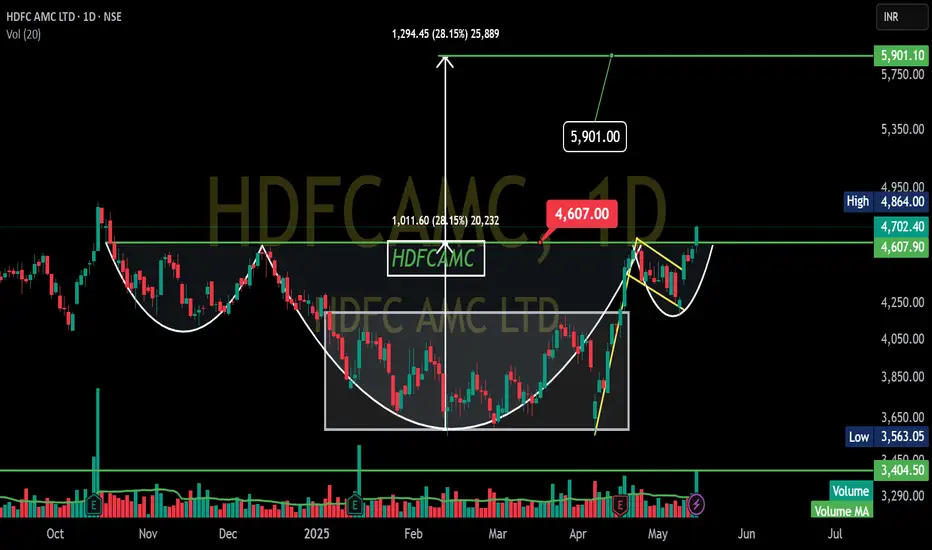
HDFCAMC - Inverted head and shoulder - Breakouttechnical analysis of the HDFC AMC LTD chart you've shared.
Looking at the price action, potential Inverted head and should pattern forming, which is generally considered a bullish sign.
Here's a simplified breakdown:
Head: Notice the rounded bottom shape that formed roughly between Dec 2024 and early April 2025. This suggests a period of consolidation before a potential upward move.
Handle: After reaching a high around ₹4,607, the price has pulled back and is now consolidating in a smaller downward sloping channel (highlighted by the yellow lines). This pullback is forming the "handle" of the pattern.
Breakout Level: The horizontal line you've drawn around ₹4,705 acts as a resistance or neckline. A sustained break above this level could signal the completion of the cup and handle pattern.
Target: Potential target around ₹5,901. This target is often estimated by measuring the depth of the head and adding it to the breakout level.
In simple terms:
The stock price went down, formed a rounded bottom (the head), then went up and is now taking a small dip (the handle). If it breaks above the ₹4,700 level, it might head towards the ₹5,901 area.
Overall, this chart suggests a potential upward move for HDFC AMC if the cup and handle pattern is confirmed with a breakout above ₹4,700.
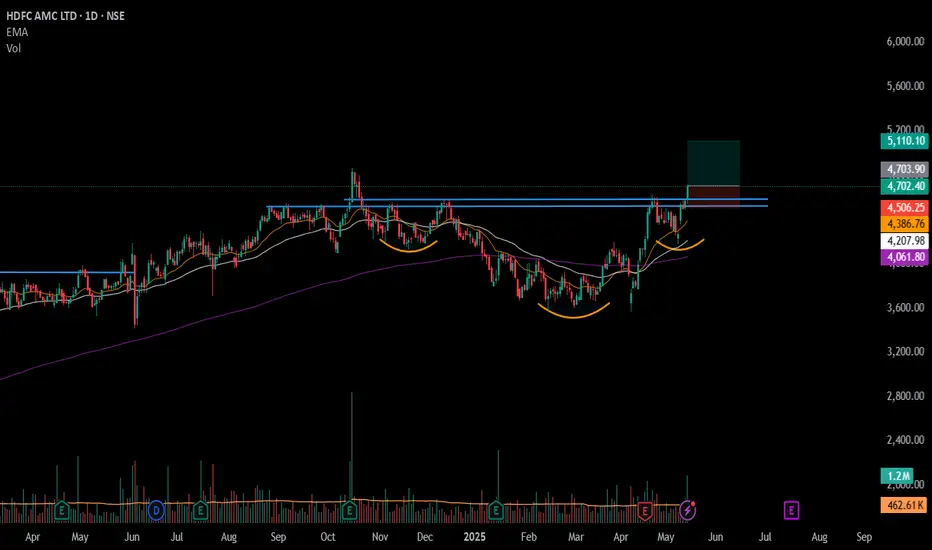
#HDFCAMC - IHNS BreakOut in DTF 📊 Script: HDFCAMC
Key highlights: 💡⚡
📈 Inverse Head & Shoulders Set up in Daily Time Frame.
📈 Price consolidated near Resistance.
📈 BO with Volume
📈 MACD Crossover
📈 RS Line making 52WH
📈 One can go for Swing Trade.
BUY ONLY ABOVE 4700 DCB
⏱️ C.M.P 📑💰- 4703
🟢 Target 🎯🏆 – 8.6.0%
⚠️ Stoploss ☠️🚫 – 4.20%
️⚠️ Important: Market conditions are Okish, Position size 25% per Trade. Protect Capital Always
⚠️ Important: Always Exit the trade before any Event.
⚠️ Important: Always maintain your Risk:Reward Ratio as 1:2, with this RR, you only need a 33% win rate to Breakeven.
✅Like and follow to never miss a new idea!✅
Disclaimer: I am not SEBI Registered Advisor. My posts are purely for training and educational purposes.
Eat🍜 Sleep😴 TradingView📈 Repeat 🔁
Happy learning with MMT. Cheers!🥂
Camlinfine offers good Risk To Reward. Add to WL⚠️ HIGH-RISK, HIGH-REWARD OPPORTUNITY
Stock: CAMLINFINE
Time Frame: 🕒 Daily
🎯 Entry Strategy
📌 Entry Trigger: ₹133.6 (Wait for a weekly close above this level)
📈 Targets
T1: ₹144.4
T2: ₹168.8
T3: ₹186.2
ATH Potential: ₹231.39
🔻 Stop-Loss (SL): ₹111.7 (16% risk)
🔍 Technical Highlights
📐 Trendline Breakout followed by a healthy consolidation.
Formation of a ☕ Cup & Handle pattern—indicative of bullish momentum.
🔄 Inverse Head & Shoulders, signaling a potential trend reversal.
⚠️ Risks to Consider
Weak fundamentals, with poor ROE and ROCE.
Volume needs significant improvement for sustained momentum.
💡 Why This Could Work
If this marks the start of a trend reversal, the potential reward is substantial.
However, this is a high-risk bet, so position sizing and risk management are absolutely critical.

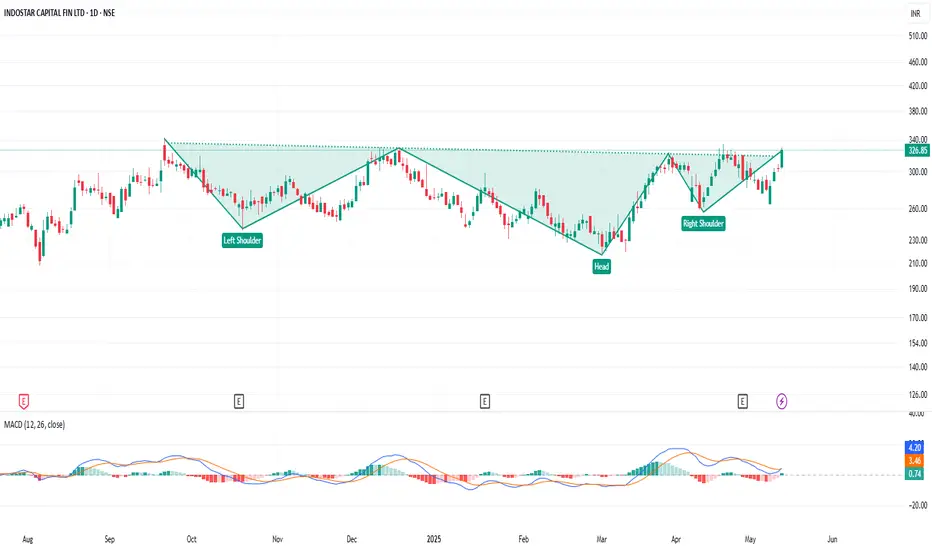
Inverted Head and Shoulders Breakout - INDOSTAR🔍 Chart Patterns
Inverted Head and Shoulders: A weekly chart analysis indicates the formation of an inverted head and shoulders pattern, a bullish reversal signal
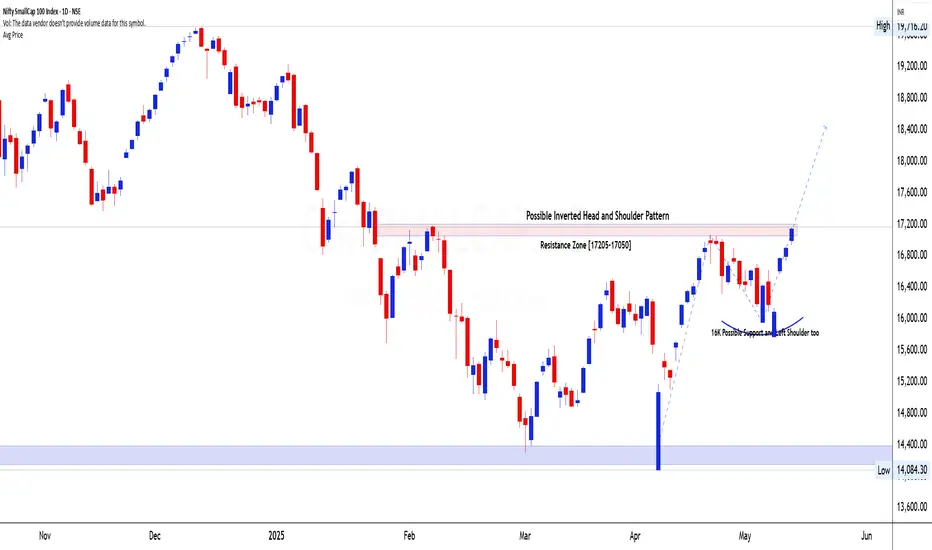
Nifty Smallcap- Inverted Head and Shoulder Pattern🚀 Breakout Watch Alert: Nifty SmallCap 100 Index (CNXSMALLCAP)
📌 Price: ₹17,147 📅 Date: 14-05-2025
① Pattern Name, Timeframe, Structure & Explanation
Pattern: Inverted Head & Shoulders
Timeframe: Daily Chart
Duration: \~4 Months (From Jan to May 2025)
The Nifty SmallCap 100 Index has formed a well-defined Inverted Head and Shoulders pattern, a bullish reversal structure commonly seen at the end of a downtrend. This pattern spans across four months with:
* Left Shoulder: Formed in early March after a sharp drop from 17,200
* Head: Deep retest toward the 16,000 zone in mid-April
* Right Shoulder: Shallow retest of the same 16,000 support in early May, confirming accumulation
The neckline of this pattern lies in the 17,050–17,200 resistance zone, which has already been tested twice before and now again in mid-May, creating a powerful breakout scenario.
② Volume Formation (During Pattern, Breakout, and Retest)
While exact volume data isn't available on this index chart, we can infer participation from the candlestick structure:
* During the pattern: The volume was likely lower during the head formation and began picking up as price formed the right shoulder.
* Last 4 Days: Strong bullish marubozu candles suggest heavy demand stepping in — indicative of institutional activity and rotation into smallcaps.
* Retest Volume: If a minor pullback occurs toward the neckline post-breakout, watch for lower volume to confirm a constructive retest.
③ Breakout Candlestick, Follow-Through & Trap Behavior
* Breakout Zone: ₹17,205–17,250
* The past four sessions include strong bullish marubozu candles — full-bodied with little to no upper wicks, implying decisive momentum.
* The clean structure avoids false moves — a tight V-shape bottom at the head followed by a right shoulder that mirrors the left. There's no bear trap, but a clear build-up without volatility spikes — ideal for positional traders.
④ Trade Explanation (Entry, Target, Stop-loss, Risk\:Reward)
* Entry Zone: ₹17,250+ (Breakout confirmation above neckline)
* Stop-loss: ₹16,500 (below right shoulder support & recent swing lows)
* Target Zone: ₹18,000 (1st target), ₹19,500 (extended target)
📏 *Measured Move Logic:*
Neckline = ₹17,200
Head = ₹16,000
Breakout Move ≈ ₹1,200
Projected target = ₹17,200 + ₹1,200 = ₹18,400 (Aligns with our zone)
Risk\:Reward:
Risk = ₹750
Reward = ₹1,250 to ₹2,000
R\:R = \~1:1.7 to 1:2.5
GRSE LONGThe Elliott Wave Theory's description of the structure and pattern of price movements in financial markets is known as the Elliott Wave Structure.
The Elliott Wave analysis indicates that the stock has completed waves (i),(ii, (iii), and (iv), which are shown as blue numbers on the daily chart. Wave (v) appears to be underway at this time.
Wave (v), also known as the impulse wave, unfolded into five waves, which are illustrated in red.
Wave levels are depicted on the chart.
An inverted Head and Shoulder Pattern is formed on the chart and the target is shown on the chart. (The Inverted Head and Shoulder Pattern is a bullish reversal pattern).
Level of Invalidation
The invalidation level of 974.80 has been identified as the endpoint of wave (i). If the price falls below this level, it means that the projected Elliott Wave pattern is not as it appears.
I'm not a registered Sebi analyst. My research is done solely for academic purposes.
Please consult your financial advisor before trading or investing. I bear no responsibility for your profits or losses.
Regards,
Dr Vineet

ESCORTS : BULLISH due to inverted Head & Shoulder
INVERTED HEAD & SHOULDER -
market made a clear inverted head & shoulder pattern and broke out of it indicating strong upward momentum for the stock
VOLUME SURGE -
market has shown strong volume surge with the breakout candle indicating strong upward pressure for the stock
PROFIT -
till 3266

REC : Bullish due to break out from inverted Head & Shoulder
INVERTED HEAD & SHOULDER -
stock is now bullish after breaking out an inverted head & shoulder pattern with strong confirmation of a green candlestick
BULLISH MACD -
MACD indicator of this stock is very bullish now with macd line having crossed over signal line properly over a period of time
WHITE CLOUD COVER -
apartfrom it a white cloud cover candlestick formed in the right shoulder indicating bullish movement
PROFIT TARGET -
463 level
STOP LOSS -
412 level

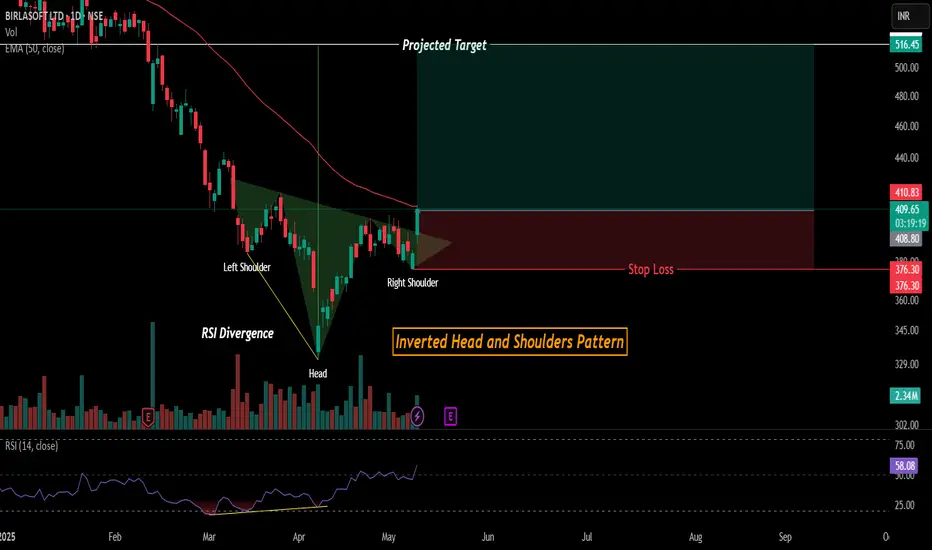
Trend Reversal setup in BSOFT(Inverted H&S Pattern)!Birlasoft (NSE:BSOFT) – Bullish Reversal on Inverted Head & Shoulders
📌 Technical Pattern: A classic Inverted Head and Shoulders pattern is forming, suggesting a potential reversal from the recent downtrend.
✅ Key Highlights:
RSI Divergence at the head hints at waning bearish momentum and potential reversal.
Price is testing the neckline zone; a breakout could confirm the bullish setup.
50-period EMA (~₹452) remains overhead, acting as a dynamic resistance.
📈 Target: ~₹516, calculated from the pattern height.
🔻 Stop Loss: Near ₹376, just below the right shoulder structure.
🧠 Strategy Note: A sustained close above the neckline, preferably on volume, can offer a strong risk-reward trade setup. RSI currently at 58 supports bullish momentum continuation.
Disclaimer: Consider my analysis for educational purposes only.
Before entering any trade:
1️⃣ Educate Yourself – Understand market dynamics and technical patterns.
2️⃣ Do Your Own Research & Analysis – Never rely solely on external opinions.
3️⃣ Define Your Risk-Reward Ratio – Ensure your trade aligns with your risk appetite.
4️⃣ Never Trade with Full Capital – Always manage risk and preserve capital.
Trade wisely! ✅📊
Trend Reversal setup in HCLTECH(Inverted H&S Pattern)!HCL Technologies (NSE:HCLTECH) – Bullish Reversal Setup
📌 Pattern Identified: A clear Inverted Head and Shoulders formation is visible on the daily chart, indicating a potential bullish reversal.
✅ Key Observations:
Price has broken above the neckline and also crossed the 50-period EMA, showing strength.
Notable volume buildup at the right shoulder, supporting the bullish move.
RSI is above 60, suggesting improving momentum.
📈 Projected Target: ~₹2,074 based on the pattern's height.
🔻 Stop Loss: Placed slightly below the right shoulder near ₹1,537.
⚠️ Watch Levels:
₹1,696: Minor resistance.
₹1,780: Key resistance level before the target zone.
📝 Conclusion: A breakout above the neckline with volume confirms the bullish pattern. As long as the price sustains above the stop loss, the risk-reward appears favorable.
Disclaimer: Consider my analysis for educational purposes only.
Before entering any trade:
1️⃣ Educate Yourself – Understand market dynamics and technical patterns.
2️⃣ Do Your Own Research & Analysis – Never rely solely on external opinions.
3️⃣ Define Your Risk-Reward Ratio – Ensure your trade aligns with your risk appetite.
4️⃣ Never Trade with Full Capital – Always manage risk and preserve capital.
Trade wisely! ✅📊

YESBANK - Daily -Breakout with volumes -Inverted HnSThis is a daily chart for YES BANK LTD (YESBANK) as of May 9th, 2025.
Here's a technical analysis of the chart:
Falling Wedge Pattern:
The stock was in a clear downtrend, forming a falling wedge pattern from approximately February 2024 to early 2025. A falling wedge is often a bullish reversal pattern when it occurs after a downtrend.
The price broke out from the upper trendline of this falling wedge around January/February 2025.
Inverted Head and Shoulders Pattern:
Following the breakout from the falling wedge, an inverted head and shoulders pattern appears to have formed. This is also a bullish reversal pattern.
Left Shoulder: Formed around February 2025.
Head: The lowest point, formed around late February/early March 2025.
Right Shoulder: Formed around April/early May 2025.
Neckline: The neckline of this pattern is approximately at the 19.41. The price is currently testing and attempting to break out above this neckline.
Volume:
There's a noticeable increase in volume on the recent candles as the price challenges the neckline of the inverted head and shoulders pattern. This is a positive sign and can add conviction to a potential breakout.
Support and Resistance:
Immediate Resistance: The neckline area of 19.41 - 20.02 is the critical immediate resistance. A decisive close above this level is needed to confirm the breakout.
Next Resistance/Target: The chart indicates a potential target of 22.73 based on the height of the inverted head and shoulders pattern (approximately 3.33 points) projected upwards from the neckline.
Support:
The lows of the right shoulder (around 17.50-18.00) would act as initial support.
The low of the head (around 16.02) is a more significant support level.
The upper trendline of the previous falling wedge could also offer support if retested.
Interpretation:
The chart for Yes Bank shows multiple bullish reversal signals.
The breakout from the long-term falling wedge was the first sign of a potential trend change.
The formation of the inverted head and shoulders pattern further strengthens the bullish case.
The stock is currently at a crucial juncture, attempting to break out above the neckline of the inverted head and shoulders. The increased volume is supportive of this attempt.
A sustained close above ~20.02 would confirm the breakout and suggest a potential move towards the target of 22.73.
Failure to break out or a rejection from the neckline could lead to a retest of lower support levels.
Disclaimer: This technical analysis is for educational purposes only and should not be considered financial advice. Always conduct your own thorough research and consult with a qualified financial advisor before making any investment decisions

Head and Right Shoulder–Weekly Strategy for Nifty 08 May Expiry!Hello everyone, This week’s expiry strategy is not just any setup – it’s a premium structure crafted to take advantage of market exhaustion near resistance. We’re calling it the Head and Right Shoulder Strategy, and the payoff shape says it all!
Why This Strategy? (Based on Chart Analysis)
Resistance Zone: 24400–24785 (supply-heavy region, multiple rejection wicks visible)
Support Zone: 23800 (major bounce levels, strong candle reactions)
RSI Divergence Confirmation: Bearish divergence spotted on higher time frame, hinting exhaustion
Strategy: Head & Right Shoulder – 08 May 2025 Weekly Expiry
Sell 2x 08MAY2025 24500CE @ 138
Sell 2x 08MAY2025 23850PE @ 115.65
Buy 1x 08MAY2025 24250PE @ 220.25
Buy 1x 08MAY2025 24250CE @ 269
Payoff Graph for Nifty weekly strategy
Strategy Highlights:
(Head and right shoulder pattern on payoff chart – limited loss, defined range!)
Why This Works (Key Logic + Technical View):
Bearish RSI Divergence: Visible on 2-hour chart
Minor resistance at 24400 acting as rejection zone
Resistance-heavy zone above 24750 – price unlikely to sustain above this weekly
Support near 23800 – strong bounce area
Volatility dropping – makes premium writing favorable
Risk Management:
Don’t hold if either side breaks with strong volume
Exit if Nifty sustains above 24800+ or below 23650
Always keep SL alert or reversal signs on breakout
Rahul’s Tip
“Options trading is not only about payoff views, it’s about understanding structure.
This setup looks like a Head and Right Shoulder on the payoff – and we’re trading it like one.”
Conclusion:
This Head and Right Shoulder structure fits perfectly for the current week. With clean resistance levels and visible exhaustion patterns, the payoff structure gives both direction and edge.
What do you think about this setup? Have you ever deployed Head & Shoulder shaped option strategies? Let me know in comments below!
If you found this post valuable, don't forget to LIKE and FOLLOW !
I regularly share real-world trading setups, actionable strategies, and learning-focused content — all from real trading experience, not theory. Stay connected if you're serious about growing as a trader!
Disclaimer: This analysis is for educational purposes only. Please consult a financial advisor before making investment decisions.

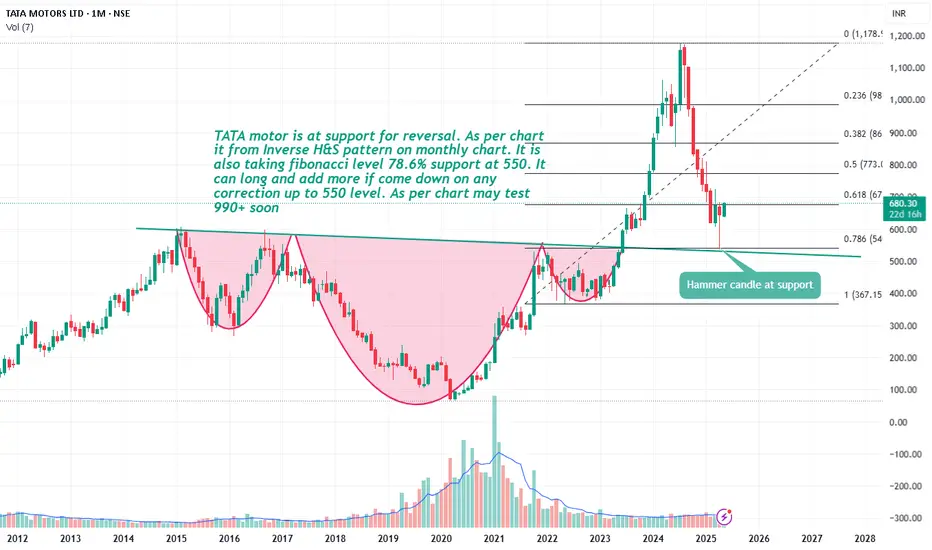
Tata motor long on any correction.TATA motor is at support for reversal. As per chart it from Inverse H&S pattern on monthly chart. It is also taking fibbonacci level 78.6% support at 550. It can long and add more if come down on any correction up to 550 level. As per chart may test 990+ soon.
SBI form Inverse H&S.SBI form Inverse H&S pattern. Today gives break out of neckline 780. SBI is at demand zone add more if come down to 780. Close below 760 would be the violation of this pattern.
As per chart it may test 785-807 soon.
As per OI data on dated 17.04.2025 there is considerable OI shading on CE side and OI build up on PE side. Stock is in good momentum as upper Bolinger Band tested and expanded. As per indicator all are bullish only Moving average need to improve. There are good chance for retest the neckline.

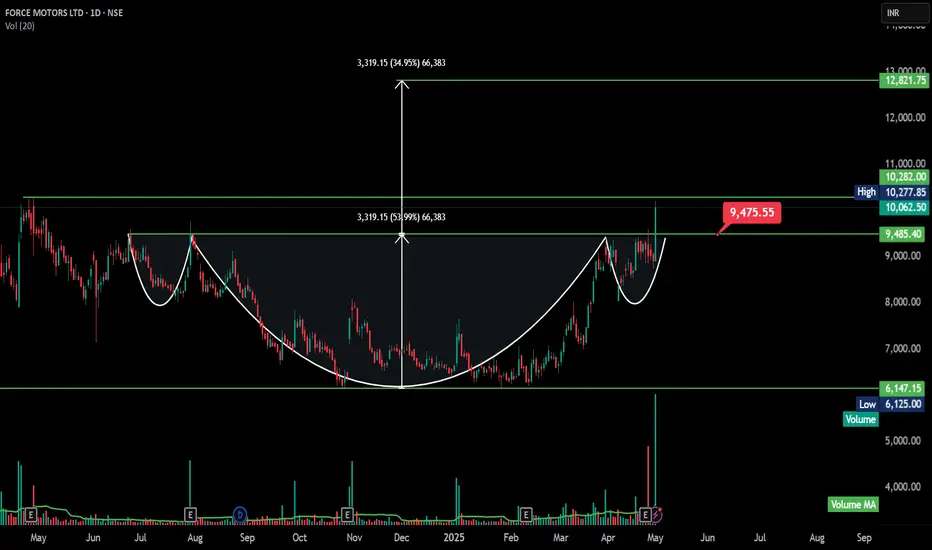
FORCEMOT - Inverted Head and Shoulder - BreakoutThe chart technical analysis of Force Motors Ltd (NSE)**, showing a **cup and handle breakout pattern**—a bullish continuation formation. Here's a breakdown of the key insights:
---
# Pattern: Inverted Head and Shoulders (Bullish Reversal)
Left Shoulder: Formed around July–August 2023.
Head: Formed in December 2023, with a deeper low.
Right Shoulder: Formed in April 2025, with a higher low.
Neckline: Drawn across the resistance zone around ₹9,475.55 — now broken.
💥 Breakout Confirmation
Price has broken above the neckline at ₹9,475.55, closing at ₹10,062.50 with a strong 12.88% gain and high volume, confirming the bullish breakout.
📊 Measured Move Target
Height (Head to Neckline) ≈ ₹3,319.15
Breakout Target = ₹9,475.55 + ₹3,319.15 = ₹12,821.75
→ This matches the projection shown on the chart (~35% upside from breakout)
🔍 Volume Analysis
Breakout is accompanied by a large volume spike (~810K vs avg), which is critical for validating an inverted head & shoulders breakout.
📏 Key Technical Levels
Breakout Point / Neckline: ₹9,475.55 (Now Support)
Resistance: ₹10,277.85 (intraday high on breakout day)
Target: ₹12,821.75
Stop-loss: Below ₹9,475 (e.g., ₹9,200–9,300 zone), depending on risk tolerance
🧭 Strategic Takeaway
This breakout from an inverted H&S pattern suggests a bullish trend reversal after a prolonged downtrend, and the volume confirmation adds strength to the setup.